[Preprint]. 2023 Sep 26:2023.09.25.559347.
doi: 10.1101/2023.09.25.559347.

A suite of engineered mice for interrogating psychedelic drug actions

Affiliations

A suite of engineered mice for interrogating psychedelic drug actions

Yi-Ting Chiu et al. bioRxiv. .

Abstract

Psychedelic drugs like lysergic acid diethylamide (LSD) and psilocybin have emerged as potentially transformative therapeutics for many neuropsychiatric diseases, including depression, anxiety, post-traumatic stress disorder, migraine, and cluster headaches. LSD and psilocybin exert their psychedelic effects via activation of the 5-hydroxytryptamine 2A receptor (HTR2A). Here we provide a suite of engineered mice useful for clarifying the role of HTR2A and HTR2A-expressing neurons in psychedelic drug actions. We first generated Htr2a-EGFP-CT-IRES-CreERT2 mice (CT:C-terminus) to independently identify both HTR2A-EGFP-CT receptors and HTR2A-containing cells thereby providing a detailed anatomical map of HTR2A and identifying cell types that express HTR2A. We also generated a humanized Htr2a mouse line and an additional constitutive Htr2A-Cre mouse line. Psychedelics induced a variety of known behavioral changes in our mice validating their utility for behavioral studies. Finally, electrophysiology studies revealed that extracellular 5-HT elicited a HTR2A-mediated robust increase in firing of genetically-identified pyramidal neurons--consistent with a plasma membrane localization and mode of action. These mouse lines represent invaluable tools for elucidating the molecular, cellular, pharmacological, physiological, behavioral, and other actions of psychedelic drugs in vivo.


Figures
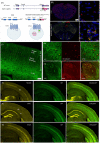
Fig 1.
Fig 1.. The genetic design of Htr2a-EGFP-CT-IRES-CreERT2 knockin mice and validation
(A) Schema of the transgenic modifications at the murine Htr2a gene in exon 3. For Htr2a-EGFP-CT-IRES-CreERT2 (Htr2aEGFP-CreERT2) mouse line, EGFP was inserted into the C terminus (CT) of the receptor, after residue 452. An IRES-CreERT2 cassette was inserted between the Htr2a stop codon and the 3’UTR. Blue boxes represent exons of murine Htr2a; the green box is EGFP; the red box shows the STOP codon. The gray box is the IRES followed by a pink box for CreERT2. The schematic was created with https://www.biorender.com/. (B) Validation of Egfp and Htr2a mRNA expressions in the mouse brain: RNAscope experiments were performed to probe Egfp and Htr2a mRNA in C57 (Htr2a+/+) and Htr2a EGFP-CreERT2/EGFP-CreERT2 mice. The Htr2a (red) probe can be detected in C57 mice; Egfp (green) and Htr2a (red) probes showed co-localization (yellow) in Htr2aEGFP-CreERT2/EGFP-CreERT2 mice. Images were taken under an Olympus slide scanner with 10X objective and an Olympus confocal microscope with a 60X objective. (C) The expression pattern of HTR2A in cortical pyramidal neurons (soma, apical dendrites, and apical tufts). Images were taken with a 20X objective under an Olympus confocal microscope. (D) Paravalbumin is the GABAergic interneuron marker. The brain sections from Htr2a EGFP-CreERT2/+ mice were stained with anti-parvalbumin and anti-GFP antibodies. The yellow arrowhead denotes parvalbumin-positive and GFP-positive interneurons. Images were captured under a 60X objective with an Olympus confocal microscope. (E) Cortical L5a marker NECAB1 was used to locate the cortical layer 5a distribution. HTR2A-EGFP-CT fusion receptors with anti-GFP staining showed its distribution in the NECAB1-positive layer. (F) With CTIP2 as a cortical L5b/L6 marker, HTR2A-EGFP-CT did not show overlap with the Ctip2-positive layers. (G) An anti-HTR2A antibody showed the same pattern as the anti-GFP distribution associated with HTR2A-EGFP-CT. Note, all brain sections in Figures 1E–1H from Htr2aEGFP-CreERT2/+ mice were stained with an anti-GFP antibody for HTR2A-EGFP-CT and different cortical markers (NECAB1, CTIP2), as well as with an anti-HTR2A antibody. (H) The distribution pattern of HTR2A-EGFP-CT labeling in the dorsal striatum. The Mu opioid receptor (MOR) is rich in the striosome and subcallosal stria of the CaudatePutamen (CPu). HTR2A-EGFP-CT signals showed the same expression pattern with MOR distribution in the patch-like (striosome) area and stria. Experiments in this figure were conducted with 3–4 mice with similar results. Images were taken using an Olympus VS120 slide scanner or an Olympus confocal microscope under 60X objective.
Fig 2.
Fig 2.. The distribution of the HTR2A-EGFP-CT fusion protein in mouse brain
Brain sections from Htr2aEGFP-CreERT2/+ mice were stained with a GFP antibody to amplify the HTR2A-EGFP-CT signal and then were acquisitioned with an Olympus slide scanner under 10X objective. The abbreviations for the brain areas are located in the Supplementary Figure. The raw images were uploaded to open-source website, A Mouse Imaging Server (AMIS, https://amis2.docking.org/.
Fig 3.
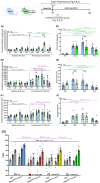
Fig 3.. Pharmacological effects of psychedelics (LSD, DOI, and Psilocin) on behaviors in C57BL/6J and Htr2aEGFP-CreERT2/EGFP-CreERT2 mice
(A-C) Cumulative motor activities Cumulative baseline activities (0–30 min; pre-administration) and cumulative post-injection activities following administration (31–120 min) of the vehicle (Veh), LSD (0.3 mg/kg), DOI (1 mg/kg) or psilocin (Psil, 1 mg/kg); n=9–10 mice/genotype/treatment. Note, the C57BL/6J and Htr2aEGFP-CreERT2/EGFP-CreERT2 mice are termed C57 and Htr2aEGFP-CreERT2 mice, respectively, below and in the figure panels. The symbol “*” is for genotype difference (black); “+” is for within C57 effect (blue); “^” for within Htr2aEGFP-CreET2 effect (green), and “#” for overall treatment effects (purple). All data are represented as means ± SEMs. (A) Locomotor activities in C57 and Htr2aEGFP-CreERT2 mice. Two-way ANOVA for baseline: genotype [F(1,69)=8.968, p=0.004]; for C57 vs. Htr2aEGFP-CreERT2 mice (black): **p<0.01, overall genotype effects. Two-way ANCOVA for post-injection: genotype [F(1,68)=19.433, p<0.001], treatment [F(3,68)=29.894, p<0.001], and genotype by treatment interaction [F(3,68)=11.143, p<0.001]; Bonferroni post-hoc tests; for C57 vs. Htr2aEGFP-CreERT2 mice (black): ***p<0.001, DOI; for C57 mice (blue): +p<0.05, Veh vs. DOI; for Htr2aEGFP-CreERT2 mice (green): ^^^p<0.001, Veh, LSD, Psil vs. DOI. (B) Rearing activities in the same mice. Two-way ANOVA for baseline: genotype [F(1,69)=9.307, p=0.003]; for C57 vs. Htr2aEGFP-CreERT2 mice (black): **p<0.01, overall genotype effects. Two-way ANCOVA for post-injection: genotype [F(1,68)=17.900, p<0.001] and treatment [F(3,68)=13.765, p<0.001]; Bonferroni post-hoc tests; for C57 vs. Htr2aEGFP-CreERT2 mice (black): **p<0.01, overall genotype effects; overall treatment effects (purple): ##p<0.01, Psil vs. LSD and DOI; ###p<0.001, Veh vs. LSD and DOI. (C) Stereotypical activities in these same mice. Two-way ANOVA for baseline: genotype [F(1,69)=44.086, p<0.001]; for C57 vs. Htr2aEGFP-CreERT2 mice (black): ***p<0.001, overall genotype effects. Two-way ANCOVA for post-injection: treatment [F(3,68)=8.338, p<0.001]; Bonferroni post-hoc tests; overall treatment effects (purple): #p<0.05, Veh vs. DOI; ##p<0.01, Veh vs. LSD or Psil vs. DOI; ###p<0.001, Psil vs. LSD. (D-F) Head twitch responses, grooming, and retrograde walking These responses were scored beginning immediately after vehicle or psychedelic administration and followed over the next 30 min; n=9–10 mice/genotype/treatment. (D) Head twitch responses in C57 and Htr2aEGFP-CreERT2 animals following administration (31–60 min) of the Veh, 0.3 mg/kg LSD, 1 mg/kg DOI, or 1 mg/kg Psil. Two-way ANOVA: genotype [F(1,69)=9.236, p=0.003], treatment [F(3,69)=51.113, p<0.001], and genotype by treatment interaction [F(3,69)=2.878, p=0.042]; Bonferroni post-hoc tests: for C57 vs. Htr2aEGFP-CreERT2 mice (black): ***p<0.001, DOI; for C57 mice (blue): +p<0.05, LSD vs. DOI; +++p<0.001, Veh vs. all psychedelics, or Psil vs. DOI; for Htr2aEGFP-CreERT2 mice (green): ^p<0.05, Psil vs. LSD; ^^p<0.01, Veh vs. Psil; ^^^p<0.001, Veh vs. LSD and DOI. (E) Groom time in the same mice. Two-way ANOVA: genotype [F(1,69)=11.465, p<0.001], treatment [F(3,69)=15.125, p<0.001], and genotype by treatment interaction [F(3,69)=6.855, p<0.001]; Bonferroni post-hoc tests: for C57 vs Htr2aEGFP-CreERT2 mice (black): ***p<0.001, LSD and DOI; for C57 mice (blue): +++p<0.001; Veh vs. LSD and DOI or or Psil vs. LSD and DOI; for Htr2aEGFP-CreERT2 mice (green): ^^p<0.01, Psil vs. Veh and LSD. (F) Retrograde walking in these same mice. Two-way ANOVA for treatment [F(3,69)=21.713, p<0.001]; Bonferroni post-hoc tests: overall treatment effects (purple): ###p<0.001, Veh vs. LSD and DOI, or Psil vs. LSD and DOI. (G) Prepulse inhibition C57 and Htr2aEGFP-CreERT2 mice were injected with the Veh, 0.3 mg/kg LSD, 1 mg/kg DOI, or 1 mg/kg Psil and tested 10 min later; n=10–15 mice/genotype/treatment. RMANOVA: PPI [F(2,210)=329.097, p<0.001], PPI by genotype interaction [F(2,210)=23.856, p<0.001], PPI by treatment interaction [F(6,210)=3.342, p=0.004], genotype [F(1,105)=45.808, p<0.001], and treatment [F(3,105)=19.562, p<0.001]; Bonferroni post-hoc tests: for C57 vs Htr2aEGFP-CreERT2 mice (black): ***p<0.001, overall genotype effects; for treatment effects (purple): #p<0.05, Veh vs. Psil; ##p<0.01, Veh vs. LSD; ###p<0.001, Veh vs. DOI. Some schematics were created with https://www.biorender.com/.
Fig 4.
Fig 4.. Receptor functionality validations of HTR2A in transgenic Htr2aEGFP-CreERT2 mice
(A) [3H] ketanserin saturation binding assay was conducted to examine the affinity (Kd, nM) and receptor levels (Bmax, pmole/mg) of HTR2A in the whole cortex of C57 and Htr2aEGFP-CreERT2 mice. Non-specific binding was determined with 10 μM clozapine. Data are means ± SEMs (n=4 samples/genotype) and analyzed by unpaired t-test. Kd values: C57(1.09 ± 0.324 nM) vs. Htr2aEGFP-CreERT2 (0.75 ± 0.13nM), [t(6)=1.005, p=0.354]; Bmax values: C57 (0.25 ±0.018 pmole/mg) vs. Htr2aEGFP-CreERT2 (0.46 ± 0.025 pmole/mg), [t(6)=6.745, p=0.0005] (***p<0.001, C57 vs. Htr2aEGFP-CreERT2). (B) Real-time qPCR was used to determine Htr2a mRNA levels from the whole cortex of C57 mice (Htr2a+/+), Htr2aEGFP-CreERT2/+, and Htr2aEGFP-CreERT2/EGFP-CreERT2 mice. Data are means ± SEMs (n=4 samples/genotype). One-way ANOVA [(F(2,9)=129.4, p<0.0001] followed by Tukey’s post-hoc test showed ***p<0.001, C57 vs. Htr2aEGFP-CreERT2/+; ****p<0.0001, C57 vs. Htr2aEGFP-CreERT2/EGFP-CreERT2. (C) LSD-mediated HTR2A downregulation: Mice (C57 and Htr2aEGFP-CreERT2) were injected with vehicle or LSD (0.5 mg/kg, i.p.) for 5 consecutive days and then were euthanized 24 hr later. The whole cortices were dissected followed by receptor purification using Wheat-Germ beads pull-down. Western blot against anti-HTR2A antibody detected the receptor expression levels. Data represent the means ± SEMs (n=5–7). Two-way ANOVA: treatment [F(1,21)=27.11, p<0.0001], genotype [F(1,21)=24.09, p<0.0001], and treatment by genotype interaction [F(1,21)=0.1832, p=0.673] (overall genotype effects (black): ****p<0.0001, C57 vs. Htr2aEGFP-CreERT2/EGFP-CreERT2 ; overall treatment effect (purple): ####p <0.0001, vehicle vs. LSD). The schematic was created with https://www.biorender.com/.
Fig 5.
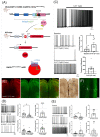
Fig 5.. Inducible tdTomato visualization and Electrophysiological effects on neuronal firing in HTR2A-expressing neurons
(A) Htr2aEGFP-CreERT2 mice crossed with the Cre-dependent reporter line (Ai9 mice here) were used to visualize HTR2A expressing cells with tdTomato expression. The bicistronic design of Htr2a-EGFP-IRES-CreERT2 produced a HTR2A-EGFP-CT fusion protein and CreERT2 recombinase. Tamoxifen activates CreERT2 recombinase, leading to Cre-loxP recombination and then turning on tdTomato expression. The schema was created with https://www.biorender.com/. (B) The expression pattern of tdTomato (red) and HTR2A-EGFP-CT fusion proteins (green) in the mPFC subregion were identified using immunohistochemistry staining for HTR2A expression patterns and AchE staining for the cytoarchitecture. MOs: secondary motor cortex; AAC: anterior cingulate area; PL: prelimbic cortex; IL: infralimbic cortex; and fr: anterior forceps (C) L5a pyramidal neurons were used for recording neuronal firing activity during focal 5-HT (10 μM) application. Addition of 5-HT resulted in an initial decrease in firing followed by increased firing shown 3 min after application. Data are presented as means ± SEMs (n=7) and were analyzed using paired t-test to compare basal activity and firing after 5-HT application, [t(6)=3.177, p=0.0191] (*p<0.05) and one sample t-test was used for normalization of basal activity for the 5-HT response, p=0.0469 (*p<0.05). (D) Representative recording of HTR2A+/L5a pyramidal neuronal firing after M100907 (200 nM) and 5-HT (10 μM). M100907 effects on firing were analyzed using paired t-test, [t(10)=2.667, p=0.0236] (*p<0.05 vs. baseline) and normalized M100907 effects on firing were analyzed with one-sample t-test, [t(11)=4.421, p=0.001] (***p=0.001). Data are represented as means ± SEMs (n=11). The effects of M100907 + 5-HT on firing were analyzed with paired t-test, [t(11)=2.036, p=0.067] and normalized effects were analyzed using one-sample t-test. Data are presented as means ± SEMs (n=12). (E) Representative recording of HTR2A+/L5a neuronal firing after administration of WAY100635 (100 nM) and 5-HT (10 μM). WAY100635 effects on firing were analyzed with paired t-test, [t(6)=3.115, p=0.021] (*p<0.05, vs baseline) and normalized effects on firing were analyzed with one-sample t-test, [t(6)=7.228, p=0.0004] (***p<0.001). Data are presented as means ± SEMs (n=7). WAY100635 + 5-HT effects on firing were analyzed with paired t-test, [t(8)=2.159, p=0.0629] and normalized WAY100635 + 5-HT effects on firing were analyzed with one sample ttest p=0.0039 (**p=0.01). Data are represented as means ± SEMs (n=9). (F) A representative biocytin-labeled L5 pyramidal neuron showed its location in the HTR2A-EGFP-CT positive cortical band layer in the dorsal prelimbic cortex. After recording, the patched neuron was injected with biocytin. The brain sections were stained with an anti-GFP antibody to locate the L5a cortical band. Images were taken under 20X objective with an Olympus confocal microscope.
Fig 6.
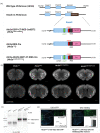
Fig 6.. A series of HTR2A transgenic mouse lines
(A) The schema depicts the transgenic designs of each mouse line. As described previously, the Htr2a-EGFP-CT-IRES-CreERT2 (Htr2aEGFP-CreERT2) was inserted with EGFP in the C-terminus of the Htr2a followed by adding the IRES-CreERT2 sequence after exon 3 as an inducible Htr2a mouse line. Htr2a-IRES-Cre mouse line (Htr2aCre) was engineered IRES-Cre sequence at the end of exon 3. A humanized mouse line, Htr2a-A242S-EGFP-CT-IRES-Cre (Htr2aA242S-EGFP-Cre), was created with one point mutation at the alanine 242 residue of the murine Htr2a to the serine residue of the human HTR2A and this was followed at the murine 452 residue by an EGFP insertion; the IRES-Cre was inserted after the exon 3 coding sequence. In the diagrams, the blue boxes represent exons of the murine Htr2a gene; the green box is Egfp; the red box is the stop codon. The gray box is the IRES (internal ribosome entry site) followed by a pink box for Cre or CreERT2 recombinase. The white box is the A242S point mutation. The schematic was created with https://www.biorender.com/. (B) HTR2A distribution in the brain among four mouse lines (Htr2a+/+, Htr2aCre/+, Htr2aEGFP-CreERT2/+, and Htr2aA242S-EGFP-Cre/+). For this study, mice were perfused, and the brain sections were immunostained with an anti-HTR2A antibody to visualize the HTR2A distribution. (C) The HTR2A receptor from four mouse lines (Htr2a+/+, Htr2aCre/Cre, Htr2aEGFP-CreERT2/EGFP-CreERT2, and Htr2aA242S-EGFP-Cre/A242S-EGFP-Cre). Here, mice were euthanized and then cortices were dissected followed by receptor purification using Wheat-Germ beads pull-down. Western blot against anti-HTR2A antibody to detect receptor expression level. In Htr2a+/+ and Htr2aCre/Cre mice, the HTR2A was detected between 50–75 KD; for EGFP insertion lines, the HTR2A-EGFP-CT fusion protein was detected around 100 KD. (D) Representative image of Htr2aCre/+ mice expressing DIO-eYFP in the mPFC was stained with anti-GFP for eYFP signal amplification at 20x (left) and 63x magnification (left inset). Example electrophysiological trace of a HRT2A+ neuron expressing DIO-eYFP during bath application of DCZ. Representative image of Htr2aCre/+ mice expressing DIO-HA-hM3Dq-IRES-mCitrine in the mPFC was stained with anti-GFP for mCitrine at 20x (right) and 63x magnification (right inset). Example electrophysiological trace of a HRT2A+ neuron expressing DIO-HA-hM3Dq-IRES-mCitrine during bath application of DCZ.

Similar articles

References

    1. Abbas A.I., Yadav P.N., Yao W.D., Arbuckle M.I., Grant S.G., Caron M.G., and Roth B.L. (2009). PSD-95 is essential for hallucinogen and atypical antipsychotic drug actions at serotonin receptors. J Neurosci 29, 7124–7136. - PMC - PubMed
    1. Armbruster B., Li X., Pausch M., Herlitze S., and Roth B. (2007). Evolving the lock to fit the key to create a family of G protein-coupled receptors potently activated by an inert ligand. Proc Natl Acad Sci USA 104, 5163–5168. - PMC - PubMed
    1. Backstrom J.R., and Sanders-Bush E. (1997). Generation of anti-peptide antibodies against serotonin 5HT2A and 5-HT2C receptors. J Neurosci Methods 77, 109–117. - PubMed
    1. Barnes N.M., Ahern G.P., Becamel C., Bockaert J., Camilleri M., Chaumont-Dubel S., Claeysen S., Cunningham K.A., Fone K.C., Gershon M., Di Giovanni G., Goodfellow N.M., Halberstadt A.L., Hartley R.M., Hassaine G., Herrick-Davis K., Hovius R., Lacivita E., Lambe E.K., Leopoldo M., Levy F.O., Lummis S.C.R., Marin P., Maroteaux L., McCreary A.C., Nelson D.L., Neumaier J.F., Newman-Tancredi A., Nury H., Roberts A., Roth B.L., Roumier A., Sanger G.J., Teitler M., Sharp T., Villalon C.M., Vogel H., Watts S.W., and Hoyer D. (2021). International Union of Basic and Clinical Pharmacology. CX. Classification of Receptors for 5-hydroxytryptamine; Pharmacology and Function. Pharmacol Rev 73, 310–520. - PMC - PubMed
    1. Berger M., Gray J., and Roth B. (2009). The Expanded Biology of Serotonin. Annl Revf Med 60, 355–366. - PMC - PubMed

Publication types