[Preprint]. 2024 May 17:2023.09.29.560114.
doi: 10.1101/2023.09.29.560114.

Cell type-specific gene expression dynamics during human brain maturation

Affiliations

Cell type-specific gene expression dynamics during human brain maturation

Christina Steyn et al. bioRxiv. .

Update in

Abstract

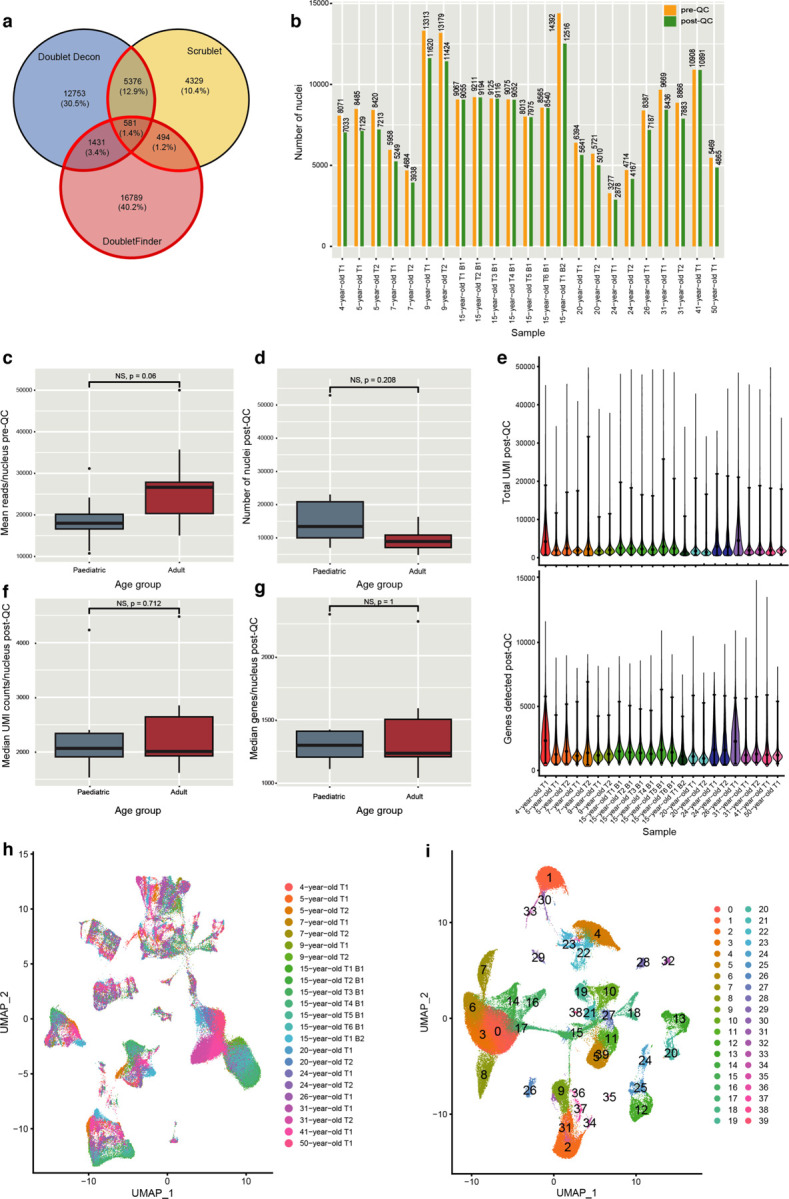
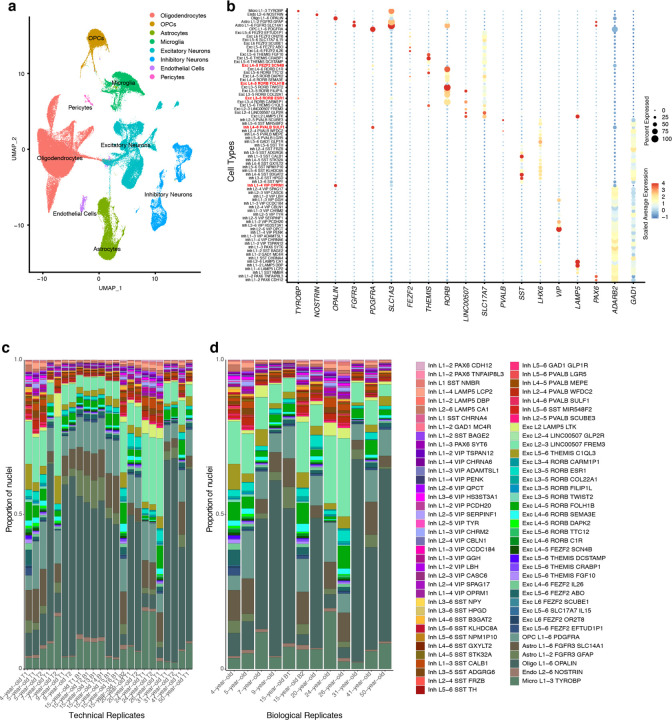
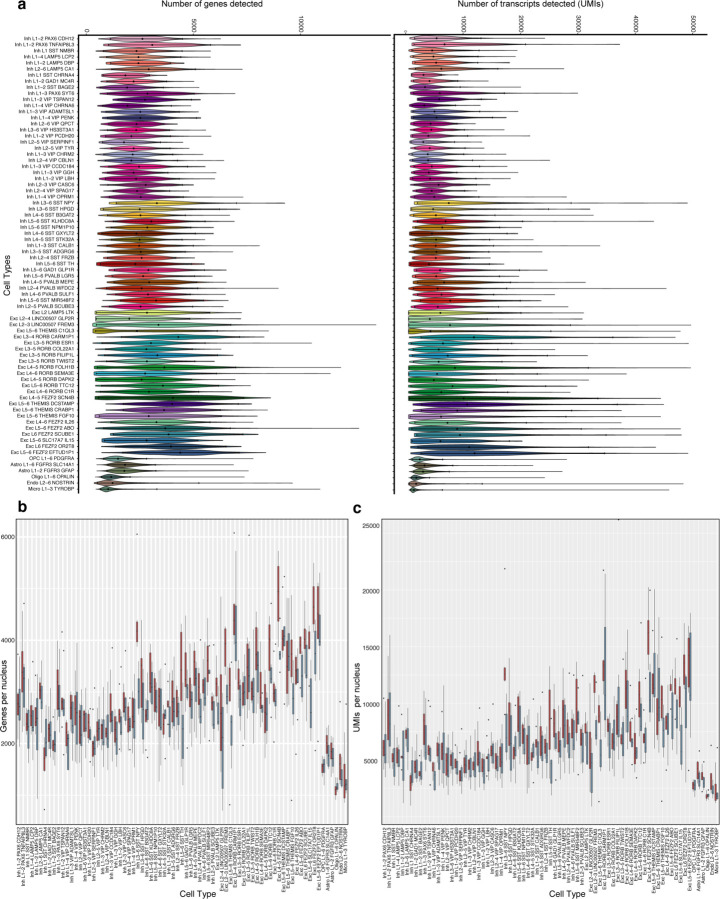
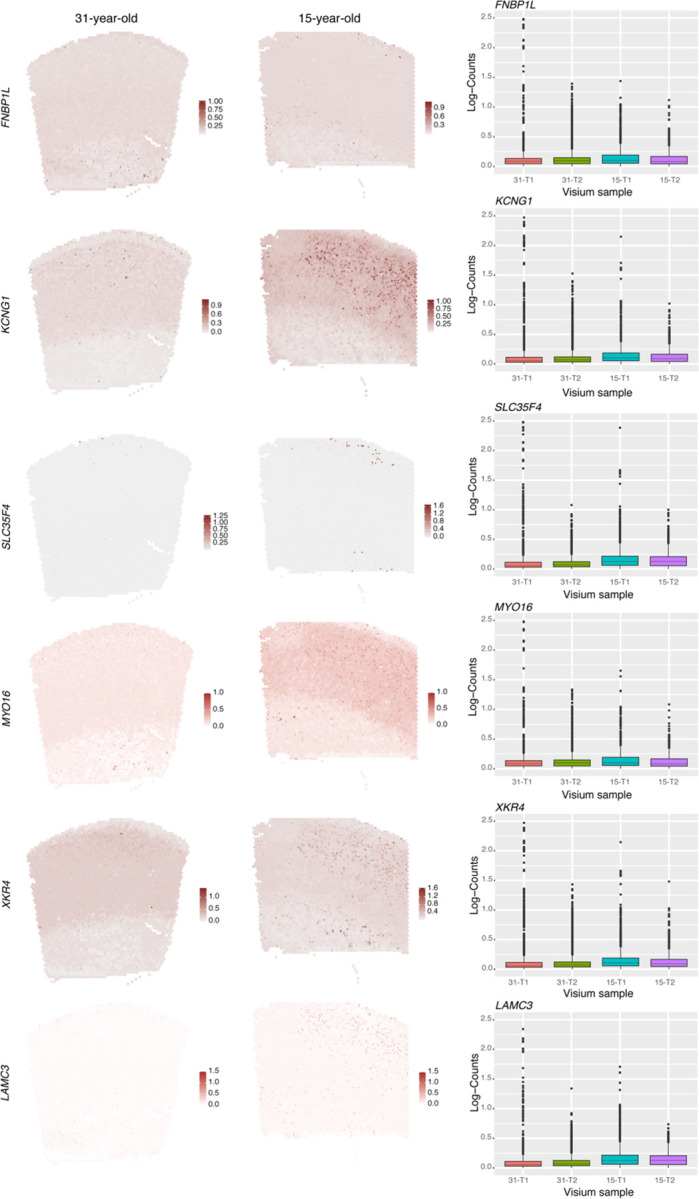
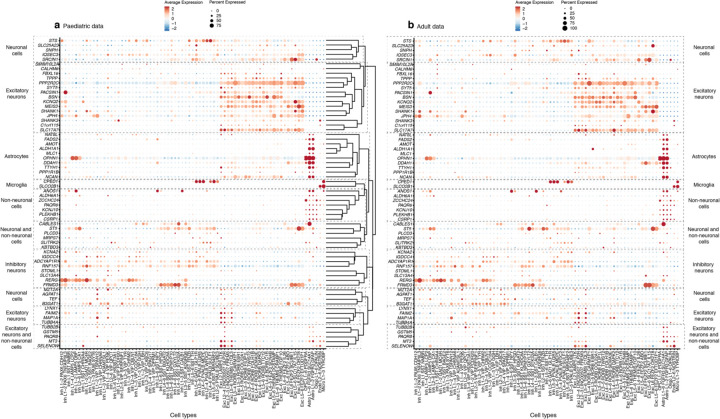
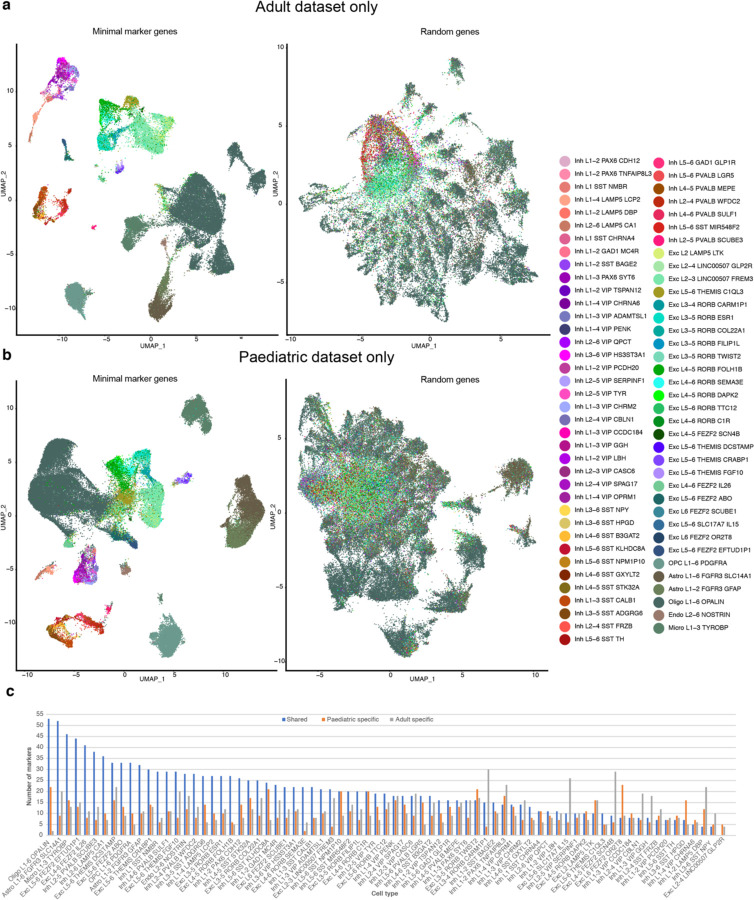
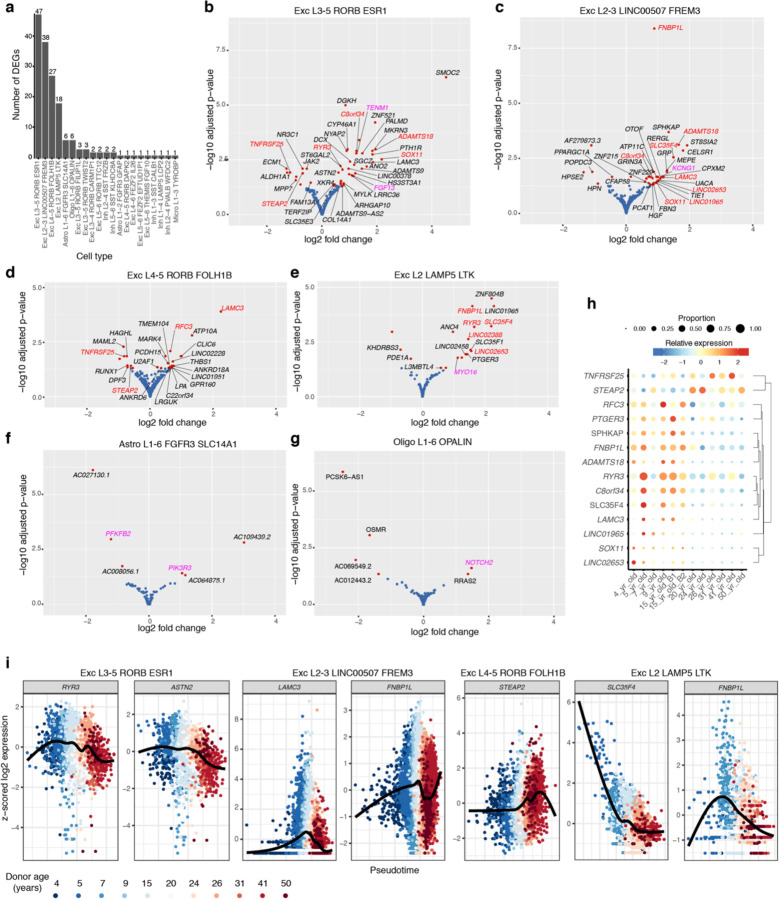
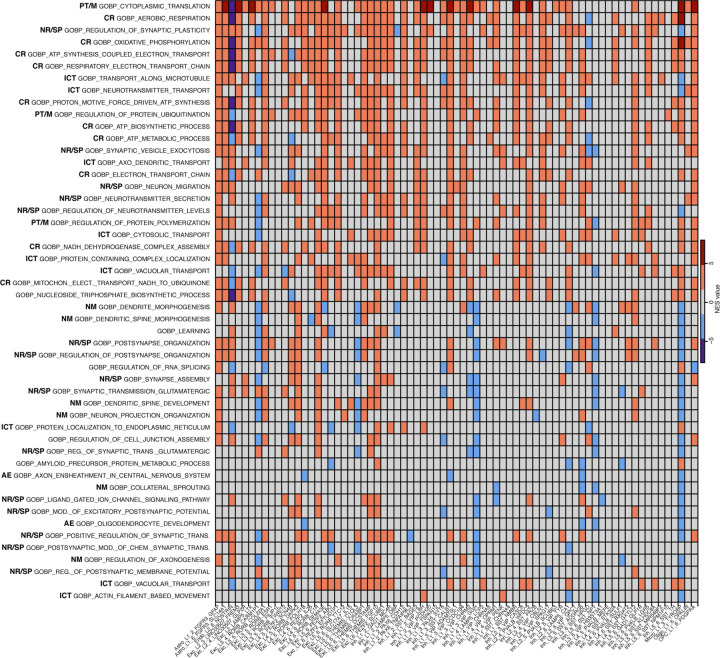
The human brain undergoes protracted post-natal maturation, guided by dynamic changes in gene expression. Most studies exploring these processes have used bulk tissue analyses, which mask cell type-specific gene expression dynamics. Here, using single nucleus (sn)RNA-seq on temporal lobe tissue, including samples of African ancestry, we build a joint paediatric and adult atlas of 75 cell subtypes, which we verify with spatial transcriptomics. We explore the differences between paediatric and adult cell types, revealing the genes and pathways that change during brain maturation. Our results highlight excitatory neuron subtypes, including the LTK and FREM subtypes, that show elevated expression of genes associated with cognition and synaptic plasticity in paediatric tissue. The new resources we present here improve our understanding of the brain during its development and contribute to global efforts to build an inclusive brain cell map.


Figures

Extended Data Fig. 1:
Extended Data Fig. 1:. Nuclei quality control (QC) and clustering.
a, Number of doublets identified across all 23 datasets by DoubletDecon, DoubletFinder, and Scrublet. Red outline indicates the subset of barcodes called as doublets that were removed. b, Total number of nuclei per dataset before (yellow) and after (green) QC. c, Mean number of reads per nucleus (y axis) by dataset before QC split by age group (x axis). p value determined by two-tailed Welch’s t-test. d, Number of nuclei (y axis) by sample after QC split by age group (x axis). p value determined by Brunnermunzel permutation test. e, Violin plots showing the number of unique molecular identifiers (UMIs) (top) and the number of genes detected (bottom) per nucleus per sample after QC. Black dots indicate the median value. Error bars show 95% confidence intervals. f,g, Median number of UMIs (2,263 paediatric and 2,011 adult) (f) and the median number of genes (1,372 paediatric and 1,226 adult) (g) detected per nucleus (y axes) by sample after QC split by age group (x axis). p values determined by two-tailed Brunnermunzel permutation test. h, UMAP plot for the 23 datasets prior to integration. i, UMAP plot showing the resulting clusters determined by the shared nearest neighbour algorithm. Data in all box plots represent mean ± sem for six paediatric and six adult samples. No significant differences were detected between paediatric and adult samples. B, biological replicate; NS, not significant; T, technical replicate. See also Extended Data Table 2.
Extended Data Fig. 2:
Extended Data Fig. 2:. Annotation and assessment of cell composition across datasets.
a, UMAP plot showing cluster annotation at the level of major brain cell types (level 1 annotation). b, Examination of known cell type-specific marker genes (x axis) after label transfer classify each nucleus according to the Allen Brain Map MTG atlas (level 2 annotation) (y axis) (left). Off-target gene expression is evident in several cell types (marked in red), which is likely due to multiplets or nuclei contaminated with ambient mRNA. c-d, Stacked barplots after filtering to retain nuclei with high confidence annotations showing the proportion of nuclei per cell type (y axis) for each technical replicate (c) or biological replicate (d) (x axis) out of the total number of nuclei for each group. Samples with technical replicates showed high degrees of similarity in cell composition between their replicates (c). Technical replicates from each donor were merged to allow comparisons between the 12 samples (d).
Extended Data Fig. 3:
Extended Data Fig. 3:. Assessment of the sequencing metrics for the annotated cell types.
a, Violin plots showing the distribution of the number of genes (left) and transcripts (right) detected per nucleus per cell type across all datasets. Black dots indicate the median value. Error bars show 95% confidence intervals. b,c, Boxplots showing the number of genes (b) and the number of UMIs (c) (y axis) detected per cell type per sample (x axis) split by age group (red: adult, grey: paediatric). Data in all box plots represent mean ± sem for six paediatric and six adult samples for each cell type. No significant differences were detected (i.e. padj > 0.05). See Extended Data Table 3 for details of statistical tests performed.
Extended Data Fig. 4:
Extended Data Fig. 4:. Visium Spatial Gene Expression samples.
a,b, 31-year-old (a) and 15-year-old (b) temporal cortex tissue blocks embedded in OCT. Black dashed boxes outline the regions collected onto the Visium Spatial Gene Expression slide. c-f, H&E stained technical replicate tissue sections used to generate Visium Spatial Gene Expression libraries for the 31-year-old (c,e) and 15-year-old (d,f) tissue samples. T, technical replicate.
Extended Data Fig. 5:
Extended Data Fig. 5:. Spatial mapping of cell types in the human temporal cortex.
a, Estimated cell abundance of 75 cell types across all Visium samples. Shown is a heatmap with the colour indicating the relative cell abundance of cell types (rows) across the different samples (columns). b, Estimated cell type abundances (colour intensity) in the technical replicate 31-year-old and 15-year-old temporal cortex tissue sections for a selection of cell types including non-neuronal cell types, excitatory neurons (top row) and inhibitory neurons (bottom row). d, Spatial plots show of the NMF weights for selected NMF factor/tissue compartment across the 31-year-old and 15-year-old temporal cortex tissue sections. Panels are displayed in the same order as the dotplot in Fig. 2c, with the dominant cell types for each factor indicated in brackets. T, technical replicate.
Extended Data Fig. 6:
Extended Data Fig. 6:. In situ HCR analysis of selected cortical layer marker genes.
Expression of a, layer 1 markers AQP4, FABP7 and RELN and b, layer 4–6 markers RORB, CLSTN2 and TSHZ2 in frozen temporal cortex tissue sections from the same 31-year-old and 15-year-old donor tissue used for Visium. High magnification views of layer 1 in a indicate AQP4/RELN-positive cells (yellow arrowheads) and FABP7 positive cells (green arrowhead). In high magnification views of layer 4 in b in the 31-year-old tissue section, RORB/CLSTN2-positive (white arrowhead) and RORB/TSHZ2-positive cells (green arrowhead) are indicated. In high magnification views of layer 4 in b in the 15-year-old tissue section RORB/CLSTN2/TSHZ2-positive cells (white arrowheads) are indicated. Dashed white lines indicate layer boundaries. Solid white line indicates tissue edge. Scale bars are 100 µm in low magnification views (tile scan at 40x) and 20 µm in high magnification views (63x).
Extended Data Fig. 7:
Extended Data Fig. 7:. Expression of the reference MTG atlas minimal markers.
Heatmap showing the scaled average normalised expression counts of the NS-Forest minimal marker genes identified for the reference MTG cell atlas dataset (y-axis) in each of the 75 query cortical cell types identified in the combined adult and paediatric snRNA-seq datasets (x-axis). The minimal marker genes are annotated (colour codes on the y-axes) according to the cell type they define.
Extended Data Fig. 8:
Extended Data Fig. 8:. MERFISH spatial transcriptomics analysis of selected NS-forest markers.
a, b Low magnification views of the 31-year-old (a) and 15-year-old (b) MERFISH datasets showing the expression of known layer maker genes in the expected layers as validation of the MERFISH experiment. c-p, High magnification views of 31-year-old (c,e,g,I,k,m,o) and 15-year-old (d,f,h,j,l,n,p) MERFISH datasets showing the overlap of new NS-Forest minimal markers (green) with published NS-Forest minimal markers (magenta) in indicated cells (arrowheads). The cell type that the NS-Forest markers are associated with is indicated in the top left corner. Scale bars: 100 µm.
Extended Data Fig. 9:
Extended Data Fig. 9:. Evaluation of NS-Forest minimal marker gene expression across cell types in comparison to MTG cell taxonomy markers.
a-d, Boxplots showing the normalised expression counts for LINC01331 (a), PALMD (b), POSTN (c) and OLFML2B (d) in paediatric (top) and adult (bottom) datasets. The cell types expressing the markers at high levels are indicated in bold.
Extended Data Fig. 10:
Extended Data Fig. 10:. BayesSpace analysis of differentially expressed genes.
High resolution Visium spatial gene expression profiles for selected DEGs using BayesSpace analysis to compare sub-spot level expression intensities between 31-year-old and 15-year-old temporal cortex tissue sections. Barplots show the average gene gene expression (log-counts) across technical replicate (T) samples for the indicated genes for spots with gene expression levels > 0. In all cases, average gene expression is higher in the 15-year-old samples than in the 31-year-old samples.
Extended Data Fig. 11:
Extended Data Fig. 11:. Cell type-specific expression of putative TBM biomarkers.
a. Hierarchical clustering of TBM biomarker genes across the 75 cell types identified in the peaditaric snRNA-seq dataset reveals clusters of genes that are expressed by specific groups of cell types. b. Analysis of the same genes across the adult snRNA-seq dataset, using the gene order in (a) reveals very similar patterns of cell type-specific expression across the age-groups. Dashed boxes highlight gene clusters, with associated cell types indicated on the left and right of the right diagram
Fig. 1:
Fig. 1:. Annotation of nuclei by label transfer identifies 75 cell types across the 23 datasets.
a, Data integration shows alignment of nuclei across the technical (T) and biological (B) replicates from donors ranging in age from 4 to 50 years. b, UMAP plot annotated to show the 75 cell types from the Allen Brain Map MTG atlas after filtering to retain nuclei with high confidence annotations. Each cell type is annotated with 1) a major cell class (e.g. Exc for excitatory neuron), 2) the cortical layer the cell is associated with (e.g. L2 for layer 2), 3) a subclass marker gene and 4) a cluster-specific marker gene. c, Stacked barplot showing the proportion of nuclei per cell type for each age category out of the total number of nuclei for each group. The cell types are coloured as in b. See Extended Data Table 3 for details of statistical tests performed. d, Validation of the high-resolution cell type annotations shows a high degree of correspondence in the expression of known cell type-specific marker genes (x axis) with their expected cell type (y axis) (left). The number of nuclei per cell type is shown on the right. e, Correlation plot showing the cosine similarity scores assessing similarity between the annotated cell types in our dataset (y axis as in d) and the MTG reference dataset (x axis) based on the log normalized expression counts of the top 2000 shared highly variable features between query and reference datasets.
Fig. 2:
Fig. 2:. Visium spatial transcriptomics in the adult and paediatric temporal cortex validates snRNA-seq annotation.
a, Estimated cell type abundances (colour intensity) in the 31-year-old and 15-year-old temporal cortex tissue sections for a selection of cell types including non-neuronal cell types, excitatory neurons (top row) and inhibitory neurons (bottom row). b, Visium gene expression profiles (colour intensity) for a selection of known cortical layer marker genes in the 31-year-old and 15-year-old temporal cortex tissue sections including AQP4 (layer 1), LAMP5 (layer 2), RORB (layer 4) and CLSTN2 (layer 5–6). c,d, Identification of co-locating cell types using NMF. The dot plot (c) shows the NMF weights of the cell types (rows) across each of the NMF factors (columns), which correspond to tissue compartments. Block boxes indicate cell types that co-locate within the indicated compartments. Spatial plots show (d) show the NMF weights for selected NMF factor/tissue compartment across the 31-year-old and 15-year-old temporal cortex tissue sections. Panels are displayed in the same order as the dotplot in (c), with the dominant cell types for each factor indicated in brackets. Dashed white lines and numbers indicate estimated cortical layer boundaries as indicated in the first two panels of b and d. WM: white matter. See also Extended Data Figs 4–6.
Fig. 3:
Fig. 3:. NS-Forest identifies minimal marker genes distinguishing the cell types in the paediatric and adult temporal cortex snRNA-seq datasets.
a,b, Heatmap showing the scaled average normalised expression counts of the NS-Forest minimal marker genes (y-axis) identified for 75 cortical cell types (x-axis) across the six adult (a) and six paediatric (b) datasets. As input into NS-Forest, the nuclei of each sample were randomly down-sampled to the size of the sample with the fewest nuclei. Heatmaps show gene expression values for the down-sampled datasets. The minimal marker genes are annotated (colour codes on the y-axes) according to whether they are unique to a given cell type, whether they are coding/non-coding genes, whether they are unique to the indicated age group, whether they overlap with existing MTG minimal marker gene sets for the same cell type, and according to the cell type they define.
Fig. 4:
Fig. 4:. Validation of NS-Forest minimal markers and assessment of the top NS-forest markers.
a,b, Annotated UMAP plots following data integration using either the minimal marker genes (left) or the equivalent number of a random set of genes (right) as anchors for the adult (a) and paediatric (b) datasets. The colour scheme for the cell types is in accordance with the MTG cell taxonomy. c, Overlap of the paediatric and adult NS-Forest markers with a high binary expression score (> 0.7) per cell type. The bar plot shows the number of shared markers between paediatric and adult datasets (blue), the number of markers unique to the paediatric datasets (orange), and the number of markers unique to the adult datasets (grey) for each cell type.
Fig. 5:
Fig. 5:. Differential expression analysis reveals genes guiding temporal cortex maturation.
a, 21 cell types with DEGS. b-g, Volcano plots showing log2FoldChange (x axis) and -log10padj values (y axis) for all DESeq2-tested genes in Exc_L3-5_RORB_ESR1, Exc L2-3_LINC00507_FREM3, Exc_L4-5_RORB_FOLH1B, Exc_L2_LAMP5_LTK, Astro_L1-6_FGFR3_SLC14A1 and Oligo L1-6 OPALIN. Red dots indicate genes that were significantly upregulated or downregulated in paediatric samples (padj<0.05 & abs(log2FoldChange)>10%) and selected genes are labelled. Red labels indicate DEGs shared between neuronal cell types. Magenta labels indicate DEGS not shared between cell types that are discussed in the text. Blue dots indicate non-significant genes (padj>0.05 or abs(log2FoldChange)<10%). h, Dot plot showing the scaled average normalised expression across samples for DEGS shared between Exc_L3-5_RORB_ESR1, Exc L2-3_LINC00507_FREM3, Exc_L4-5_RORB_FOLH1B, Exc_L2_LAMP5_LTK, Exc_L3-4_RORB_CARM1P1 and Exc_L3-5_RORB_FILIP1L. i, psupertime gene expression trajectories for selected DEGs in the indicated cell types. The x-axis is the calculated psupertime value for each cell, coloured by sample of origin. The black lines are smoothened curves fit by geom_smooth in the R package ggplot2.
Fig. 6:
Fig. 6:. Pathways that are enriched or depleted across multiple cell types in paediatric samples.
GSEA heatmap showing the top 25 most frequently enriched (top 25 rows) or depleted (bottom 25 rows) terms appearing across all cell types. Abbreviations in bold indicate the following categories as referred to in the text: AE, axon ensheathment; CR, cellular respiration; ICT, intracellular transport; NM, neuronal morphogenesis; NR/SP, neurotransmitter release/synaptic plasticity; PT/M, protein translation/modification. Only significantly (p < 0.01 and q < 0.1) terms are shown. NES value represents the normalized enrichment scores. Grey indicates that the term was not significantly enriched or depleted in the indicted cell type. See also Extended Data Table 12.

References

    1. Hodge R. D. et al. Conserved cell types with divergent features in human versus mouse cortex. Nature 573, 61–68 (2019). - PMC - PubMed
    1. Bakken T. E. et al. Comparative cellular analysis of motor cortex in human, marmoset and mouse. Nature 598, 111–119, doi:10.1038/s41586-021-03465-8 (2021). - DOI - PMC - PubMed
    1. Regev A. et al. The Human Cell Atlas. Elife 6, doi:10.7554/eLife.27041 (2017). - DOI - PMC - PubMed
    1. Network B. I. C. C. A multimodal cell census and atlas of the mammalian primary motor cortex. Nature 598, 86–102, doi:10.1038/s41586-021-03950-0 (2021). - DOI - PMC - PubMed
    1. Darmanis S. et al. A survey of human brain transcriptome diversity at the single cell level. Proc Natl Acad Sci U S A 112, 7285–7290, doi:10.1073/pnas.1507125112 (2015). - DOI - PMC - PubMed

Publication types