[Preprint]. 2023 Oct 9:2023.09.26.558914.
doi: 10.1101/2023.09.26.558914.

Integrated single-cell multiome analysis reveals muscle fiber-type gene regulatory circuitry modulated by endurance exercise

Affiliations

Integrated single-cell multiome analysis reveals muscle fiber-type gene regulatory circuitry modulated by endurance exercise

Aliza B Rubenstein et al. bioRxiv. .

Update in

Abstract

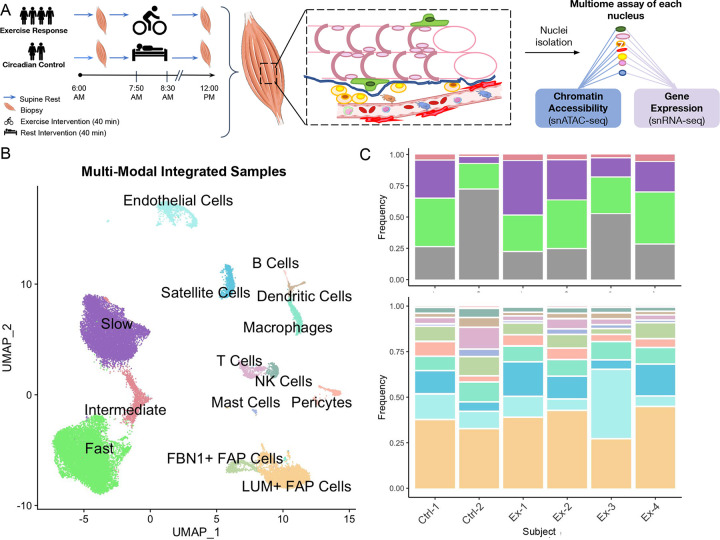
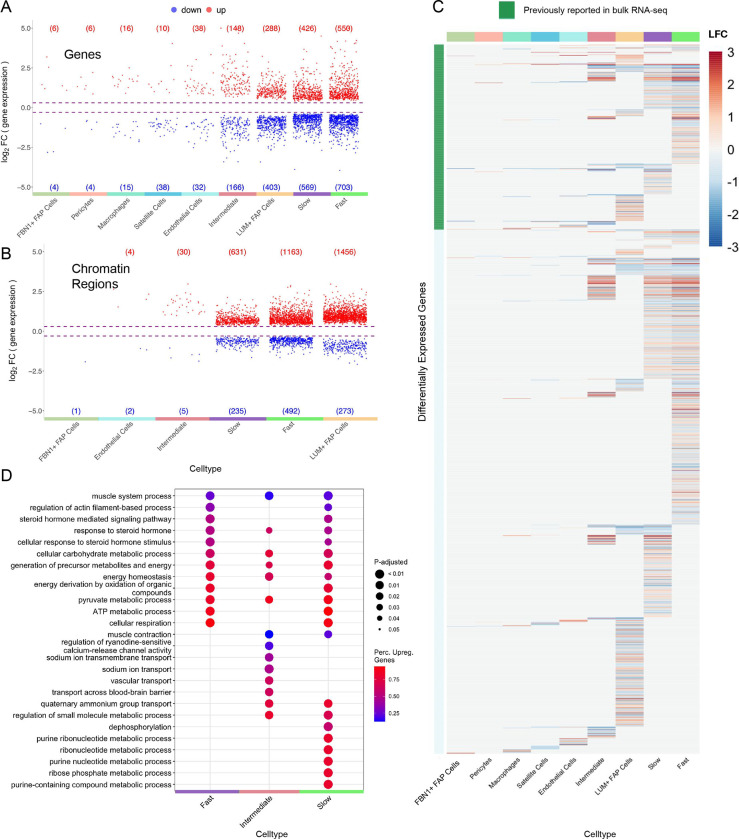
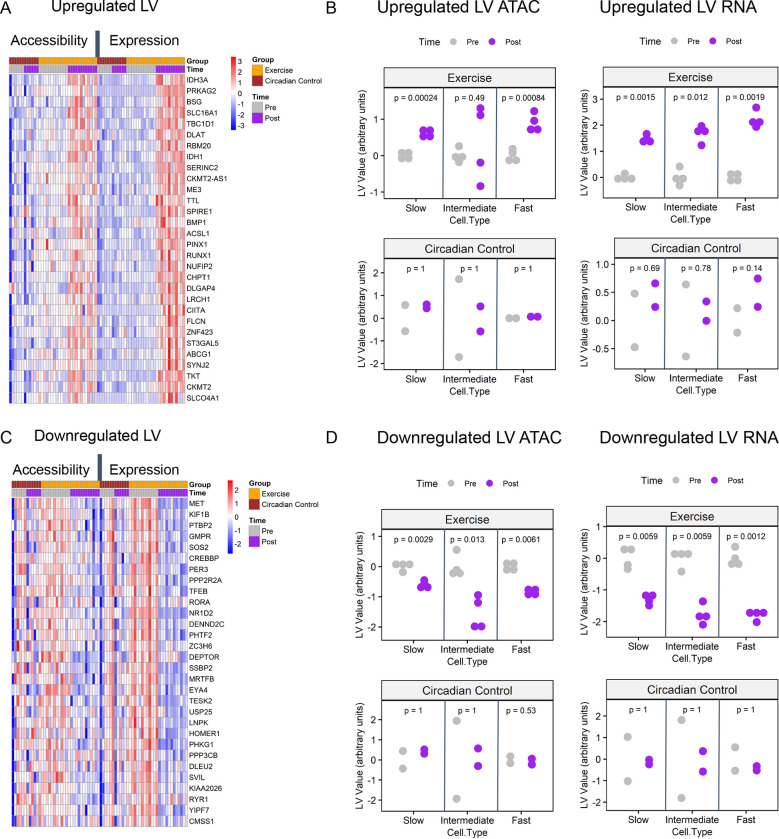
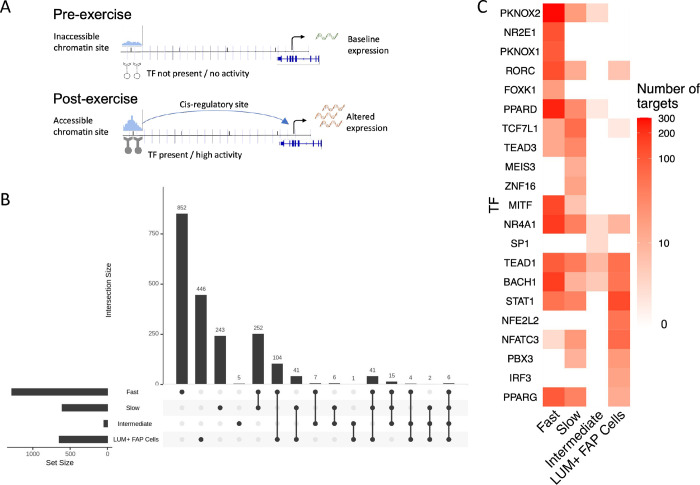
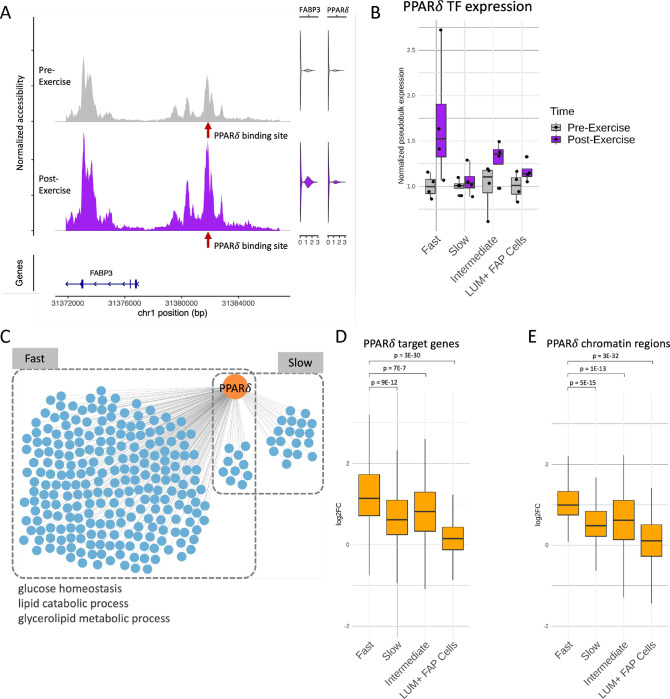
Endurance exercise is an important health modifier. We studied cell-type specific adaptations of human skeletal muscle to acute endurance exercise using single-nucleus (sn) multiome sequencing in human vastus lateralis samples collected before and 3.5 hours after 40 min exercise at 70% VO2max in four subjects, as well as in matched time of day samples from two supine resting circadian controls. High quality same-cell RNA-seq and ATAC-seq data were obtained from 37,154 nuclei comprising 14 cell types. Among muscle fiber types, both shared and fiber-type specific regulatory programs were identified. Single-cell circuit analysis identified distinct adaptations in fast, slow and intermediate fibers as well as LUM-expressing FAP cells, involving a total of 328 transcription factors (TFs) acting at altered accessibility sites regulating 2,025 genes. These data and circuit mapping provide single-cell insight into the processes underlying tissue and metabolic remodeling responses to exercise.

Keywords: PPARδ; acute endurance exercise; circadian control; epigenomics; gene regulatory circuits; human vastus lateralis; single-nucleus multiome; skeletal muscle; snRNA-seq/snATAC-seq; transcriptomics.


Conflict of interest statement

Declaration of Interests: SCS is interim Chief Scientific Officer, consultant, and equity owner of GNOMX Corp. The authors declare no other competing interests.

Figures

Figure 1:
Figure 1:
Generation of cell-type resolution map of exercise response. (A) Human vastus lateralis biopsies were collected before and 3.5 hours post 40 min exercise at 70% VO2max in four subjects as well as biopsies at the same time-points from two supine resting circadian controls. Nuclei were isolated and underwent same-cell single-nucleus multiome assay to assess gene expression and chromatin accessibility simultaneously. (B) High quality single-nuclei assay data was integrated and clustered with fourteen cell-types identified. See Figure S1 for cell-type markers used for annotation. (C) The proportion of each cell-type from the single-cell analysis within each baseline subject is shown. Plot is split by all cell-types (top panel) and mononuclear cells only (bottom panel) to enable easier comparison of low-frequency cell-types. Total frequency of mononuclear cells is shown in gray in top panel. Column labels denote group identity (Ctrl: circadian control; Ex: exercise response) and subject ID. Subjects Ctrl-1, Ex-1, and Ex-2 are female; subjects Ctrl-2, Ex-3, and Ex-4 are male. See Figure S2 for a detailed examination of cell-type proportions.
Figure 2:
Figure 2:
Cell-type resolution map of exercise response enables differential analysis which reveals high differential expression and accessibility for fiber types and LUM+ FAP cells. (A-B) Volcano plots show the distributions of upregulated and downregulated genes (A) and chromatin regions (B) for each cell-type. Each point denotes a differentially expressed gene (A) or differentially accessible region (B) for a given cell-type. Cell-types with no significant differential features are not shown. Circadian-regulated features are excluded and shown in Figure S3C,D. (C) Heatmap shows overlap in differentially expressed genes within cell-types. Annotation bar denotes whether a gene has previously been validated as differentially expressed in bulk RNA-seq meta-analysis study (green). Color represents log2 fold change of each gene for each cell-type. (D) Enrichment analysis of biological processes in fiber types shows functionally different transcriptome profiles for each cell-type. Color represents the percentage of upregulated genes in a given pathway and larger dot radius denotes more significant biological function. See Figure S4 for enrichment analysis for all cell-types. See methods for detailed description of differential analysis including statistical tests used.
Figure 3:
Figure 3:
Latent variable analysis identifies conserved training responses across both RNA-seq and ATAC-seq data in slow, fast, and intermediate fiber types. Two latent variables (LVs) representing patterns of upregulation, LV9, (A,B) and downregulation, LV12 (C,D) conserved across both gene expression and promoter chromatin accessibility are shown. For complete PLIER latent variable analysis, see Figure S5. (A,C) Heatmaps represent chromatin accessibility and gene expression z-scored pseudobulk values for the top thirty genes that are associated with each LV. Each column represents one fiber-type sample; columns are ordered by ome type, exercise group, and time-point. (B,D) Scatterplots represent the summary values for exercise-regulated LVs. Plots are faceted by ome type (RNA vs. ATAC), exercise group (exercise vs. circadian control), and fiber type. Change between pre and post LV summary values is assessed via Holm-Bonferroni adjusted paired t-test with ns: p > 0.05, *: p <= 0.05, **: p <= 0.01, ***: p <= 0.001, ****: p <= 0.0001.
Figure 4:
Figure 4:
Regulatory circuitry of exercise reveals molecular mechanisms underlying exercise adaptation (A) Schematic figure showing the components of regulatory circuits underlying exercise-related gene expression changes. (B) UpSet plot displays the sizes of overlapping and unique sets of exercise-related circuit-genes identified in each cell-type. (C) Heatmap reveals the numbers of identified targets of selected TFs (rows) in each cell-type (columns).
Figure 5:
Figure 5:
Regulatory circuitry of a fast fiber specific exercise-related TF: PPARδ. (A) Example of a regulatory circuit (PPARδ-FABP3) where TF PPARδ interacts with a cis-regulatory region upstream of the target gene FABP3 and regulates its expression after exercise. Left panel shows the normalized chromatin accessibility of the genomic regions around the transcription start site (TSS) of FABP3 in fast fibers pre-exercise (gray) and post-exercise (purple). Red arrow indicates the location of the PPARδ binding site. Right panels are violin plots showing the expression of FABP3 and PPARδ pre-exercise (gray) and post-exercise (purple). (B) Normalized pseudobulk RNA expression of PPARδ in each group, time-point and cell-type is depicted as a boxplot with one point per sample. For each group and cell-type, both the pre-exercise and post-exercise RNA exercise of each sample were normalized by the mean of the pre-exercise samples. (C) Network plot reveals the cell-type specific target genes (blue) of PPARδ (orange) identified by the integrated regulatory circuit analysis. Selected GO terms enriched in the target genes are annotated below. (D-E) Log2 fold change (log2FC) between post-exercise and pre-exercise of the target genes (D) and chromatin regions (E) in the fast fiber specific PPARδ circuitry in each cell-type. P-values are calculated using a one-sided Wilcoxon test comparing the log2FC between fast fiber and other cell-types.

References

    1. Chow L.S., Gerszten R.E., Taylor J.M., Pedersen B.K., van Praag H., Trappe S., Febbraio M.A., Galis Z.S., Gao Y., Haus J.M., et al. (2022). Exerkines in health, resilience and disease. Nat. Rev. Endocrinol. 18, 273–289. 10.1038/s41574-022-00641-2. - DOI - PMC - PubMed
    1. Hawley J.A., Hargreaves M., Joyner M.J., and Zierath J.R. (2014). Integrative biology of exercise. Cell 159, 738–749. 10.1016/j.cell.2014.10.029. - DOI - PubMed
    1. Egan B., and Sharples A.P. (2022). Molecular responses to acute exercise and their relevance for adaptations in skeletal muscle to exercise training. Physiol. Rev. 10.1152/physrev.00054.2021. - DOI - PubMed
    1. Smith J.A.B., Murach K.A., Dyar K.A., and Zierath J.R. (2023). Exercise metabolism and adaptation in skeletal muscle. Nat. Rev. Mol. Cell Biol. 24, 607–632. 10.1038/s41580-023-00606-x. - DOI - PMC - PubMed
    1. Egan B., and Zierath J.R. (2013). Exercise metabolism and the molecular regulation of skeletal muscle adaptation. Cell Metab. 17, 162–184. 10.1016/j.cmet.2012.12.012. - DOI - PubMed

Publication types