[Preprint]. 2023 Sep 29:2023.09.28.23296274.
doi: 10.1101/2023.09.28.23296274.

Germline mutations and developmental mosaicism underlying EGFR-mutant lung cancer

Affiliations

Germline mutations and developmental mosaicism underlying EGFR-mutant lung cancer

Risa Burr et al. medRxiv. .

Update in

  • Developmental mosaicism underlying EGFR-mutant lung cancer presenting with multiple primary tumors.
    Burr R, Leshchiner I, Costantino CL, Blohmer M, Sundaresan T, Cha J, Seeger K, Guay S, Danysh BP, Gore I, Jacobs RA, Slowik K, Utro F, Rhrissorrakrai K, Levovitz C, Barth JL, Dubash T, Chirn B, Parida L, Sequist LV, Lennerz JK, Mino-Kenudson M, Maheswaran S, Naxerova K, Getz G, Haber DA. Burr R, et al. Nat Cancer. 2024 Nov;5(11):1681-1696. doi: 10.1038/s43018-024-00840-y. Epub 2024 Oct 15. Nat Cancer. 2024. PMID: 39406916 Free PMC article.

Abstract

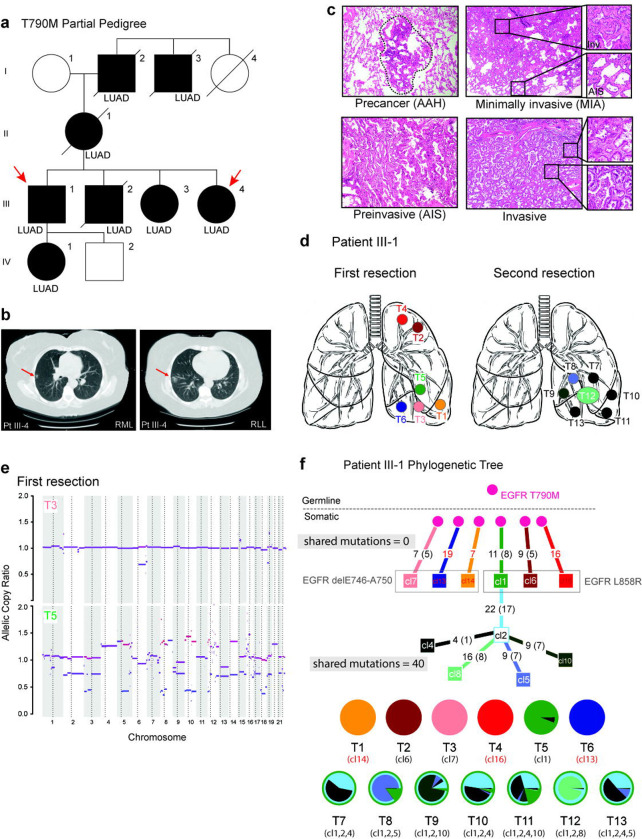
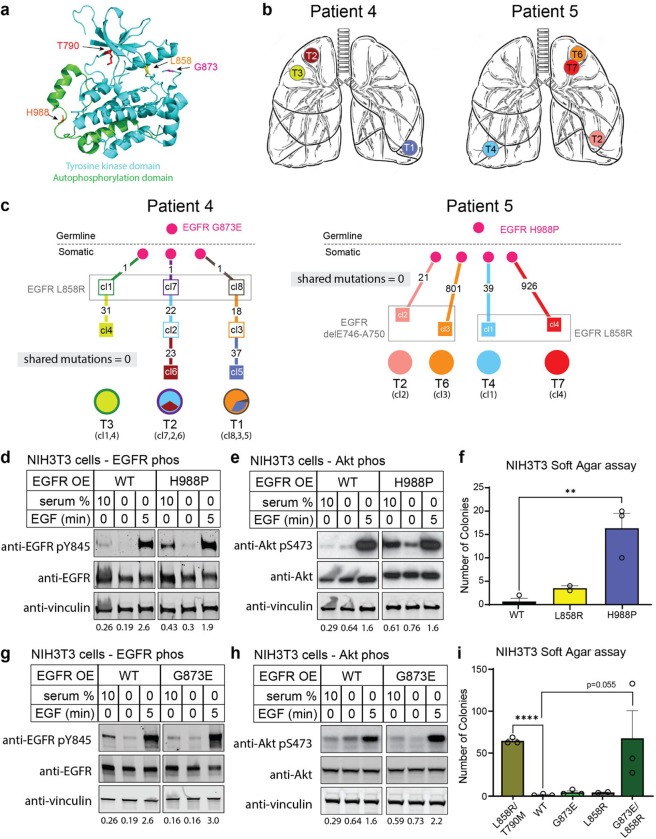
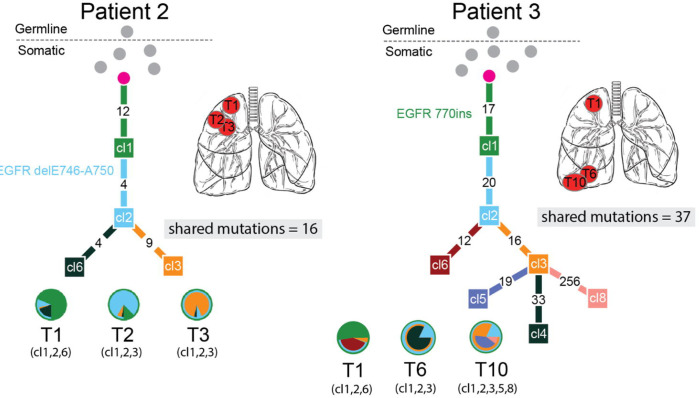
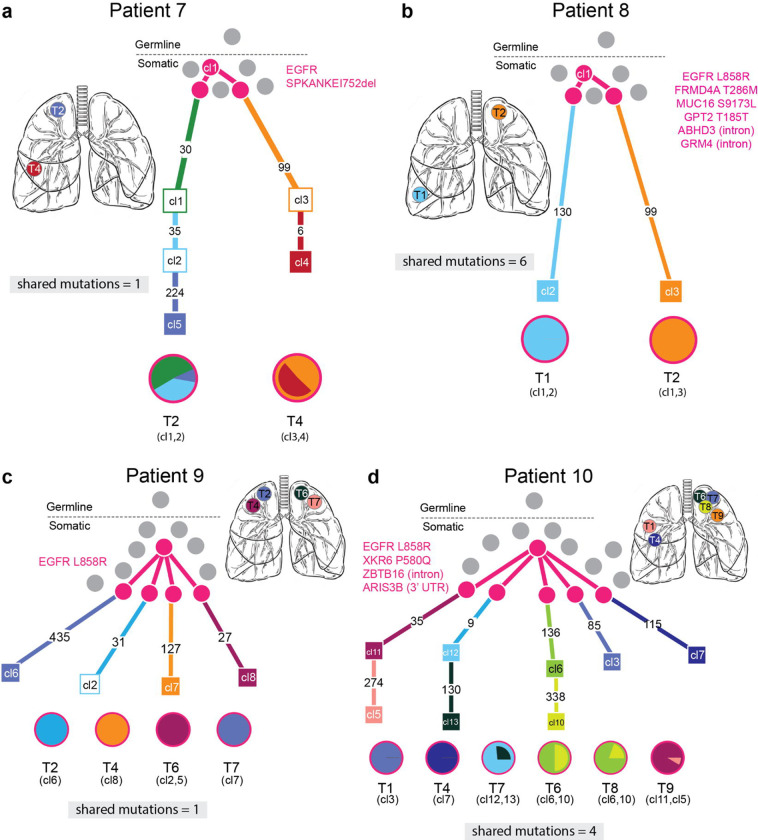
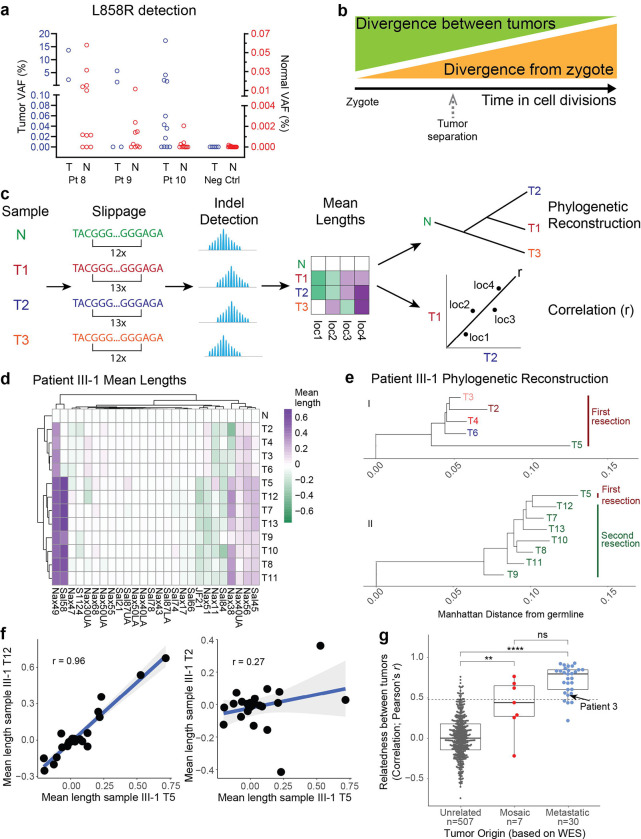
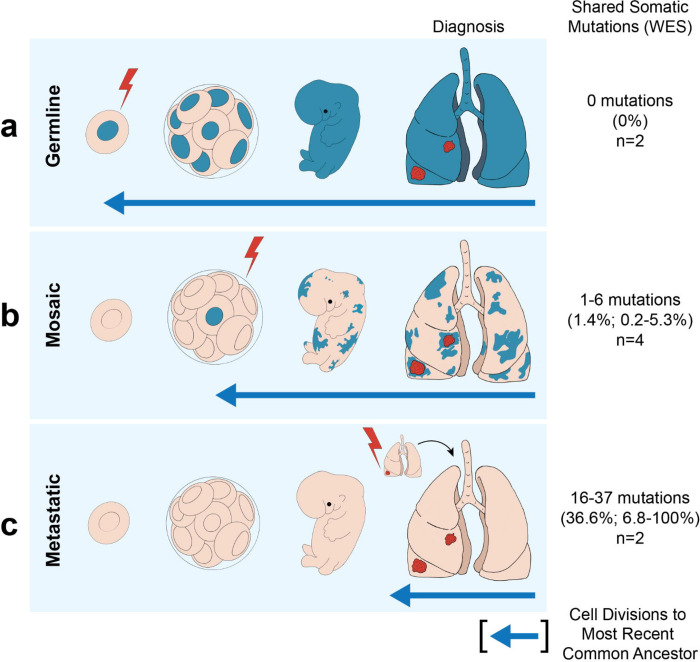
While the development of multiple primary tumors in smokers with lung cancer can be attributed to carcinogen-induced field cancerization, the occurrence of multiple primary tumors in individuals with EGFR-mutant lung cancer who lack known environmental exposures remains unexplained. We identified ten patients with early-stage, resectable non-small cell lung cancer who presented with multiple anatomically distinct EGFR-mutant tumors. We analyzed the phylogenetic relationships among multiple tumors from each patient using whole exome sequencing (WES) and hypermutable poly-guanine (poly-G) repeat genotyping, as orthogonal methods for lineage tracing. In two patients, we identified germline EGFR variants, which confer moderately enhanced signaling when modeled in vitro. In four other patients, developmental mosaicism is supported by the poly-G lineage tracing and WES, indicating a common non-germline cell-of-origin. Thus, developmental mosaicism and germline variants define two distinct mechanisms of genetic predisposition to multiple EGFR-mutant primary tumors, with implications for understanding their etiology and clinical management.


Figures

Figure 1.
Figure 1.. Genetic analysis of familial lung cancer due to inherited T790M mutation in the EGFR gene.
a, Partial pedigree of a family with multiple cases of lung adenocarcinoma, in which the index case (III-1) was diagnosed with six primary carcinomas (first resection), followed by resection of seven tumors ten years later. These tumors were available for analysis as were three tumors from his sibling (III-4). Individuals shown in black have a confirmed or obligate germline T790M-EGFR mutation and those who have developed lung adenocarcinoma are denoted (LUAD). The pedigree was minimally altered to preserve confidentiality (males, square; females, circles). b, Computed tomography scans of two tumors from patient III-4, one in the Right Middle Lobe (RML), and the other in the Right Lower Lobe (RLL). c, Histology of tumors from T790M-EGFR family patients showing the range of invasiveness encountered in our cohort, from precancerous Atypical adenomatous hyperplasia (AAH; patient III-4 lesion T2), to Adenocarcinoma in situ (AIS; patient III-4 lesion T2), to minimally invasive adenocarcinoma (MIA; patient III-1 lesion T2), to invasive adenocarcinoma (patient III-1; lesion T12). Panels are at 40x magnification, with insets at 200x. d, Schematic of the tumor locations in patient III-1, at the first resection (left) and the second resection 10 years later (right). e, Copy number data for two tumors from the first resection of patient III-1. Tumor T3 is a MIA and shows an allelic copy ratio of 1.0 for most chromosomes, indicating diploidy. Tumor T5 is an invasive adenocarcinoma and shows extensive aneuploidy. f, Phylogenetic lineage tracing of multiple tumors from patient III-1 based on Whole Exome Sequencing with PhylogicNDT. Theoretical cell populations are circles and clones derived from the WES are squares (e.g. c1). The germline EGFR mutation found in normal lung tissue is denoted at the top. The branches are configured based on shared and distinct mutations in each clone. Numbers within lineage tracings represent the number of new additional exomic mutations identified in each clone. The common somatically acquired EGFR mutations are shown, with the clones where they were identified in grey boxes. We cannot determine whether clones that share a boxed EGFR mutation developed independently or from a shared precursor. Resected tumors are assigned to clones based on their majority population in the pie charts shown below the tree. The tumors from the first resection, T1-T6, share no mutations outside of EGFR, as represented on the tree by no intersection point for clones 1 and 12–16, and in the pie charts by no colors shared between pie charts. In contrast, the tumors from the second resection, T7-T13, share 26 mutations, as represented by the long trunk leading from cl1 to cl2 before branching into cl4, 5, 8, and 10. Additionally, the pie charts for these tumors are complex mixtures of these four clones and clones are shared among multiple tumors.
Figure 2.
Figure 2.. Germline H988P and G873E mutations increase EGFR activity.
a, Position of the H988P, G873E, L858R, and T790M mutations within a partial EGFR protein crystal structure (aligned PDB structures EGFR 696–1022 T790M (5gty) and EGFR 703–985 (4zjv). H988 in orange, G873 in magenta). The autophosphorylation domain (shown in green) is adjacent to the catalytic tyrosine kinase domain (shown in blue). S1060 is not in this structure as it only exists in a different isoform. The H988P mutation is within the autophosphorylation domain and the G873E mutation is in the tyrosine kinase domain. b, Schematic of the multiple tumor locations in patients 4 and 5. c, Lineage tracing of the three tumors in patient 4 and the four tumors in patient 5, derived from Whole Exome Sequencing (WES). The constitutional EGFR mutation found in normal lung tissue and in all tumors is denoted at the top of the trees. Somatically acquired canonical activating EGFR mutations occurred in all tumors. We cannot determine whether clones that share a boxed EGFR mutation developed independently or from a shared precursor. Pie charts below the tree indicate clonal representation within each resected tumor. As with the first resection for patient III-1 (Figure 1f), these trees show no intersection between the branches, indicating independent tumors that only share the EGFR mutation. Consistently, the pie charts do not share any color between tumors. d-e, Functional effect of the H988P EGFR mutant, compared with wild type construct, assayed using western blotting of EGFR phosphorylation (D) or downstream Akt signaling (E) as markers of EGFR activation in mouse NIH 3T3 cells, which lack endogenous EGFR expression. EGFR phosphorylation at tyrosine 845 (Y845) and Akt phosphorylation at serine 473 (S473) are measured, quantified by total EGFR protein control and vinculin loading control, under three culture conditions: baseline culture (10% fetal bovine serum), serum starvation (24 hr) and 5 min after addition of EGF (100 ng/mL) to starved cultures. The H988P mutant shows constitutive signaling, compared with wild type protein under baseline unstimulated conditions. All blots within a subfigure came from the same gel. Quantifications below the blots correspond to the normalized average p-EGFR signal as detailed in Supplementary Figure 3. f, Quantification of colony formation by NIH 3T3 cells in soft agar, a correlate of tumorigenic potential, in cells expressing either wild type, L858R mutant, or H988P mutant EGFR constructs. Quantitation represents three independent experiments. Error bars are SEM. P-values are a one-tailed unpaired t-test. **p<0.01. g-i, EGFR and Akt phosphorylation and quantification of soft agar colony formation in cells expressing G873E, analyzed as in Fig 2f. ****p<0.0001 The G873E mutation itself does not alter EGFR signaling measurably, but it synergizes with an in cis canonical L858R mutation. The in cis L858R/T790M mutant allele is shown as a control.
Figure 3.
Figure 3.. Lineage tracing of metastatic cancers.
Phylogenetic trees from WES of two metastatic patients. Numbers on branches are mutations that accumulated between two nodes. As with the second resection for patient III-1 (Figure 1F), these trees show a long trunk of shared mutations before branching into separate clones. Consistently, the pie charts are made up of mixtures of clones that are shared between tumors.
Figure 4.
Figure 4.. Mosaic somatic EGFR mutations mediate multiple primary lung tumors resulting from shared common ancestors.
WES-derived phylogenetic trees of four cases with multiple tumors that share a common somatic ancestor. The shared somatic mutations, including EGFR, are shown in magenta. Numbers on branches are mutations that accumulated between two nodes, which represent distinct clones identified by WES. In comparison with the previous cases, the branches of these trees do intersect at the pink clones, indicating some shared genetic ancestry that is not observed in the completely independent or germline tumors. However, the number of shared mutations and the trunk of shared ancestry is very small relative to the total number of mutations in each clone. This is distinct from the patients with metastatic cancer. The pie charts of these tumors all exhibit the pink clone, but are otherwise relatively simple and do not share clones between tumors. a, In case 7, the two geographically distinct tumors share an extremely rare somatic EGFR mutation, SPKANTKEI752del, and then acquire 105 and 289 separate exomic mutations. b, In case 8, both tumors share the recurrent mutation L858R, in addition to five somatic mutations, before acquiring 105 and 136 separate mutations each. c, In case 9, four tumors share the L858R mutation before acquiring between 27 and 435 private mutations. d, In case 10, six tumors share L588R, in addition to three somatic mutations, before acquiring 85–474 private mutations.
Figure 5.
Figure 5.. Developmental mosaicism is demonstrated by mutated normal lung cells and early common ancestors.
a, Detection of the L858R EGFR mutation using droplet digital PCR (ddPCR) within normal lung tissue, in three cases where the tumor harbors the same mutation, but not in cases where the tumor contains another EGFR mutation (Neg Ctrl, patients 1 and 7). The variant allele frequency (VAF, EGFR L858R mutant copies/total EGFR copies) for tumors is on the left y-axis (blue) while the lower VAF in normal samples is on the right y-axis (red). b, A conceptualization of how poly-G correlation analysis reflects the relative time at which two related tumors diverged from each other and from the normal tissue. As the point of tumor separation (e.g. spontaneous initiation or metastasis) moves away from the zygote in time (divergence from zygote), the number of cell divisions that may have occurred after the tumors separated from each other decreases (divergence between tumors). The divergence between tumors is reflected in the poly-G analysis as the inverse of the correlation (r). This model shows that as r increases (1/r decreases), the relative time of divergence moves closer to the present. c, Schematic of poly-G genotype analysis method, based on Naxerova et al, 2017. Tumor and normal samples collected from a single patient have poly-G sites that may have undergone slippage due to hypermutability. The PCR-based assay detects these indels and measures their mean length change compared to normal tissue. These changes compared to normal are represented in heat maps. Comparing two tumors produces a single point for each poly-G site. The correlation between the two tumors across all poly-G sites is represented by the Pearson’s correlation coefficient (r). d, Representative heatmap showing the mean distance from normal lung for each poly-G hypermutable region, for each tumor from patient III-1. The stronger the color, the more different the region is from normal. Tumors that have very similar patterns are more closely related than tumors that have different patterns. e, Phylogenetic tree of patient III-1 based on the poly-G derived Manhattan distance reconstructed using the neighbor joining method. The tree is rooted at the germline sample. A vertical bar at the leaves of the phylogenetic tree shows the resection time of each tumor sample. I) shows only samples from the first resection and II) shows samples from the second resection plus recurring sample T5. f, Representative correlation plots between tumors from patient III-1 showing how Pearson’s r measure of relatedness was determined. Two tumors being compared are on each axis (T12 and T5 in left graph and T2 and T5 in right graph) and the dots represent the mean length from normal at each poly-G location. r estimates what fraction of cell divisions were shared between the tumor pair before they diverged. The grey shading represents the 95% confidence interval of the correlation. g, Relatedness between tumors within a patient or between patients, as quantified by the poly-G correlation between tumor pairs. Each point represents the poly-G evolutionary distance between two tumors from cases that are unrelated (different individuals), mosaic or metastatic (classification based on WES sequencing analysis of exonic mutations). Unrelated tumors have fewer shared divisions than either mosaic or metastatic tumors. The dotted line represents that correlation coefficient below which 95% of the unrelated tumor pairs fall. Box plot elements: center line, median; box limits, lower and upper quartiles; whiskers, lowest and highest value within 1.5 IQR. p-values are a Holm-Bonferroni corrected post-hoc Dunn’s test after a significant Kruskal-Wallis test. **p=8.5E-3, ****p=6.4E-18. The arrow is the tumor pair from metastatic patient 3.
Figure 6.
Figure 6.. Genetic distinctions between multiple lung cancers with inherited, mosaic and metastatic origin.
Schematic representation of three distinct mechanisms underlying multiple EGFR-mutant lung tumors. The average percent of somatic mutations shared among different tumors is shown on the right (range in parentheses). a, In cases with inheritance of an attenuated mutant EGFR allele (either familial or apparent sporadic), the mutation is present in the germline (lightning bolt) and present in all somatic tissues. A second canonical EGFR mutation arises somatically at high frequency in predisposed lung cells, leading to multiple tumors with no shared somatic mutations. The evolutionary distance to the most common shared ancestor between different tumors (arrow) extends to the germline. 0 non-germline mutations are shared between tumors. b, Cases with mosaic predisposition arise from acquisition of an EGFR mutation during development (lightning bolt). This timing determines the proportion of normal cells containing the variant allele and the likelihood of developing multiple tumors. In addition to the activating EGFR mutation, a small number of additional somatic genetic variants are shared before the mosaic tissues diverge and acquire independent tumor-associated mutations. c, In sporadic cancers without genetic susceptibility, a single EGFR mutation arises in a somatic lung epithelial cell (lightning bolt), generating a single tumor. Metastases from this tumor share extensive mutational profiles and the most recent common ancestor for these multiple tumors is the primary tumor.

References

    1. Gazdar A.F. & Minna J.D. Multifocal lung cancers--clonality vs field cancerization and does it matter? J Natl Cancer Inst 101, 541–543 (2009). - PMC - PubMed
    1. Detterbeck F.C., et al. The IASLC Lung Cancer Staging Project: Summary of Proposals for Revisions of the Classification of Lung Cancers with Multiple Pulmonary Sites of Involvement in the Forthcoming Eighth Edition of the TNM Classification. J Thorac Oncol 11, 639–650 (2016). - PubMed
    1. National Lung Screening Trial Research, T., et al. Reduced lung-cancer mortality with low-dose computed tomographic screening. N Engl J Med 365, 395–409 (2011). - PMC - PubMed
    1. Leventakos K., et al. Management of Multifocal Lung Cancer: Results of a Survey. J Thorac Oncol 12, 1398–1402 (2017). - PMC - PubMed
    1. Yang S.R., et al. Invasive Mucinous Adenocarcinomas With Spatially Separate Lung Lesions: Analysis of Clonal Relationship by Comparative Molecular Profiling. J Thorac Oncol 16, 1188–1199 (2021). - PMC - PubMed

Publication types