[Preprint]. 2023 Sep 27:2023.09.26.559521.
doi: 10.1101/2023.09.26.559521.

Synchronized long-read genome, methylome, epigenome, and transcriptome for resolving a Mendelian condition

Affiliations

Synchronized long-read genome, methylome, epigenome, and transcriptome for resolving a Mendelian condition

Mitchell R Vollger et al. bioRxiv. .

Update in

  • Synchronized long-read genome, methylome, epigenome and transcriptome profiling resolve a Mendelian condition.
    Vollger MR, Korlach J, Eldred KC, Swanson E, Underwood JG, Bohaczuk SC, Mao Y, Cheng YH, Ranchalis J, Blue EE, Schwarze U, Munson KM, Saunders CT, Wenger AM, Allworth A, Chanprasert S, Duerden BL, Glass I, Horike-Pyne M, Kim M, Leppig KA, McLaughlin IJ, Ogawa J, Rosenthal EA, Sheppeard S, Sherman SM, Strohbehn S, Yuen AL, Stacey AW; University of Washington Center for Rare Disease Research; Undiagnosed Diseases Network; Reh TA, Byers PH, Bamshad MJ, Hisama FM, Jarvik GP, Sancak Y, Dipple KM, Stergachis AB. Vollger MR, et al. Nat Genet. 2025 Feb;57(2):469-479. doi: 10.1038/s41588-024-02067-0. Epub 2025 Jan 29. Nat Genet. 2025. PMID: 39880924 Free PMC article.

Abstract

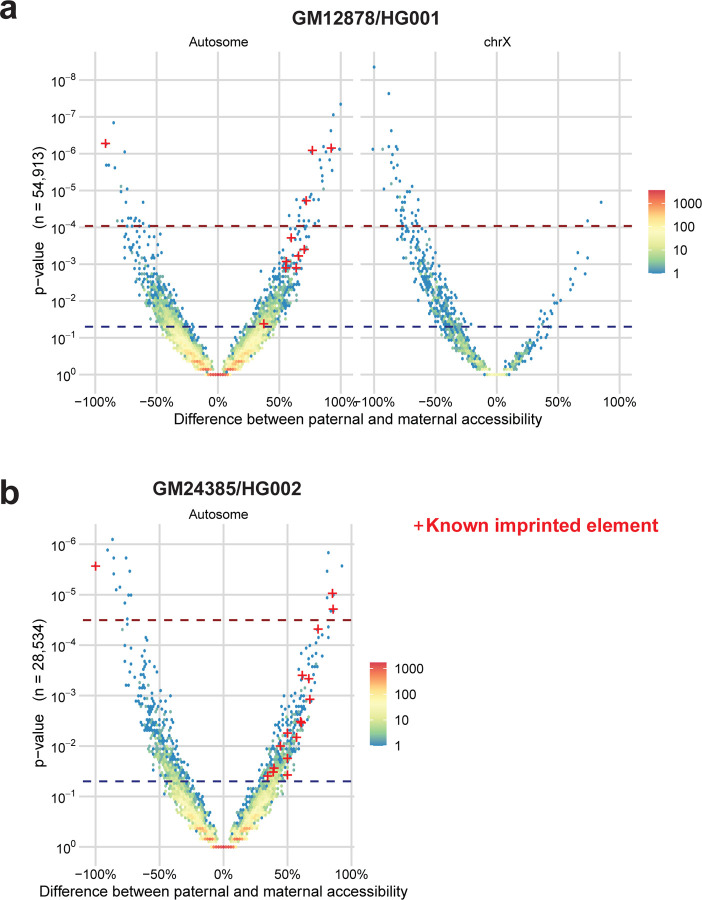
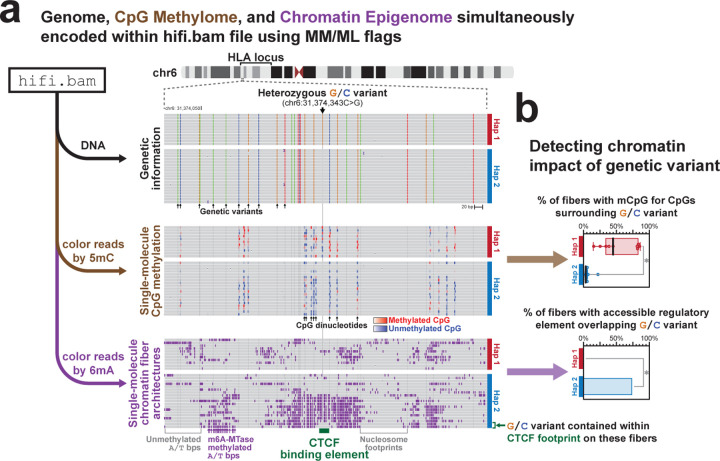
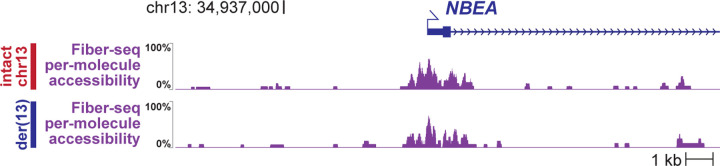
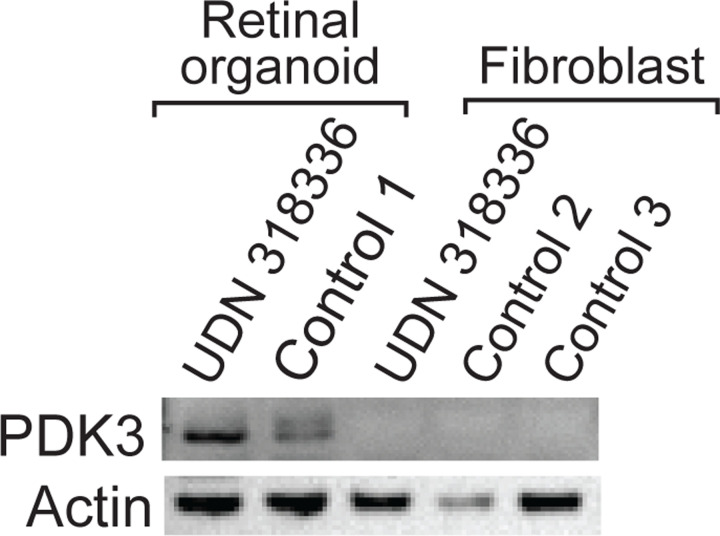
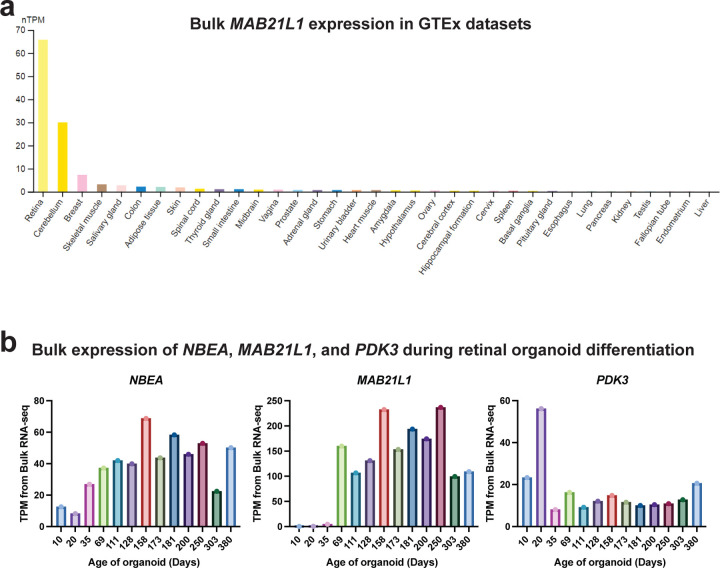
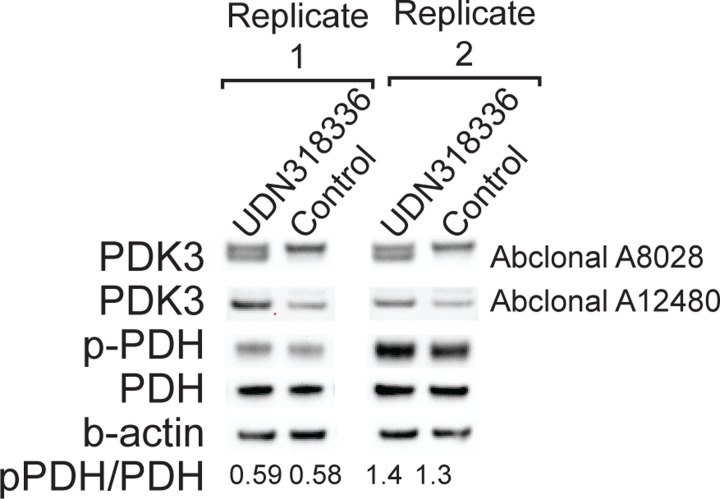
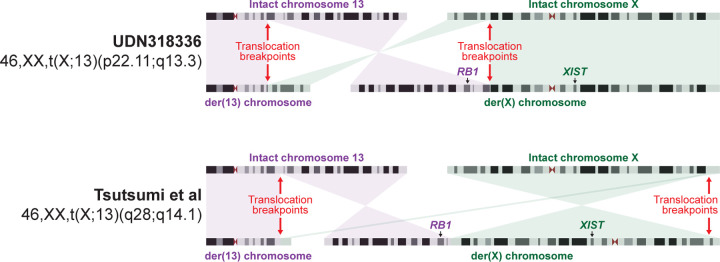
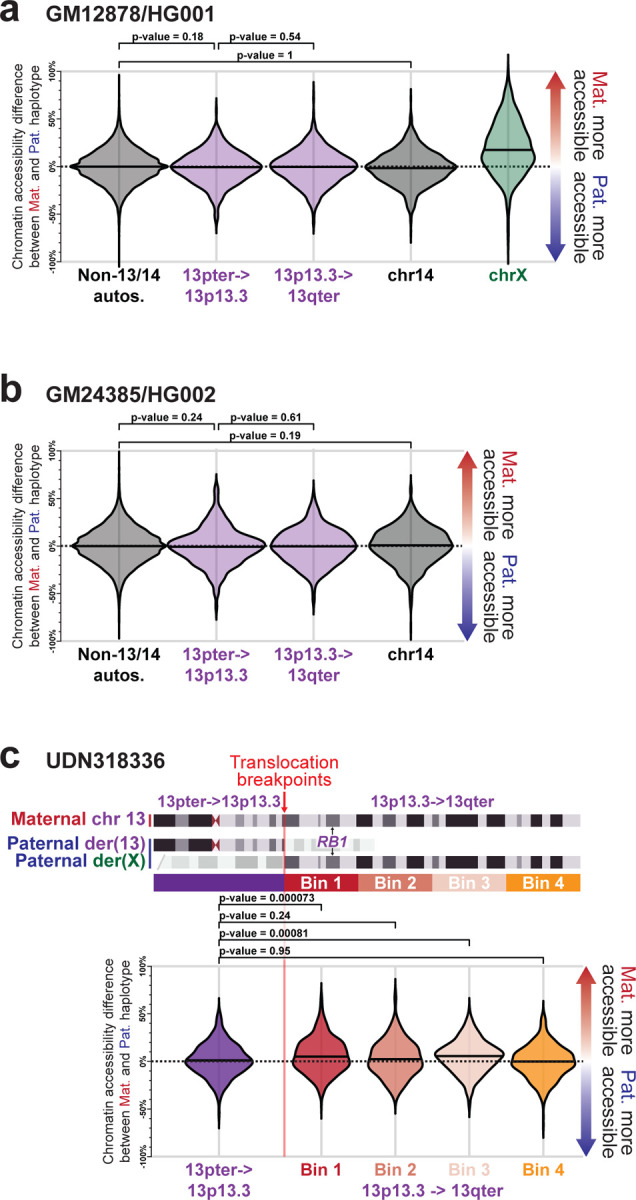
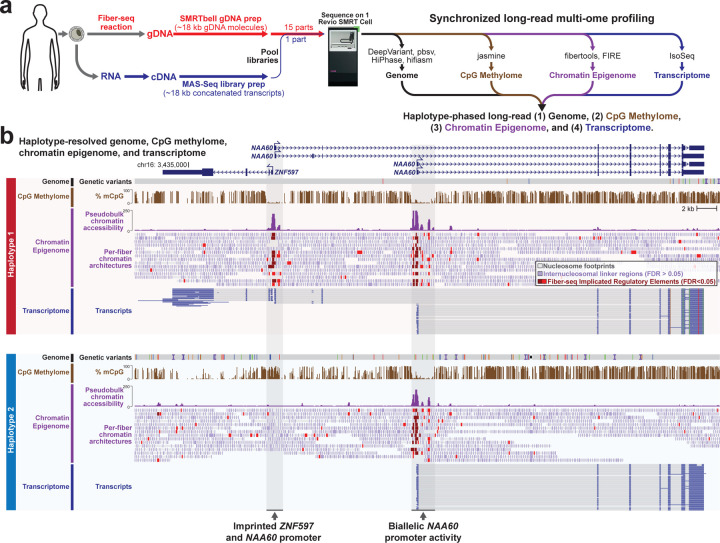
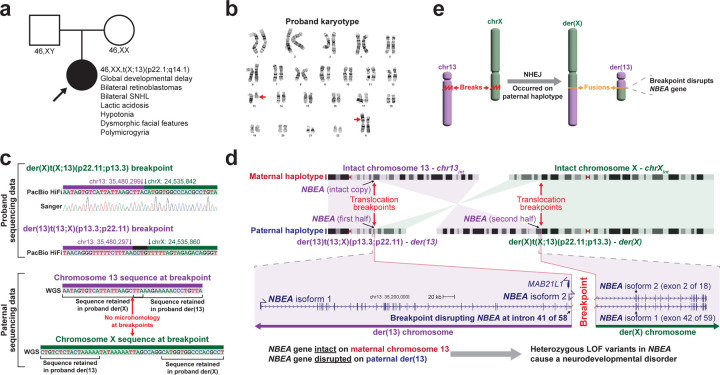
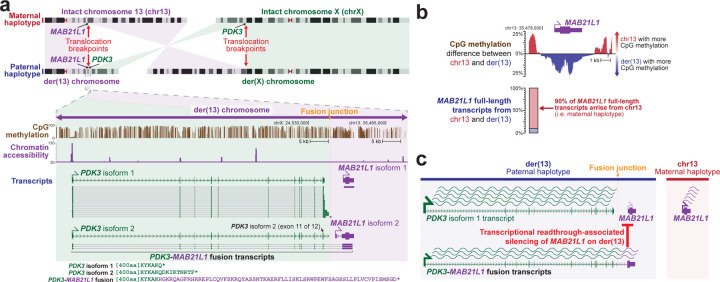
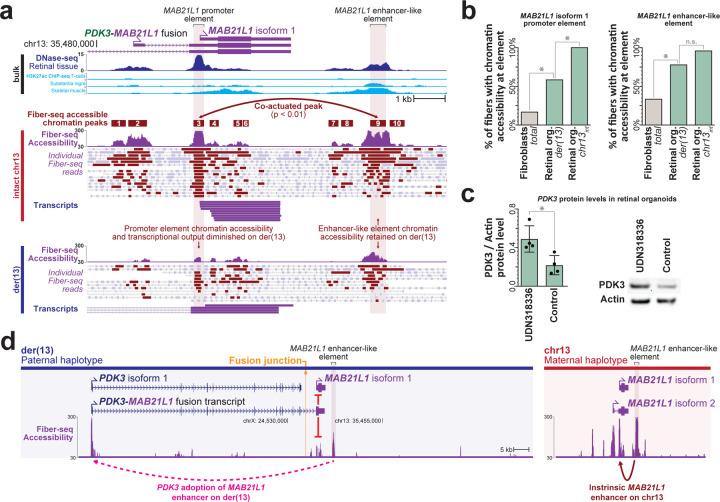
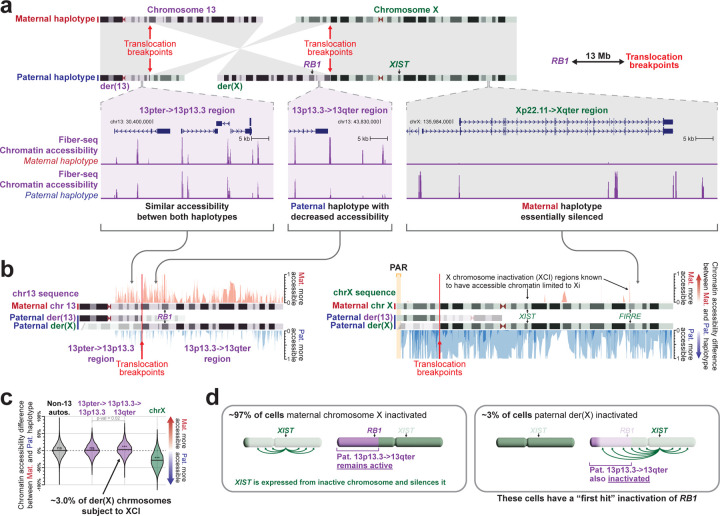
Resolving the molecular basis of a Mendelian condition (MC) remains challenging owing to the diverse mechanisms by which genetic variants cause disease. To address this, we developed a synchronized long-read genome, methylome, epigenome, and transcriptome sequencing approach, which enables accurate single-nucleotide, insertion-deletion, and structural variant calling and diploid de novo genome assembly, and permits the simultaneous elucidation of haplotype-resolved CpG methylation, chromatin accessibility, and full-length transcript information in a single long-read sequencing run. Application of this approach to an Undiagnosed Diseases Network (UDN) participant with a chromosome X;13 balanced translocation of uncertain significance revealed that this translocation disrupted the functioning of four separate genes (NBEA, PDK3, MAB21L1, and RB1) previously associated with single-gene MCs. Notably, the function of each gene was disrupted via a distinct mechanism that required integration of the four 'omes' to resolve. These included nonsense-mediated decay, fusion transcript formation, enhancer adoption, transcriptional readthrough silencing, and inappropriate X chromosome inactivation of autosomal genes. Overall, this highlights the utility of synchronized long-read multi-omic profiling for mechanistically resolving complex phenotypes.


Conflict of interest statement

Conflicts J.K., J.G.U., C.T.S., A.M.W., M.K. and I.J.M. are full-time employees at PacBio, a company developing single-molecule sequencing technologies. A.B.S. is a co-inventor on a patent relating to the Fiber-seq method (US17/995,058).

Figures

Extended Data Figure 1 |
Extended Data Figure 1 |. IGV view of integrated long-read multi-ome data
IGV view showing an example genomic region for GM12878 (from top to bottom panels) the haplotype-resolved genome, CpG methylome, chromatin, and full-length transcript annotations.
Extended Data Figure 2 |
Extended Data Figure 2 |. Haplotype-specific chromatin architectures
a, Volcano plot showing the absolute difference in the % of chromatin fibers with chromatin accessibility for each peak genome-wide between the paternal and maternal haplotypes for GM12878. Peaks are divided into whether they are present on an autosome, or the X chromosome. P-value was calculated using the Fisher exact test. Blue dash represents nominal significance line (p<0.01), red dash represents the Benjamini Hochberg FDR correction significance line. Peaks corresponding to known imprinted loci with nominally significant scores are denoted by red crosses. b, Same as a, but for GM24385. Data from the X chromosome is not shown, as GM24385 only has one haplotype for the X chromosome.
Extended Data Figure 3 |
Extended Data Figure 3 |. Identification of haplotype-specific chromatin architectures within HLA locus
a, View of single-molecule haplotype-resolved genetic information, CpG methylation information, and chromatin accessibility information for a heterozygous single-nucleotide variant (SNP) identified within the HLA locus. Note that all information is derived from the same sequencing reads. Denoted below is the location of a predicted CTCF binding element, and immediately above it are two fibers that demonstrate single-molecule protein occupancy at this site. b, Quantification of CpG methylation surrounding this SNP (top), as well as the % of fibers with a FIRE element overlapping that SNP (bottom), by haplotype. * p<0.01 (Fisher exact test).
Extended Data Figure 4 |
Extended Data Figure 4 |. Haplotype-specific chromatin accessibility of NBEA promoter
Per-molecule chromatin accessibility of the NBEA promoter along both the der(13) and intact chr13 chromosomes within patient derived fibroblasts. Chromatin accessibility measured using Fiber-seq.
Extended Data Figure 5 |
Extended Data Figure 5 |. PDK3 protein levels in patient cells
Western blot of PDK3 and actin protein levels in patient derived fibroblasts and retinal organoids, as well as control age matched retinal organoids and fibroblast cultures.
Extended Data Figure 6 |
Extended Data Figure 6 |. Cell-selective expression of MAB21L1
a, Barplot showing the bulk tissue RNA expression of MAB21L1 (ENSG00000180660) from various GTEx samples are displayed by www.proteinatlas.org. b, Bulk expression of NBEA, MAB21L1, and PDK3 during retinal organoid differentiation as a function of the age of the organoid. TPM - transcripts per million.
Extended Data Figure 7 |
Extended Data Figure 7 |. PDK3 protein levels in patient retinal organoids
Western blot images showing quantification of PDK3, phospho-PDH, PDH, and beta-actin levels in patient-derived retinal organoids, as well as age matched retinal organoids from a separate unaffected and unrelated individual. Data from two separate protein extractions are displayed. Quantification of phospho-PDH to PDH level is shown at bottom.
Extended Data Figure 8 |
Extended Data Figure 8 |. Comparison with prior chromosome X;13 translocations
Idiogram showing the translocation breakpoints and derivative chromosomes for this case, as well as a previously published case who similarly had bilateral retinoblastomas. The translocation breakpoints for the previously published case are estimated based on the karyotype.
Extended Data Figure 9 |
Extended Data Figure 9 |. Allelic imbalance differences along chr13
a, Swarm plot showing the overall haplotype imbalance in chromatin accessibility along autosomes (except for chromosomes 13 and 14), chromosome X, chromosome 14, and two portions of chromosome 13 within GM12878. P-value calculated using Fisher exact test. b, Same as a, but for GM24385 cells. c, Swarm plot showing the haplotype imbalance in chromatin accessibility at different regions of chromosome 13 in fibroblasts from UDN318336.
Figure 1 |
Figure 1 |. Synchronized long-read genome, methylome, epigenome and transcriptome sequencing
a, Schematic describing the experimental and computational workflow for synchronized multi-ome profiling. Specifically, cells are subjected to a Fiber-seq reaction followed by genomic DNA extraction and SMRTbell library preparation, and in parallel cells are subjected to an RNA extraction followed by complementary DNA (cDNA) synthesis and MAS-Seq library preparation. The two libraries are then mixed together and sequenced simultaneously using a single sequencing run, enabling the simultaneous detection of the genome, CpG methylome, chromatin epigenome, and transcriptome from the sample. b, Example genomic region showing the haplotype-resolved genome, CpG methylome, chromatin epigenome, and transcriptome from GM12878 cells at a known imprinted locus.
Figure 2 |
Figure 2 |. Long-read multi-ome for resolving the genetic basis of an unsolved Mendelian condition
a, Pedigree for the proband, as well as the clinical features of the proband and the results of her karyotype and that of her parents. b, Image of the proband’s karyotype with the der(13) and der(X) chromosomes marked by red arrows. c, Sequence of the breakpoints on der(X) and der(13), as well as the sequence of this same region in chromosomes 13 and X in her father. Sanger trace showing validation of the der(X) breakpoint junction. d, (top) Idiogram showing the intact chromosomes 13 and X, as well as the derivative chromosomes 13 and X in the proband. Translocation breakpoints, and the location of the gene NBEA are highlighted. (bottom) Gene model for both NBEA isoforms that differ in their transcriptional start site, showing the portion of NBEA that is located on der(13) versus der(X). e, Schematic showing the breakpoint and fusion event that occurred selectively on the paternal haplotype.
Figure 3 |
Figure 3 |. der(13) results in a PDK3-MAB21L1 fusion transcript and MAB21L1 silencing
a, (top) Idiogram showing the intact chromosomes 13 and X, as well as the derivative chromosomes 13 and X in the proband. Translocation breakpoints, and the location of the genes PDK3 and MAB21L1 are highlighted. (bottom) CpG methylation, chromatin accessibility, and full-length transcript data selectively on the der(13) haplotype are displayed, highlighting the formation of a fusion transcript between PDK3 and MAB21L1. b, (top) CpG methylation differences at the MAB21L1 promoter between chr13int and der(13) demonstrating selective hyper-CpG methylation of the MAB21L1 promoter along der(13). (below) Allelic imbalance of full-length MAB21L1 transcripts between chr13int and der(13) demonstrating silencing of MAB21L1 along der(13). c, Schematic for transcriptional readthrough silencing of the MAB21L1 gene selectively along der(13).
Figure 4 |
Figure 4 |. Placement of a MAB21L1 enhancer-like element adjacent to PDK3 along der(13)
a, MAB21L1 locus showing bulk DNase-seq and H3K27ac ChIP-seq (top), as well as haplotype-resolved Fiber-seq chromatin accessibility and full-length cDNA transcripts from patient-derived retinal organoids (bottom). Single chromatin accessibility peak pair with significant single-molecule co-actuated chromatin accessibility is shown, exposing a downstream enhancer-like element for MAB21L1 isoform 1 promoter. b, Chromatin accessibility of the MAB21L1 isoform 1 promoter, as well as the downstream enhancer-like element in patient-derived fibroblasts and retinal organoids (left), as well as their haplotype-specific accessibility in patient-derived retinal organoids (right). c, Bar plot and western blot showing PDK3 and beta-actin protein levels within patient-derived retinal organoids, as well as age-matched control retinal organoids. * p-value 0.0183 (T test) d, MAB21L1 locus along the der(13) and chr13int chromosomes showing the placement of a strong MAB21L1 enhancer-like element in proximity to the PDK3 promoter selectively along the der(13) haplotype.
Figure 5 |
Figure 5 |. Inappropriate X chromosome inactivation of the RB1 locus along der(X)
a, (top) Idiogram showing the intact chromosomes 13 and X, as well as the derivative chromosomes 13 and X in the proband. Translocation breakpoints, and the location of the genes RB1 and XIST are highlighted. (bottom) Haplotype-resolved chromatin accessibility is displayed for loci across the der(13) and der(X) chromosomes. b, Difference in chromatin accessibility between the maternal and paternal haplotype across loci along chromosome 13 (left) and chromosome X (right). Regions with more red than blue signal have more chromatin accessibility along chr13int versus der(13) or chrXint versus der(X). c, Swarm plot showing the overall haplotype imbalance in chromatin accessibility along autosomes (except for chromosome 13), chromosome X, and two portions of chromosome 13. Specifically, the 13pter->13p13.3 region is present along chr13int and der(13), whereas the 13p13.3->13qter region is present along chr13int and der(X). P-value calculated using Mann-Whitney U-test. d, Model showing inappropriate XCI of the autosomal region along der(X) that contains the RB1 locus as the first hit for the development of bilateral retinoblastomas in this patient.

References

    1. Nurk S. et al. The complete sequence of a human genome. Science 376, 44–53 (2022). - PMC - PubMed
    1. Merker J. D. et al. Long-read genome sequencing identifies causal structural variation in a Mendelian disease. Genet Med 20, 159–163 (2018). - PMC - PubMed
    1. Hiat S. M. et al. Long-read genome sequencing for the molecular diagnosis of neurodevelopmental disorders. HGG Adv 2, (2021). - PMC - PubMed
    1. Cohen A. S. A. et al. Genomic answers for children: Dynamic analyses of >1000 pediatric rare disease genomes. Genet Med 24, 1336–1348 (2022). - PubMed
    1. Lunke S. et al. Integrated multi-omics for rapid rare disease diagnosis on a national scale. Nat Med 29, (2023). - PMC - PubMed

Publication types