[Preprint]. 2023 Sep 27:2023.09.26.559408.
doi: 10.1101/2023.09.26.559408.

Sleep and circadian rhythm disruption by NPTX2 loss of function

Affiliations

Sleep and circadian rhythm disruption by NPTX2 loss of function

Seung-Eon Roh et al. bioRxiv. .

Abstract

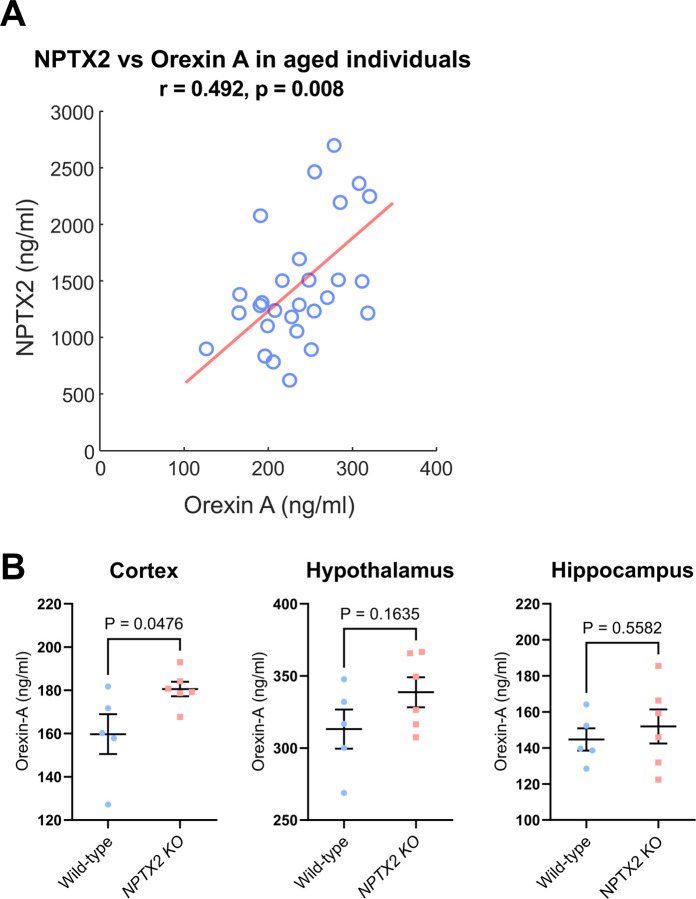
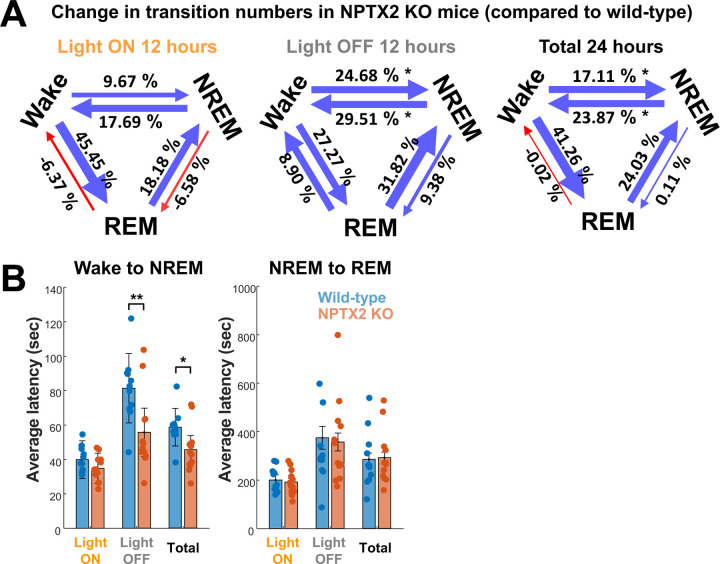
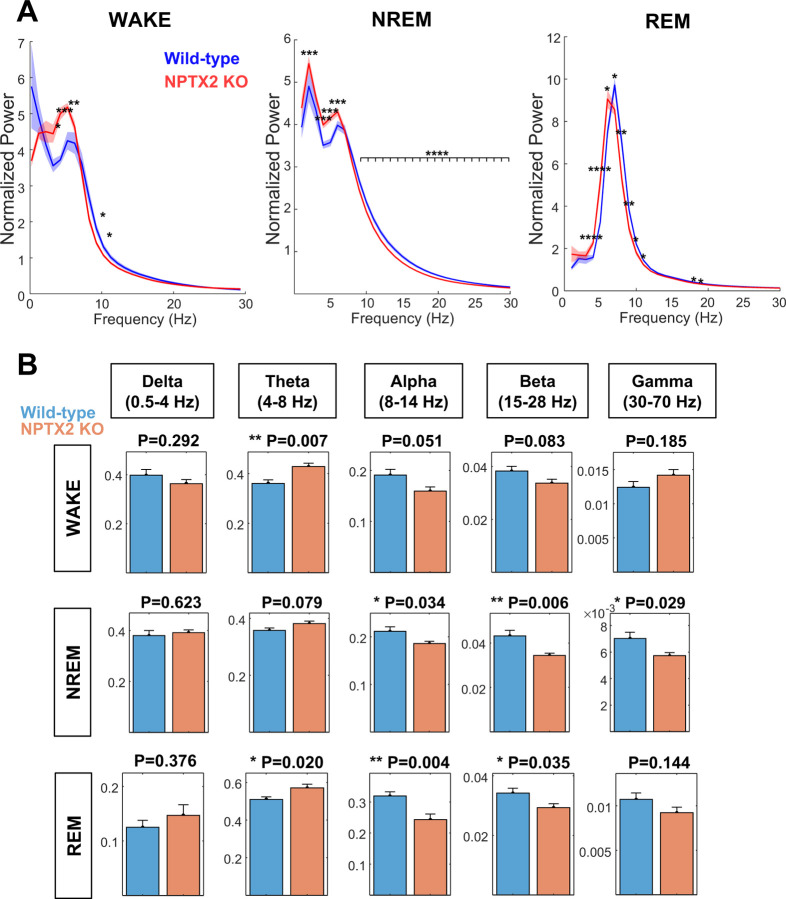
Sleep and circadian rhythm disruption (SCRD) is commonly observed in aging, especially in individuals who experience progressive cognitive decline to mild cognitive impairment (MCI) and Alzheimer's disease (AD). However, precise molecular mechanisms underlying the association between SCRD and aging are not fully understood. Orexin A is a well-characterized "sleep neuropeptide" that is expressed in hypothalamic neurons and evokes wake behavior. The importance of Orexin is exemplified in narcolepsy where it is profoundly down-regulated. Interestingly, the synaptic immediate early gene NPTX2 is co-expressed in Orexin neurons and is similarly reduced in narcolepsy. NPTX2 is also down-regulated in CSF of some cognitively normal older individuals and predicts the time of transition from normal cognition to MCI. The association between Orexin and NPTX2 is further evinced here where we observe that Orexin A and NPTX2 are highly correlated in CSF of cognitively normal aged individuals and raises the question of whether SCRD that are typically attributed to Orexin A loss of function may be modified by concomitant NPTX2 down-regulation. Is NPTX2 an effector of sleep or simply a reporter of orexin-dependent SCRD? To address this question, we examined NPTX2 KO mice and found they retain Orexin expression in the brain and so provide an opportunity to examine the specific contribution of NPTX2 to SCRD. Our results reveal that NPTX2 KO mice exhibit a disrupted circadian onset time, coupled with increased activity during the sleep phase, suggesting difficulties in maintaining states. Sleep EEG indicates distinct temporal allocation shifts across vigilance states, characterized by reduced wake and increased NREM time. Evident sleep fragmentation manifests through alterations of event occurrences during Wake and NREM, notably during light transition periods, in conjunction with an increased frequency of sleep transitions in NPTX2 KO mice, particularly between Wake and NREM. EEG spectral analysis indicated significant shifts in power across various frequency bands in the wake, NREM, and REM states, suggestive of disrupted neuronal synchronicity. An intriguing observation is the diminished occurrence of sleep spindles, one of the earliest measures of human sleep disruption, in NPTX2 KO mice. These findings highlight the effector role of NPTX2 loss of function as an instigator of SCRD and a potential mediator of sleep disruption in aging.


Conflict of interest statement

Competing interests The authors declare no competing interests.

Figures

Figure 1.
Figure 1.. Correlation of NPTX2 and Orexin in the CSF of normal aging and Orexin levels in NPTX2 KO mice.
(A) Spearman regression analysis between the level of CSF NPTX2 and Orexin A in normal individuals. n = 29 human individuals. r and p values were indicated. (B) The concentration of Orexin in lysates of the cortex, hypothalamus and hippocampus between wild-type and NPTX2 KO mice, determined by Orexin A ELISA. N = 5 wild-type and 6 NPTX2 KO. An unpaired t-test was performed. P values were indicated.
Figure 2.
Figure 2.. Disrupted circadian rhythm, onset time and activity profile in NPTX2 KO mice.
(A) Representative actogram of the wheel-running activity of wild-type and NPTX2 KO mice. Each row represents activity level per minute during a day across the indicated light-dark schedule. During 1–14 and 29–42 days, a normal LD cycle was applied (light on from 5 to 17 CT), while during 15–28 days, light was completely off. (B-C) Comparison of the period and amplitude (± SEM) between wild-type and NPTX2 KO mice. Mann-Whitney U test was performed to compare Wild-type and NPTX2 KO mice. (D) Representative actogram with onset detection (red) in wild-type and NPTX2 KO mice during DD schedule. Each row represents the activity level per minute each day (upper). The circadian onset time over 14 days was presented in graphs (lower). (E-F) Averaged onset delay and covariance (CV) of onset time across 14 days of DD period in wild-type and NPTX2 KO mice. (G) Averaged number of wheel revolutions (± SEM) across 14 days of LD schedule. (H) Comparison of wheel revolution number between wild-type and NPTX2 KO mice in light off and light on phase. Unpaired t-test was performed to compare wild-type and NPTX2 KO mice. P values were indicated. (I) Averaged number of wheel revolutions (± SEM) across 14 days of DD schedule. (J) Comparison of wheel revolution number between wild-type and NPTX2 KO mice during activity and during sleep. Unparied t-test was performed to compare between wild-type and NPTX2 KO mice. P values were indicated. N = 10 wild-type and 10 NPT2 KO animals.
Figure 3.
Figure 3.. Alterations sleep architecture and sleep fragmentation in NPTX2 KO mice.
(A-B) Representative hypnograms during 12 hours (A) and 1 hour (B) in wild-type and NPTX2 KO mice for light on and light off phases. (C) Hourly percentage of time spent (± SEM) for Wake, NREM and REM across a day of sleep and wake cycle (24 hours) in young wild-type and NPTX2 KO mice. Nonparametric unpaired t-test was performed between the wild-type and NPTX2 KO group for each time point. Significant changes were indicated (*, P<0.05). (D) Percentage of time spent (± SEM) for Wake, NREM and REM during light on (12 hours), light off (12 hours) and total (24 hours) comparing wild-type and NPTX2 KO mice. Unpaired t-test was performed between wild-type and NPTX2 KO groups for each phase. P values were indicated. (E) Hourly number of events (± SEM) per hour of Wake, NREM and REM across a day of sleep and wake cycle (24 hours) in young wild-type and NPTX2 KO mice. Unpaired t-test was performed between each pair of wild-type and NPTX2 KO group 24 time points. Significant changes were indicated (*, P<0.05). (F) Event numbers during light on (12 hours), light off (12 hours) and total (24 hours) comparing wild-type and NPTX2 KO mice. Unpaired t-test was performed between wild-type and NPTX2 KO group for each time range. The significant changes were indicated (*, P<0.05). (G) Hourly average duration (± SEM) per hour Wake, NREM and REM across a day of sleep and wake cycle (24 hours) in young wild-type and NPTX2 KO mice. Unpaired t-test was performed between all pairs of wild-type and NPTX2 KO group 24 time points. Significant changes were indicated (*, P<0.05). (H) The average duration during light on (12 hours), light off (12 hours) and total (24 hours) comparing wild-type and NPTX2 KO mice. Unpaired t-test was used to compare the wild-type and NPTX2 KO group for each time range. The significant change was indicated (*, P<0.05). N = 11 wild-type and 12 NPT2 KO animals.
Figure 4.
Figure 4.. Abnormal state transitions in NPTX2 KO mice.
(A) Diagrams showing relative changes of transition numbers in NPTX2 KO mice compared to wild-type mice among Wake, NREM and REM in different phases (light on 12 hours, light off 12 hours, and total 24 hours). Blue and red arrows indicate increased and decreased transition numbers in NPTX2 KO mice compared to wild-type, respectively. Changes were indicated as a percentage increase or decrease for each type of transition (Unpaired t-test, *, P<0.05). (B) Sleep latency for NREM and REM comparing wild-type and NPTX2 KO mice during light on, light off and total phases (Unpaired t-test, *, P < 0.05, **, P < 0.01). N = 11 wild-type and 12 NPT2 KO animals.
Figure 5.
Figure 5.. Altered power spectral density and frequency band power during different vigilance states in NPTX2 KO mice.
(A) Normalized power spectral density (± SEM) from 0 to 30 Hz in 24 hours during WAKE, NREM, and REM, comparing between wild-type and NPTX2 KO mice. Two-way ANOVA was performed for group comparison (P < 0.0001 for Wake, NREM, and REM). Multiple unpaired t-tests were performed to compare the wild-type and NPTX2 KO group for each frequency range. The significant change was indicated (*, P<0.05, **, P<0.01, ***, P<0.001 and ****, P<0.0001). (B) Normalized frequency band power (± SEM) of each of the waves (Delta, Theta, Alpha, Beta and Gamma) for WAKE, NREM and REM. Multiple unpaired t-tests were performed to compare the wild-type and NPTX2 KO mice. Significant differences were indicated (*, P<0.05 and **, P<0.01). N = 10 Wild-type and 11 NPT2 KO animals.
Figure 6.
Figure 6.. Reduced sleep spindle density and duration in NPTX2 KO mice.
(A) Representative wild-type NREM EEG trace and spindles detected by McSleep, along with transient and residual signals below. (B) Spindle density (spindle number per minute of sleep) and duration of all spindle events (± SEM) were shown. n = 18390 and 12623 events, N= 8 wild-type and 9 NPTX2 KO mice. Unpaired t-test was performed for comparison. P values were indicated.

References

    1. Allocca G., Ma S., Martelli D., Cerri M., Del Vecchio F., Bastianini S., Zoccoli G., Amici R., Morairty S. R., Aulsebrook A. E., Blackburn S., Lesku J. A., Rattenborg N. C., Vyssotski A. L., Wams E., Porcheret K., Wulff K., Foster R., Chan J. K. M., Nicholas C. L., Freestone D. R., Johnston L. A., and Gundlach A. L.. 2019. ‘Validation of ‘Somnivore’, a Machine Learning Algorithm for Automated Scoring and Analysis of Polysomnography Data’, Front Neurosci, 13: 207. - PMC - PubMed
    1. Alm K. H., Soldan A., Pettigrew C., Faria A. V., Hou X., Lu H., Moghekar A., Mori S., Albert M., and Bakker A.. 2022. ‘Structural and Functional Brain Connectivity Uniquely Contribute to Episodic Memory Performance in Older Adults’, Front Aging Neurosci, 14: 951076. - PMC - PubMed
    1. Appelbaum L., Wang G., Yokogawa T., Skariah G. M., Smith S. J., Mourrain P., and Mignot E.. 2010. ‘Circadian and homeostatic regulation of structural synaptic plasticity in hypocretin neurons’, Neuron, 68: 87–98. - PMC - PubMed
    1. Aracri P., Banfi D., Pasini M. E., Amadeo A., and Becchetti A.. 2015. ‘Hypocretin (orexin) regulates glutamate input to fast-spiking interneurons in layer V of the Fr2 region of the murine prefrontal cortex’, Cereb Cortex, 25: 1330–47. - PMC - PubMed
    1. Aryal S., Bonanno K., Song B., Mani D. R., Keshishian H., Carr S. A., Sheng M., and Dejanovic B.. 2023. ‘Deep proteomics identifies shared molecular pathway alterations in synapses of patients with schizophrenia and bipolar disorder and mouse model’, Cell Rep, 42: 112497. - PubMed

Publication types