[Preprint]. 2023 Sep 27:2023.09.25.559371.
doi: 10.1101/2023.09.25.559371.

A 4D transcriptomic map for the evolution of multiple sclerosis-like lesions in the marmoset brain

Affiliations

A 4D transcriptomic map for the evolution of multiple sclerosis-like lesions in the marmoset brain

Jing-Ping Lin et al. bioRxiv. .

Update in

Abstract

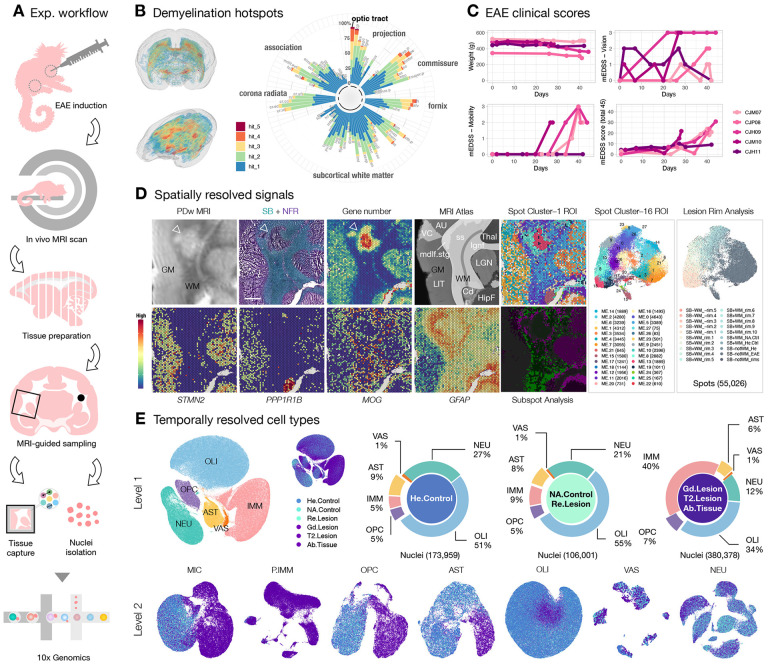
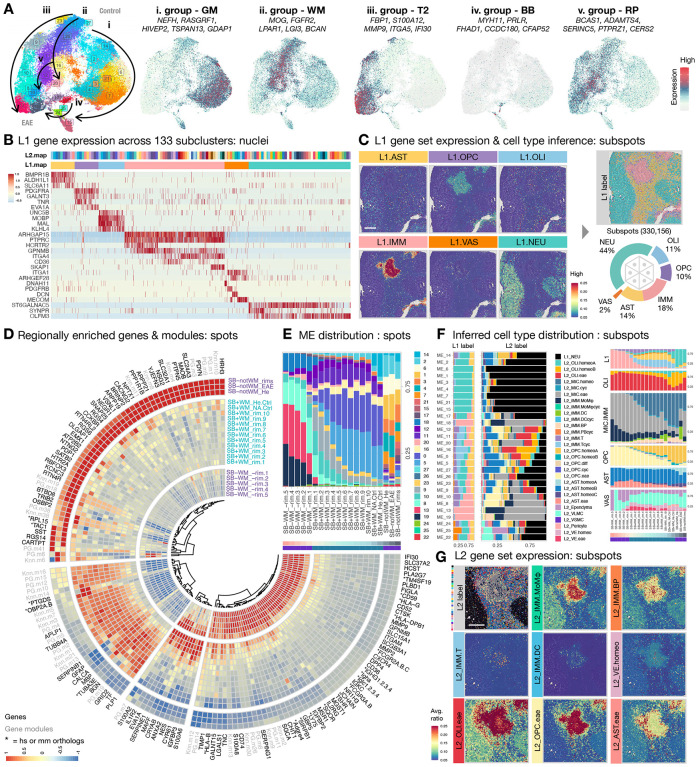
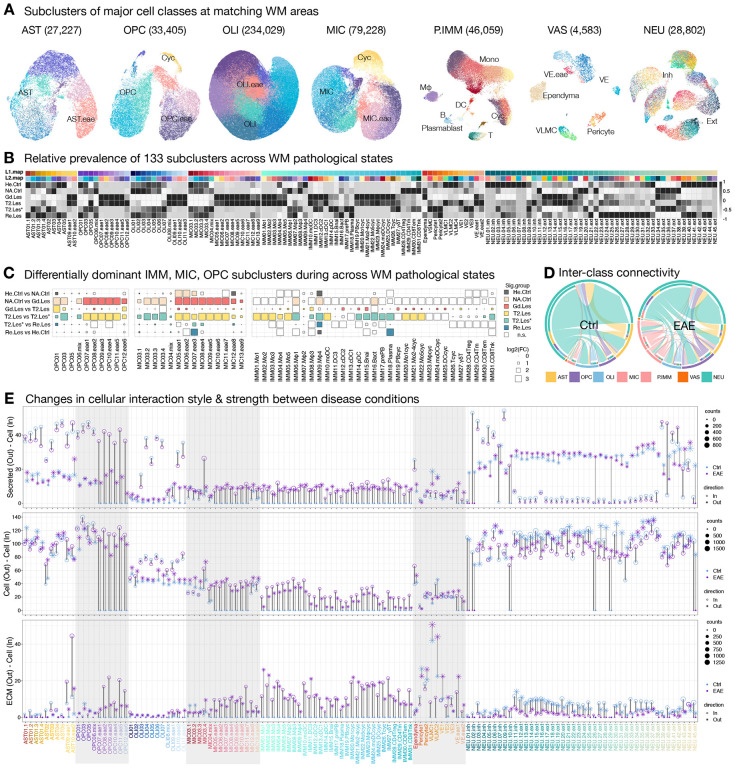
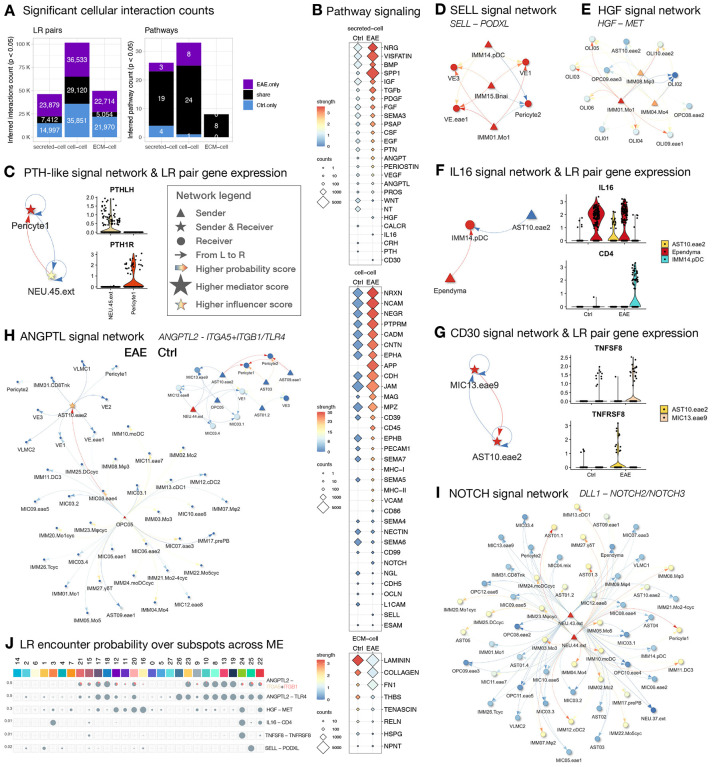
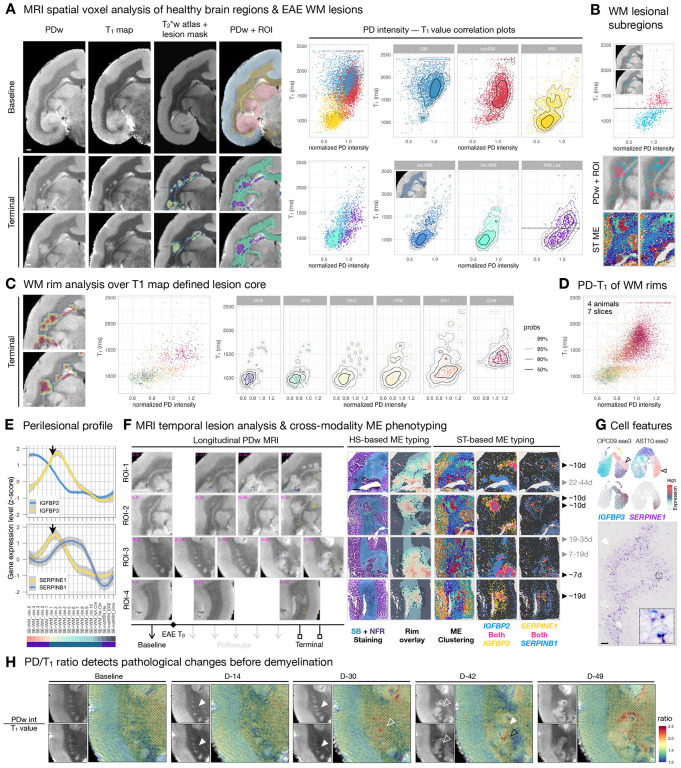
Single-time-point histopathological studies on postmortem multiple sclerosis (MS) tissue fail to capture lesion evolution dynamics, posing challenges for therapy development targeting development and repair of focal inflammatory demyelination. To close this gap, we studied experimental autoimmune encephalitis (EAE) in the common marmoset, the most faithful animal model of these processes. Using MRI-informed RNA profiling, we analyzed ~600,000 single-nucleus and ~55,000 spatial transcriptomes, comparing them against EAE inoculation status, longitudinal radiological signals, and histopathological features. We categorized 5 groups of microenvironments pertinent to neural function, immune and glial responses, tissue destruction and repair, and regulatory network at brain borders. Exploring perilesional microenvironment diversity, we uncovered central roles of EAE-associated astrocytes, oligodendrocyte precursor cells, and ependyma in lesion formation and resolution. We pinpointed imaging and molecular features capturing the pathological trajectory of WM, offering potential for assessing treatment outcomes using marmoset as a platform.


Conflict of interest statement

D.S.R. has received research funding from Abata and Sanofi, unrelated to the current study.

Figures

Fig1.
Fig1.. Marmoset experimental autoimmune encephalomyelitis (EAE) recapitulates the development and repair of multiple sclerosis-type white matter (WM) lesions and enables detailed mapping of spatiotemporal organization at the individual lesion level
(A) Experimental workflow for inducing EAE and preparing tissue samples for single-nucleus and spatial transcriptome analysis using the 10x Genomics platform. (B) Visual representation and quantification of lesion load in different WM tracts across 5 EAE animals. Higher lesion loads were observed in projection and commissural WM fibers, with the optic tract (opt) being particularly susceptible to demyelination. Refer to source data for the full list of abbreviations for WM tracts. (C) Line plots depict the changes in body weights and EAE clinical scores (range: 0–45) of the 5 EAE animals over time, measured using the expanded disability status scale developed specifically for marmosets (mEDSS). Subcategories of the mEDSS scores, such as vision and mobility, are summarized separately. (D) Overview of phenotypic characterization of a typical WM lesion (indicated by arrowheads) is presented, including proton density-weighted (PDw) magnetic resonance imaging (MRI), histological staining with Sudan black (SB) and nuclear fast red (NFR), spatial transcriptome profiling (gene number and selected markers), supervised anatomical indexing using an MRI atlas as reference, and unsupervised microenvironment (ME) classification with bioinformatic tools (spot and subspot level analysis). UMAP scatter plots summarizing a total of 55,026 spatial transcriptome spots were analyzed across 16 brain regions of interest (ROI) and colored based on transcriptome profile similarity (ME0–27) and spatial organization relative to demyelinated areas (lesion rim analysis). Refer to source data for the full list of abbreviations for brain regions. Scale bar = 1mm. (E) UMAP scatter plots illustrate level 1 (L1) and level 2 (L2) analyses of transcriptomes with single-nucleus resolution, color-coded by cell class identity or disease condition. Donut charts provide the relative proportions of cell classes in each disease group, including healthy (He) control, normal-appearing (NA) control, resolved (Re) lesion, gadolinium (Gd) positive lesion, T2-hyperintense (T2) MRI detected lesion, and abnormal (Ab) appearing tissue. In the L1 analysis, canonical cell-type markers were used to annotate central and peripheral immune cells (IMM), oligodendrocyte progenitor cells (OPC), oligodendrocytes (OLI), astrocytes (AST), vasculature and meningeal cells (VAS), and neurons (NEU). In the L2 analysis, the IMM cell class was further divided into microglia (MIC) and peripheral immune cells (P.IMM). Notably, as lesions developed, substantial cellular diversity was observed, particularly among glial and immune cells.
Fig2.
Fig2.. Spatially resolved pathways and cellular composition highlight the dynamics of in-situ and ex-situ tissue responses to pathological insults.
(A) UMAP scatter plots are color-coded by microenvironment (ME) clustering and gene group expression, including GM (ME14, 2, 6, 1, 3, 4, 7, 21, 15, 17), WM (ME26, 27, 5, 0, 16, 20, 11), T2 lesion (T2, ME23, 9, 10, 8, 13, 19), brain borders (BB, ME22, 25, 24), and repair (RP, ME12, 18). The direction of arrows indicates increased prevalence in EAE. (B) Heatmap summarizes the z-scored expression of genes that clearly segregate major cell classes (L1.map; color code in C). Up to 200 nuclei were sampled from each group across 133 subclusters (L2.map; color code in Fig3B). (C) Spatial heatmaps of a region of interest (ROI) with representative white matter lesions showing the averaged expression of gene sets listed in (A) for each cell class across BayesSpace-enhanced subspots. By comparing the expression score across tested gene sets, L1 cell types were inferred for each subspot based on profile similarity (See FigS4 and Methods for detail). The spatial distribution of assigned L1 labels was reconstituted and overlaid onto the ROI and largely agrees with the anatomical structures of the brain and expression pattern of the genes. A total of 330,156 subspots were quantified across 16 ROI. The relative proportion of cell classes are summarized in the donut chart. Scale bar = 1mm. (D) Circularized heatmap depicts the enrichment of genes and modules as a function of distance from the demyelinated (Sudan black negative, SB-) lesion core across 10x Visium spots pooled from 12 ROI with optimal contrast between SB and NFR staining (FigS4 and Methods). The “Color Deconvolution” for Samples 1–4 was unsuccessful due to suboptimal contrast between SB and NFR staining, resulting in their exclusion from the lesion subregion assignment in the rim analysis; however, they are included for ME clustering analysis. Gene names starting with “*” indicate human (hs) or mouse (mm) orthologs of marmoset gene identification numbers (See Table S9 for the full list). (E) Stacked column graph summarizes the relative proportion and distribution of classified ME as a function of distance from the SB-deprived lesion core across 10x Visium spots pooled from 12 ROI. (F) Stacked bar graphs summarize the relative proportion of L1 and L2 labels assigned to BayesSpace enhanced subspots across classified ME from 16 ROI (left). Stacked bar graph summarizes the relative proportion and distribution of L1 and L2 labels as a function of distance from the demyelinated lesion core across BayesSpace-enhanced subspots pooled from 12 ROI (right). The expression of gene sets used to infer L2 labels across subclusters are in FigS8A. hierarchical workflow was applied for L2 cell-type inference, which involved comparing the gene sets among subclusters within the same L1 cell class to assign an L2 cell type with the highest score. (G) Spatial distribution of assigned L2 labels is overlaid onto the ROI of a representative WM lesion. Spatial heatmaps of the ROI show the averaged expression of gene sets: L2_IMM.MoMϕ for monocytes and macrophages (TMEM150C, CD36), L2_IMM.BP for B cells and plasmablasts (OSBPL10, JCHAIN), L2_IMM.T for T cells (KLRK1, NCR3), L2_IMM.DC for dendritic cells (CIITA, CPVL), L2_VE.homeo for vascular endothelial cell (SMAD6, VEGFC), L2_OLI.eae for oligodendrocyte subtype (VAT1L, SERPINB1, IGFBP3), L2_OPC.eae for OPC subtypes (EVA1A, A2M, GLIS3), L2_AST.eae for astrocyte subtypes (TPM2, TNC, SLC39A14). Scale bar = 1mm.
Fig3.
Fig3.. Temporally resolved cellular composition and connectivity mapping illustrate the succession of glial and immune cells with pathologically altered interactivity.
(A) UMAP scatter plots display the L2 subclustering of white matter (WM) cell classes. The number of nuclei analyzed in each L2 UMAP plot is listed in parentheses. The relative distribution of homeostatic, cycling, and EAE-enriched glia are labeled. Abbreviations: Mono (monocytes), Mϕ (macrophages), DC (dendritic cells), B (B cells), T (T cells), Cyc (cycling cells), VE (vascular endothelial cells), VLMC (vascular leptomeningeal cells), Inh (inhibitory neurons), Ext (excitatory neurons), T2.Les (<45 days old), T2.Les* (~1000 days old), and Re.Les (prior T2-hyperintense signal that had resolved at the time of tissue collection) were grouped and analyzed. (B) Heatmap shows the z-scored number of nuclei for each subcluster across different WM pathological states. Two levels of color index are used for each subcluster to aid label tracking. L1.map coloring is consistent with labels of Cleveland dot plot in (E) and scatter plots in FigS10. L2.map coloring is consistent with UMAP plots in (A) and FigS7, 8, 9, 11. (C) Dot plots depict the change in nuclei proportion during the transition across WM pathological states. Squares show the relative enrichment of subclusters within each major cell class in each pair of pathological states. Significantly (false discovery rate, FDR < 0.05 & absolute fold change, abs(Log2FC > 0.25) enriched subclusters are colored accordingly. (D) Chord plots show the cumulative changes in interaction probability inferred by CellChat among major cell classes between control and EAE WM. The outer ring of the color bar represents the relative proportion of significant interactions employed by each cell class for each condition. The inner ring of the discontinuous color bars represents the relative proportion of signals sent to each cell class, and large arrows indicate signals received from each cell class. (E) Cleveland dot plots summarize the changes in outgoing (asterisk) and incoming (open circle) communications inferred by CellChat among subclusters of cells residing in WM of control (blue) and EAE (purple) animals. Three categories of interactions are quantified: secretes autocrine/paracrine signaling interactions (secreted–cell), cell-cell contact interactions (cell–cell), and extracellular matrix (ECM)-receptor interactions (ECM–cell). The level of signaling change for a matched subcluster pair between conditions is summarized as the bar length (light gray for outgoing and dark gray for incoming signals), and the alternating gray shaded columns distinguish major cell classes.
Fig4.
Fig4.. Comparative network analysis and spatial ligand-receptor mapping discover global changes in pathway signaling, uncover context-dependent interactions, and identify cellular links with microenvironmental significance.
(A) Stacked bar graphs summarize the profile of ligand-receptor (LR) pairs and signaling pathways that are shared by or unique to WM of control and EAE animals. (B) Dot plots summarize the differences in pathway profile or strength among subclusters residing in the WM of control and EAE animals. (C) Inferred parathyroid hormone (PTH) signaling between pericytes and neurons, confirmed by the detection of PTHLH (Parathyroid Hormone Like Hormone) in neurons and PTH1R (Parathyroid Hormone 1 Receptor) in pericytes. The signaling role of each network is calculated by CellChat and summarized in visNetwork. Legend applies to panels D–I. (D) Inferred LR pairs (SELL–PODXL) of the SELL (Selectin L) pathway between vasculature and immune cells in EAE animals. (E) Inferred LR pairs (HGF–MET) of the HGF (Hepatocyte Growth Factor) pathway between immune cells, oligodendrocytes, OPC, and astrocyte subtypes in EAE animals. (F) Inferred LR pairs (IL16–CD4) of IL16 (Interleukin 16) pathway between ependyma, plasmacytoid dendritic cells (pDC), and EAE enriched astrocyte subtype in EAE animals. (G) Inferred LR pairs (TNFSF8–TNFRSF8) of the CD30 (Tumor Necrosis Factor Receptor Superfamily Member 8) pathway between EAE enriched microglia and astrocyte subtypes in EAE animals. (H) Inferred LR pairs (ANGPTL2–ITGA5+IGAB1, ANGPTL2–TLR4) of the ANGPTL (Angiopoietin-like) pathway between multiple subclusters in WM of control and EAE animals. (I) Inferred LR pairs (DLL1–NOTCH2, DLL1–NOTCH3) of the NOTCH pathway between multiple subclusters in WM of EAE animals. (J) Pie charts summarize the proportion of subspots with detection of both ligands and receptors for each inferred pathway in panels C–I across classified ME. The ratio of subspots with targeted ligand overlapping completely with receptor and cofactors (if applicable) are colored in gray; if only one of the receptor components is involved, it colored accordingly.
Fig5.
Fig5.. MRI features distinguish lesion subregions, mark the trajectory of white matter (WM) pathology, and phenotype lesion microenvironments (ME) with temporal significance.
(A) Left: To identify MRI features that could inform lesion dynamics, proton density-weighted (PDw) images and T1 maps acquired in the same imaging session were registered to a T2*w MRI atlas at baseline and terminal time points. The lesion masks were created by subtracting the normalized baseline intensity value from the terminal PDw image and then overlaid onto the registered T2*w MRI atlas (FigS4 and Methods). The regions of interest (ROI) consist of atlas-annotated anatomical structures and lesion subregions, which were used to group and color-code each voxel and then overlaid onto PDw images for visualization. Scale bar = 1mm. Right: Scatter plots with density contours (legend in (C)) show the correlation of PDw intensity and T1 value (PD-T1) for each voxel across ROI, as indicated on overlaid PDw images. As expected, cortical gray matter (GM) and subcortical gray matter (subGM) have higher T1 value (longer longitudinal relaxation time) than WM. The normal appearing WM (NA.WM) and WM lesion (WM.Les) areas from the terminal PDw image (bottom) are compared against the equivalent areas (He.WM) at baseline (demonstrated in the inset). The PD-T1 distribution of NA.WM largely agrees with He.WM, but there is a horizontal shift in PDw intensity and a vertical split in T1 values (T1 = 1250, annotated by a horizontal dashed line) into two populations for WM.Les. (B) Top: A cutoff T1 value of 1250 ms (horizontal dashed line) was applied to WM.Les voxels, which are color-coded accordingly on the scatter plot and the overlaid PDw image (inset). Bottom: The subregional structure of PD-T1 values resembles that identified by spatial transcriptome ME clustering. Voxels with high T1 values typically reside at the lesion core, whereas voxels with low T1 values primarily populate the lesion edge. (C) 5 concentric rims, outward from the PD-T1 defined lesion core, color WM subregions on the PDw image and scatter plots. The PD-T1 distribution of the rim5 area (750 μm away from the lesion core) is similar to that of He.WM, while PDw values gradually increase as voxels approach the lesion core. Scale bar = 1mm. (D) Scatter plot summarizes the PD-T1 distribution of WM rims across 7 EAE brain slices from 4 animals, uncovering a similar WM pathological trajectory to that shown in (C). (E) Line plots summarize the relative abundance of IGFBP2, IGFBP3, SERPINE1, and SERPINB1 expression as a function of distance from the demyelinated (Sudan black (SB) negative) lesion core. Black arrows pointed to the intersection of SB+ and SB areas. (F) Relative expression profile of IGFBP and SERPIN families differentiate lesions by age. Left: Snapshots of PDw images across time in 4 representative ROI from 3 animals. Days (D) post EAE induction (T0) are labeled in magenta for each ROI, and lesion age is estimated retrospectively from the serial MRI. The appearance of each lesion is annotated by an arrowhead, and different arrowhead colors are used to track different lesions. Right: The MRI-matching ROI were further imaged through the scope of histological staining (HS) and spatial transcriptome (ST) to subdivide brain regions into ME. The relative abundance is binarized by filtering the gene expression of the IGFBP (z-score >1) and SERPIN (z-score > 0.5) family, such that spots below the cutoff are colored dark gray. Scale bar = 1 mm. (G) Top: UMAP plots of OPC and AST colored by L2 subcluster and gene expression. Lesion edge-enriched genes, such as IGFBP3 and SERPINE1, are highly expressed by subtypes of OPC and AST, respectively. Bottom: Immunohistochemical staining of IGFBP3 (blue) and SERPINE1 (purple) in a midcoronal section of the marmoset brain with enlarged area in 50 × 50 μm2 box. High IGFBP3 and SERPINE1 labeling are in close proximity to a dilated blood vessel (open arrowhead) and are distant from a flattened blood vessel (solid arrowhead). Scale bar = 100 μm. (H) PDw MRI and T1 map images from baseline (before EAE induction) and 4 follow-up time points after EAE induction. Normalized PDw intensities and T1 values were extracted, and the PD/T1 ratio was calculated and overlaid onto the T1 map as heatmaps. Open arrowheads indicate MRI-identifiable tissue changes, solid arrowheads indicate normal-appearing brain area. White arrowheads point to a similar brain area across time and imaging contrasts, and the black arrowhead point to a different brain area with high PD/T1 ratio.

References

    1. Kuhlmann T, Moccia M, Coetzee T, Cohen JA, Correale J, Graves J, et al. Multiple sclerosis progression: time for a new mechanism-driven framework. Lancet Neurol. 2023. Jan;22(1):78–88. - PMC - PubMed
    1. McGinley MP, Goldschmidt CH, Rae-Grant AD. Diagnosis and Treatment of Multiple Sclerosis: A Review. JAMA. 2021. Feb 23;325(8):765–79. - PubMed
    1. Kametani Y, Shiina T, Suzuki R, Sasaki E, Habu S. Comparative immunity of antigen recognition, differentiation, and other functional molecules: similarities and differences among common marmosets, humans, and mice. Exp Anim. 2018. Jul 30;67(3):301–12. - PMC - PubMed
    1. ‘t Hart BA. Experimental autoimmune encephalomyelitis in the common marmoset: a translationally relevant model for the cause and course of multiple sclerosis. Primate Biol. 2019. May 10;6(1):17–58. - PMC - PubMed
    1. Wattjes MP, Ciccarelli O, Reich DS, Banwell B, de Stefano N, Enzinger C, et al. 2021 MAGNIMS-CMSC-NAIMS consensus recommendations on the use of MRI in patients with multiple sclerosis. Lancet Neurol. 2021. Aug;20(8):653–70. - PubMed

Publication types