[Preprint]. 2023 Sep 29:2023.09.29.560141.
doi: 10.1101/2023.09.29.560141.

Altered chromatin occupancy of patient-associated H4 mutants misregulate neuronal differentiation

Affiliations

Altered chromatin occupancy of patient-associated H4 mutants misregulate neuronal differentiation

Lijuan Feng et al. bioRxiv. .

Abstract

Chromatin is a crucial regulator of gene expression and tightly controls development across species. Mutations in only one copy of multiple histone genes were identified in children with developmental disorders characterized by microcephaly, but their mechanistic roles in development remain unclear. Here we focus on dominant mutations affecting histone H4 lysine 91. These H4K91 mutants form aberrant nuclear puncta at specific heterochromatin regions. Mechanistically, H4K91 mutants demonstrate enhanced binding to the histone variant H3.3, and ablation of H3.3 or the H3.3-specific chaperone DAXX diminishes the mutant localization to chromatin. Our functional studies demonstrate that H4K91 mutant expression increases chromatin accessibility, alters developmental gene expression through accelerating pro-neural differentiation, and causes reduced mouse brain size in vivo, reminiscent of the microcephaly phenotypes of patients. Together, our studies unveil a distinct molecular pathogenic mechanism from other known histone mutants, where H4K91 mutants misregulate cell fate during development through abnormal genomic localization.

Keywords: aberrant nuclear puncta; abnormal genomic localization; developmental disorders; heterochromatin; histone H3 variant H3.3; microcephaly; neural differentiation.


Conflict of interest statement

Declaration of Interests The authors declare no competing interests.

Figures
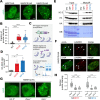
Figure 1:
Figure 1:. H4K91 mutants enhance association with the histone variant H3.3 and form distinct nuclear puncta.
(A) Both H4K91 mutants display a puncta pattern. Immunofluorescence images of mESCs that express HA-tagged H4WT or H4K91 mutants (K91R or K91Q) with HA antibody. Images are Z-stack projections. Scale bar: 2μm. (B) Quantification of in-puncta fluorescence intensity in the nucleus. Fluorescence intensity within the puncta is divided by the whole nucleus intensity and displayed as a box plot. The box plot shows all data points with the median, and the boundaries indicate the 25th and the 75th percentiles. Each dot represents one cell. Statistical significance was calculated using an unpaired t-test. **** p<0.0001. (C) Schematic of mononucleosome IP method. Chromatin from 293T cells expressing WT or H4K91 mutants are first subject to MNase digestion. Then, mononucleosomes containing HA-tagged H4WT or H4K91 mutants are pulled down with HA antibody and analyzed by mass spectrometry (MS) analysis or western blot (WB). (D) H4K91 mutants display increased binding with the histone variant H3.3. A plot of the H3.3/H3 ratio based on MS analysis of the pulled-down nucleosomes. Three independent replicates were done. Error bars represent mean ± s.e.m, and statistical significance was calculated using an unpaired t-test. * p<0.05, ** p<0.005. (E) WB of the pulled-down mononucleosomes with the following antibodies: HA, H3.3 specific antibody, and H3 (which recognizes both canonical histone H3 and variant H3.3). (F) H4K91 mutant cells staining with the H3.3-specific chaperones DAXX and ATRX. Immunofluorescence images of mESCs expressing a HA-tagged H4K91 mutant. The following antibodies were used: HA, DAXX, and ATRX. Arrowheads indicate colocalization. A single Z stack image is shown. Scale bar: 2μm. (G) Immunofluorescence images of H3.3−/−, DAXX −/− and Hira−/− mESCs that express HA-tagged H4K91Q. Scale bar: 2μm. (H) Quantification of in-puncta HA fluorescence intensity in different mESCs. Each dot represents one cell. Statistical significance was calculated using an unpaired t-test. * p<0.05. **** p<0.0001. See also Figure S1.
Figure 2:
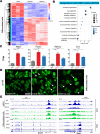
Figure 2:. H4K91 mutants are recruited to H3.3 and H3K9me3 enriched heterochromatin regions.
(A) Heatmap representation of histone H4 bound chromatin peaks that have increased occupancy by H4K91 mutants (H4K91R and H4K91Q) compared to H4WT in mESCs (Table S1). After removing peaks in cells expressing empty vector (EV), peaks from H4WT, H4K91R, and H4K91Q expressing cells were clustered based on the HA signal. The cluster containing H4K91 mutant enriched peaks is shown, together with the ChIP-seq signal of histone H3 variant H3.3 and H3K9me3. These regions represent ± 2kb from the center of the H4 peaks. The color scheme represents the ChIP-seq signal density with darker indicating increased signals. (B) Correlation of H4WT or H4K91 mutant ChIP-seq signal with H3.3 (left) and H3K9me3 (right) ChIP-seq signal within H4 peak regions in mESCs. Input normalized ChIP-seq signal within bins that comprise regions ±−1kb around the center of H4 peaks (union of H4WT, H4K91R, and H4K91Q) was used for this Pearson’s correlation coefficient (PCC) analysis, and PCC values are shown to the right of each figure. (C) Genome browser representative tracks of HA, H3.3, and H3K9me3 ChIP–seq signals at selected H4 mutant target genes in mESCs. (D) Heatmap of H4K91 mutant enriched peaks in Parental, H3.3−/−, DAXX−/−, and Hira −/− mESCs expressing H4K91R-HA or H4K91Q-HA. See also Figure S2, S3 and Table S1.
Figure 3:
Figure 3:. H4K91 mutants affect mouse brain development.
(A) Left: Representative images of pups and brains of H4WT and H4K91 mutant isogenic mice at P0, which were generated through tetraploid complementation. Right: Quantification of body and brain weight. Box plots show mean ± s.e.m., and p-values are calculated by unpaired t-test. * p<0.05 (B) Representative immunofluorescence staining of mouse brain cerebral cortex with HA and DAPI. H4K91R shows puncta (arrowheads) pattern, which is also in DAPI bright regions. Scale bar: 10μm. (C) In situ hybridization of mice brain cerebral cortex with probes targeting transcripts of intermediate progenitor marker gene Tbr2 (green) and post-mitotic neuron marker Satb2 (red). Tbr2-positive intermediate progenitor cells localize in the subvertical zone (SVZ) of the cortex, while Satb2-positive post-mitotic neurons are in the upper layer of the cortex (II-IV). The full cortex is indicated by black arrows. Scale bar: 100μm. (D) Quantification of the relative thickness of Tbr2 and Satb2 positive layers (thickness of Tbr2/Satb2 layer divided by the thickness of the whole cortex). 8 different section regions are quantified for each mouse (n=2 H4WT-HA and n=3 H4K91R-HA). The box plot shows all data points with the median, and the boundaries indicate the 25th percentile and 75th percentiles. **** p<0.0001. p-values are calculated by unpaired t-test.
Figure 4:
Figure 4:. H4K91 mutants accelerate neural differentiation and alter gene expression.
(A) Clustered heatmap representation of genes that are differentially expressed (with a fold change of 2 or more, and p<0.05) in neural cells after four days of differentiation that express WT or mutant H4. The color indicates the z-score of expression values for each gene. (B) Gene Ontology (GO) analysis of the upregulated cluster of genes (from Figure 4A) that are common to K91R and K91Q in differentiated neural cells (n=1240 genes; Table S2). (C) Visualization of mRNA expression of several mature neuron genes at four-day neural differentiation. The data represents mean ± s.e.m from three independent replicates. Statistical significance was calculated using an unpaired t-test. ** p<0.01. *** p<0.001. (D) Representative immunofluorescence images of four-day differentiated neural cells stained with HA antibody. Arrowhead labels point to cells with puncta patterns of H4K91 mutants. Scale bar: 20μm. (E) Genome browser representation of HA ChIP–seq signals for H4 in mESCs and differentiated cells, as well as the representative RNA-seq tracks at selected imprinted genes in differentiated cells. See also Figure S4 and Table S2.

References

    1. Bjornsson H. T. The Mendelian disorders of the epigenetic machinery. Genome Research vol. 25 Preprint at 10.1101/gr.190629.115 (2015). - DOI - PMC - PubMed
    1. Flavahan W. A., Gaskell E. & Bernstein B. E. Epigenetic plasticity and the hallmarks of cancer. Science vol. 357 Preprint at 10.1126/science.aal2380 (2017). - DOI - PMC - PubMed
    1. Behjati S. et al. Distinct H3F3A and H3F3B driver mutations define chondroblastoma and giant cell tumor of bone. Nat Genet 45, 1479–1482 (2013). - PMC - PubMed
    1. Khuong-Quang D.-A. et al. K27M mutation in histone H3.3 defines clinically and biologically distinct subgroups of pediatric diffuse intrinsic pontine gliomas. Acta Neuropathol 124, 439–447 (2012). - PMC - PubMed
    1. Schwartzentruber J. et al. Driver mutations in histone H3.3 and chromatin remodelling genes in paediatric glioblastoma. Nature 482, 226–231 (2012). - PubMed

Publication types