[Preprint]. 2024 Mar 5:2023.09.22.23295983.
doi: 10.1101/2023.09.22.23295983.

Modeling the Transmission Mitigation Impact of Testing for Infectious Diseases

Affiliations

Modeling the Transmission Mitigation Impact of Testing for Infectious Diseases

Casey Middleton et al. medRxiv. .

Update in

Abstract

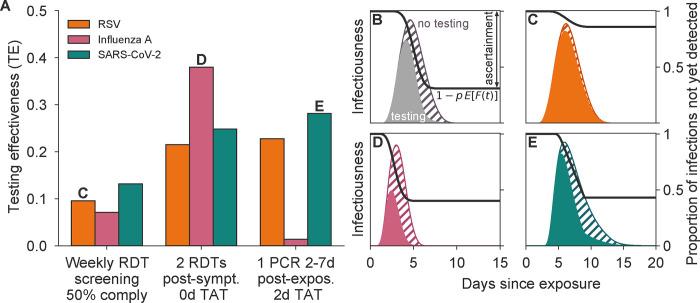
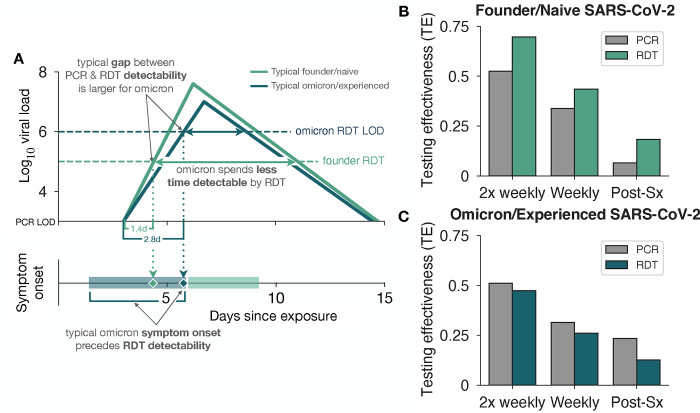
A fundamental question of any program focused on the testing and timely diagnosis of a communicable disease is its effectiveness in reducing transmission. Here, we introduce testing effectiveness (TE)-the fraction by which testing and post-diagnosis isolation reduce transmission at the population scale-and a model that incorporates test specifications and usage, within-host pathogen dynamics, and human behaviors to estimate TE. Using TE to guide recommendations, we show that today's rapid diagnostics should be used immediately upon symptom onset to control influenza A and respiratory syncytial virus (RSV), but delayed by up to 2d to control omicron-era SARS-CoV-2. Furthermore, while rapid tests are superior to RT-qPCR for control of founder-strain SARS-CoV-2, omicron-era changes in viral kinetics and rapid test sensitivity cause a reversal, with higher TE for RT-qPCR despite longer turnaround times. Finally, we illustrate the model's flexibility by quantifying tradeoffs in the use of post-diagnosis testing to shorten isolation times.


Conflict of interest statement

Competing Interests D.B.L. is a member of the scientific advisory board of Darwin BioSciences and discloses past consulting for Flambeau RapidX. The authors declare no other competing interests.

Figures

Figure 1:
Figure 1:. Model diagram.
(A) Each realization of the stochastic testing model first draws four control points to specify a piecewise linear model of pathogen load on a logarithmic scale (filled pink circles) and a symptom onset time (tSx, open pink circle). The realization then draws a set of testing times (open blue squares), which may be triggered by symptoms (pink arrow), triggered by a known exposure (not shown), or ongoing at a particular cadence (not shown). A test taken during the detectable window (blue bar) when pathogen load exceeds the test’s limit of detection (LOD, gray line) will return a positive diagnosis with a fixed probability after a specified turnaround time (not shown). However, not all tests are necessarily taken, due to imperfect compliance (not shown). Diagnosis at time tDx leads to isolation and thus reduced infectiousness (grey). (B) The ensemble mean, whether computed through integrals or estimated via Monte Carlo, produces expected infectiousness curves with and without testing. The areas under these curves are proportional to their respective reproductive numbers, enabling estimation of testing effectiveness TE (see Eq. (1)). The model also computes the proportion of individuals who remain undiagnosed at time t (blue curve), a curve which approaches zero as ascertainment approaches 100%.
Figure 2:
Figure 2:. Testing effectiveness varies considerably by strategy and pathogen.
(A) Testing effectiveness is shown for RSV (orange), influenza A (pink), and SARS-CoV-2 omicron in experienced hosts (green) under three testing programs: (1) weekly rapid diagnostic test (RDT) screening with 50% compliance, (2) testing with one RDT per day for two days starting at symptom onset, and (3) one RT-qPCR test administered 2–7d after exposure, with 75% participation and 2d test turnaround time (TAT). Panels C-E depict population-level infectiousness curves without (hatched) and with (filled) testing and isolation for the labeled pathogen and testing program, and panel B provides annotations for an example simulation. Black curves represent the proportion of infections not yet detected by time t. See Figure S1 for scenario ascertainment rates and Figure S2 for population-level infectiousness curves for all testing scenarios.
Figure 3:
Figure 3:. Relative timing of symptom onset, infectiousness, and detectability vary by pathogen and individual.
Symptom onset time (open circles), infectious period (shaded rectangles), and window of detectability by a rapid diagnostic test (RDT, colored lines) are shown for 15 stochastic realizations of RSV (A, orange), influenza A (B, pink), and SARS-CoV-2 omicron/experienced (C, green) infections. The absence of an open circle indicates an asymptomatic infection. See Supplementary Table S1 for parameters and references.
Figure 4:
Figure 4:. Optimal use of tests depends on the number of tests available and when they are used.
Testing effectiveness (TE) of rapid test (RDT) and RT-qPCR with 2 day turnaround time, used x days after symptom (Sx) onset using y tests once per day is shown for RSV (A, orange), influenza A (B, pink), and SARS-CoV-2 omicron in experienced hosts (C, green). Darker colors represent higher TE as indicated. In each row, the testing strategy with highest TE is annotated with a white star. Turnaround times: rapid tests, TAT = 0; RT-qPCR TAT = 2. See Supplementary Table S1 for LODs and Figures S4 and S5 for monochromatic TE and ascertainment visualizations, respectively.
Figure 5:
Figure 5:. RT-qPCR vs RDT tradeoffs for the SARS-CoV-2 omicron era.
(A) Typical viral kinetics for founder SARS-CoV-2 strains in naive hosts and SARS-CoV-2 omicron variants in experienced hosts (log10 cp mRNA / mL). Trajectories are characterized above the RT-qPCR limit of detection (LOD = 103) with their respective rapid diagnostic test (RDT) LODs indicated by horizontal dashed lines (105 and 106 for founder strain and omicron variant, respectively). Individuals are considered infectious when the viral load exceeds 105.5 cp mRNA / mL. Potential symptom onset times for each trajectory are shaded on the lower axis. (B,C) Testing effectiveness using RT-qPCR with 2 day turnaround time (gray) or RDT with immediate delivery of results (green) for twice weekly and weekly screening, or testing immediately upon symptom (Sx) onset using one test.
Figure 6:
Figure 6:. Fixed isolation recommendations may lead to unnecessary isolation when symptomatic testing ascertainment is high.
(A) Testing effectiveness, (B) total test consumption over diagnosis and test-to-exit (TTE) usage, and (C) average isolation duration for detected individuals are shown for a fixed 5d isolation period (dark blue) and a test-to-exit isolation program requiring one negative rapid diagnostic test to exit isolation (light green) when 1 or 2 tests were available to diagnose (Dx), used daily beginning one day after symptom onset for SARS-CoV-2 omicron variants in experienced hosts. (D) The distribution of individual days spent in isolation for a test-to-exit scheme using 2 tests to diagnose, with the average isolation time indicated by the vertical dashed line. TTE scenarios assumed individuals waited 2 days after diagnosis before beginning exit-testing.

Similar articles

References

    1. McGarry Brian E, Gandhi Ashvin D, and Barnett Michael L. COVID-19 surveillance testing and resident outcomes in nursing homes. New England Journal of Medicine, 388(12):1101–1110, 2023. - PMC - PubMed
    1. Ranoa Diana Rose E, Holland Robin L, Alnaji Fadi G, Green Kelsie J, Wang Leyi, Fredrickson Richard L, Wang Tong, Wong George N, Uelmen Johnny, Maslov Sergei, et al. Mitigation of SARS-CoV-2 transmission at a large public university. Nature Communications, 13(1):3207, 2022. - PMC - PubMed
    1. Pavelka Martin, Kevin Van-Zandvoort Sam Abbott, Sherratt Katharine, Majdan Marek, CMMID COVID-19 working group, Inštitút Zdravotných Analýz, Pavol Jarčuška, Marek Krajčí, Stefan Flasche, and Sebastian Funk. The impact of population-wide rapid antigen testing on SARS-CoV-2 prevalence in Slovakia. Science, 372(6542):635–641, 2021. - PMC - PubMed
    1. Bernstein David I, Mejias Asuncion, Rath Barbara, Woods Christopher W, and Deeter Jamie Phillips. Summarizing study characteristics and diagnostic performance of commercially available tests for respiratory syncytial virus: A scoping literature review in the COVID-19 era. The Journal of Applied Laboratory Medicine, 8(2):353–371, 2023. - PMC - PubMed
    1. Merckx Joanna, Wali Rehab, Schiller Ian, Caya Chelsea, Gore Genevieve C, Chartrand Caroline, Dendukuri Nandini, and Papenburg Jesse. Diagnostic accuracy of novel and traditional rapid tests for influenza infection compared with reverse transcriptase polymerase chain reaction: a systematic review and meta-analysis. Annals of Internal Medicine, 167(6):394–409, 2017. - PubMed

Publication types