[Preprint]. 2023 Sep 28:2023.09.28.559973.
doi: 10.1101/2023.09.28.559973.

Targeting EIF4A triggers an interferon response to synergize with chemotherapy and suppress triple-negative breast cancer

Affiliations

Targeting EIF4A triggers an interferon response to synergize with chemotherapy and suppress triple-negative breast cancer

Na Zhao et al. bioRxiv. .

Update in

Abstract

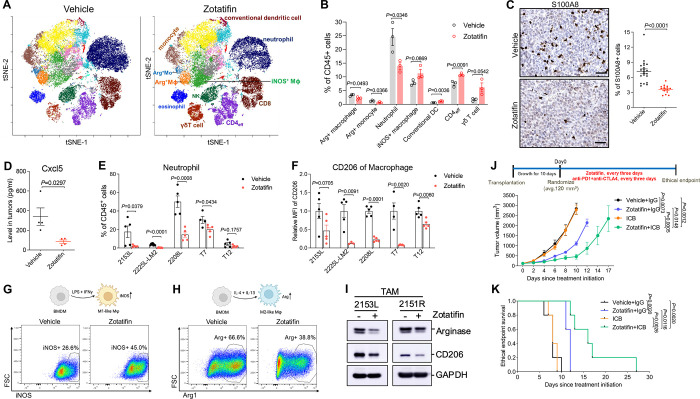
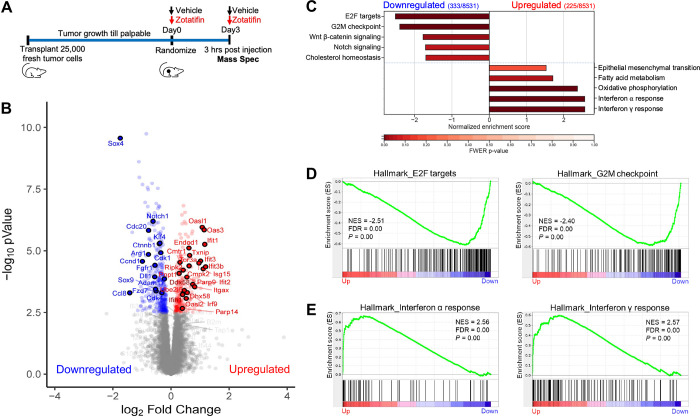
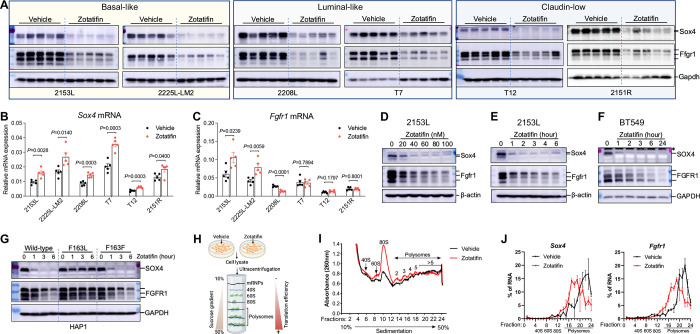
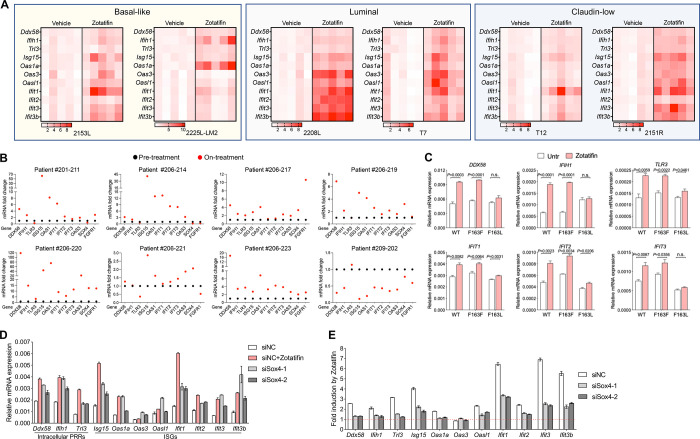
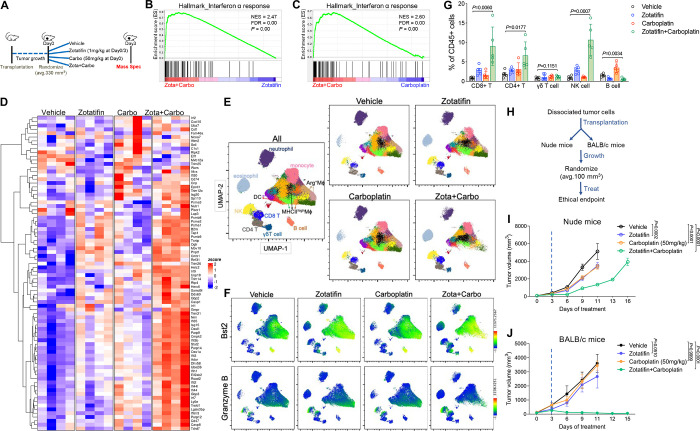
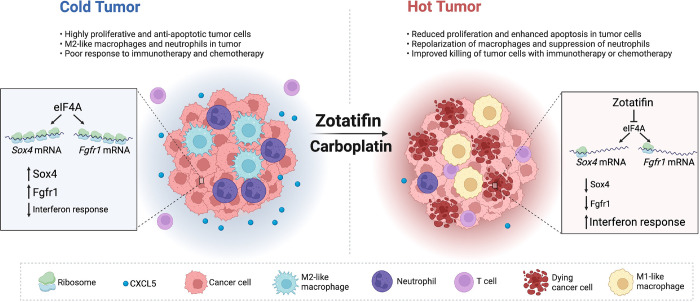
Protein synthesis is frequently dysregulated in cancer and selective inhibition of mRNA translation represents an attractive cancer therapy. Here, we show that therapeutically targeting the RNA helicase eIF4A by Zotatifin, the first-in-class eIF4A inhibitor, exerts pleiotropic effects on both tumor cells and the tumor immune microenvironment in a diverse cohort of syngeneic triple-negative breast cancer (TNBC) mouse models. Zotatifin not only suppresses tumor cell proliferation but also directly repolarizes macrophages towards an M1-like phenotype and inhibits neutrophil infiltration, which sensitizes tumors to immune checkpoint blockade. Mechanistic studies revealed that Zotatifin reprograms the tumor translational landscape, inhibits the translation of Sox4 and Fgfr1, and induces an interferon response uniformly across models. The induction of an interferon response is partially due to the inhibition of Sox4 translation by Zotatifin. A similar induction of interferon-stimulated genes was observed in breast cancer patient biopsies following Zotatifin treatment. Surprisingly, Zotatifin significantly synergizes with carboplatin to trigger DNA damage and an even heightened interferon response resulting in T cell-dependent tumor suppression. These studies identified a vulnerability of eIF4A in TNBC, potential pharmacodynamic biomarkers for Zotatifin, and provide a rationale for new combination regimens comprising Zotatifin and chemotherapy or immunotherapy as treatments for TNBC.


Conflict of interest statement

Competing interests: J.M.R. received research support from eFFECTOR therapeutics. C.M.P. is an equity stockholder and consultant of BioClassifier LLC; C.M.P. is also listed as an inventor on patent applications for the Breast PAM50 Subtyping assay.

Figures

Figure 1.
Figure 1.
Zotatifin monotherapy inhibits tumor growth in a cohort of Trp53-null preclinical models. A, Scheme depicting the generation of syngeneic Trp53-null preclinical models. Donor mammary epithelium from Trp53-null BALB/c mice was transplanted in situ into cleared mammary fat pad of wild-type recipient hosts, resulting in the derivation of heterogeneous Trp53-null transplantable mammary tumors representative of the different intrinsic molecular subtypes of human breast cancer. B, Top, representative images of H&E staining and IHC staining of F4/80 and S100A8 in Trp53-null models used in this study. Scale bar, 50 μm. Bottom, quantification of IHC staining. Three to six representative 20X images were analyzed for each tumor. C, Schematic of animal treatment. Freshly dissociated tumor cells were injected into the 4th mammary fat pad of BALB/c mice. Mice were randomized and treatment was initiated when tumors reach 70~150 mm3 volume. Mice were treated with either vehicle or Zotatifin every three days until ethical endpoint. D, Tumor growth curves of BALB/c mice treated with either vehicle or Zotatifin. n=6 biological replicates for 2225L-LM2 and n=5 for all other models in each treatment arm. Data are presented as mean ± SEM and analyzed using two-way ANOVA with Bonferroni’s multiple comparison test. E, Left, representative images of IHC staining of BrdU in ethical endpoint 2153L tumor tissues. Scale bar, 50 μm. Right, quantification of IHC staining. Five representative 20X images were analyzed for each tumor. n=5 biological replicates. Data are presented as mean ± SEM and analyzed using two-tailed unpaired Student’s t-test. F, Left, representative images of cell cycle distribution of 2153L cells that were cultured in complete medium and treated with vehicle or 40 nM Zotatifin for 48 hrs. Right, quantification of the cell cycle phases from three independent experiments. Data are presented as mean ± SD and analyzed using two-tailed unpaired Student’s t-test.
Figure 2.
Figure 2.
Zotatifin monotherapy alters the tumor immune microenvironment and sensitizes tumors to immune checkpoint blockade. A, The t-distributed stochastic neighbor embedding (t-SNE) projection of tumor-infiltrating immune cells of 2153L tumors that were treated with vehicle or Zotatifin for 7 days and analyzed using mass cytometry. Data from three biological replicates of each group were concatenated before t-SNE and FlowSOM clustering analysis. Equal numbers of events are shown for each group and major cell types are marked. B, Quantification of major immune cell populations in 2153L tumors that were treated with vehicle or Zotatifin and analyzed using mass cytometry. n=3 biological replicates per group. C, Left, representative images of IHC staining of S100A8 in 2153L tumors treated with vehicle or Zotatifin till ethical endpoint. Scale bar, 50 μm. Right, quantification of IHC staining. Three to six representative 20X images were analyzed for each tumor. n=5 biological replicates per group. D, Luminex array detection of Cxcl5 levels in lysates of 2153L tumors that were treated with vehicle or Zotatifin for 3 days. n=4 biological replicates per group. E, Flow cytometry analysis of tumor-infiltrating neutrophils in ethical endpoint tumors. F, Flow cytometry analysis of CD206 median fluorescence intensity (MFI) in tumor-infiltrating macrophages in ethical endpoint tumors. In E and F, n≥4 biological replicates per group in all models. In B to F, data are presented as mean ± SEM and analyzed using two-tailed unpaired Student’s t-test. G, Flow cytometry analysis of iNOS expression in BMDMs that were treated with vehicle or Zotatifin in the presence of LPS and IFNγ. H, Flow cytometry analysis of Arginase expression in BMDMs that were treated with vehicle or Zotatifin in the presence of IL-4 and IL-13. I, Immunoblotting analysis of TAMs that were separated from treatment naïve 2153L and 2151R tumors and treated with vehicle or 40 nM Zotatifin for 24 hrs in vitro. J, Top, treatment scheme of BALB/c mice. Bottom, growth curves of 2153L tumors treated with indicated drugs. n=5 biological replicates per group. Data are presented as mean ± SEM and analyzed using two-way ANOVA with Tukey’s multiple comparison test. K, Kaplan-Meier survival curves of 2153L tumor-bearing mice from treatment start time. The log-rank test (two-tailed) was used to test for the significant differences of curves between groups. n=5 biological replicates per group.
Figure 3.
Figure 3.
Zotatifin remodels the proteomic landscape of 2153L tumors. A, Scheme of sample collection strategy for mass spectrometry. Freshly dissociated 2153L tumor cells were transplanted into the 4th mammary fat pad of BALB/c mice and were allowed to grow until palpable. Mice then were randomized and treated with either vehicle or Zotatifin for two doses spanning 3 days. Tumor tissues were collected 3 hrs after the second injection. B, Volcano plot showing relative fold change (log2) in protein abundance versus −log10(P values) from 2153L tumors treated with Zotatifin compared with vehicle. Proteins that demonstrate a significant change in expression (FDR q<0.05) are colored, with decreased expression on the left in blue and increased expression on the right in red. Genes that are critically involved in cell proliferation, stem cell signaling, and interferon response pathways are labeled. n=4 biological replicates per arm. Statistical significance was determined by two-tailed unpaired moderated t-test. C, GSEA of mass spectrometry results was performed with the MSigDB hallmarks dataset and is summarized as the normalized enrichment score (NES) in vehicle or Zotatifin treated 2153L tumor tissues. Top pathways that have a familywise error rate (FWER) P<0.25 are displayed. FWER P values for each pathway are denoted by color. D, GSEA enrichment plots for Hallmark E2F targets and G2M checkpoint signatures that are downregulated in Zotatifin treated tumors compared with vehicle. NES, normalized enrichment score. E, GSEA enrichment plots for Hallmark interferon α response and interferon γ response signatures that are upregulated in Zotatifin treated tumors compared with vehicle.
Figure 4.
Figure 4.
Zotatifin inhibits the translation of Sox4 and Fgfr1 mRNAs. A, Immunoblotting analysis of tumors that were treated with vehicle or Zotatifin in vivo. n = 5 biological replicates per group. B and C, QPCR analysis for Sox4 (B) and Fgfr1 (C) mRNA expression in tumors that were treated with vehicle or Zotatifin in vivo. Data are presented as mean ± SEM and analyzed using two-tailed unpaired Student’s t-test. n=5 biological replicates per group. D, Immunoblotting analysis of 2153L cells that were treated with different concentrations of Zotatifin for 6 hrs in vitro. E, Immunoblotting analysis of 2153L cells that were treated with 40 nM Zotatifin for different time periods. F, Immunoblotting analysis of BT549 cells that were treated with 40 nM Zotatifin for different time periods. * denotes a non-specific band. In D-F, data are representative of three independent experiments. G, Immunoblotting analysis of HAP1 cells that were treated with 40 nM Zotatifin in vitro. Data are representative of two independent experiments. H, Illustration for polysome profiling analysis. I and J, Polysome profiling of 2153L cells that were treated with vehicle or 40 nM Zotatifin for 2 hrs. I, Representative polysome profiles from three biological replicates. J, Distribution of Sox4 and Fgfr1 mRNAs across the different fractions. Data are presented as mean ± SEM of three biological replicates.
Figure 5.
Figure 5.
Inhibition of Sox4 translation contributes to Zotatifin-induced interferon response. A, QPCR analysis of tumors that were treated with vehicle or Zotatifin in vivo. The mean mRNA levels of the vehicle groups were set as 1 and fold changes were calculated for each gene. n=5 biological replicates per group. B, QPCR analysis of 8 paired biopsies from pre-treatment (black) and on Zotatifin treatment (red) ER+ breast cancer patients. The mRNA levels of pre-treatment samples were set as 1 and fold changes were calculated for each paired sample. C, QPCR analysis of HAP1 cells that were treated with 40 nM Zotatifin for 6 hrs. Data are representative of two independent experiments and are presented as mean ± SD of technical triplicates. D, QPCR analysis of 2153L cells that were transfected with negative control siRNA with or without Zotatifin treatment, or Sox4 siRNAs without Zotatifin treatment for 48 hrs. E, QPCR analysis of Zotatifin-induced gene fold changes in 2153L cells that were transfected with negative control siRNA or Sox4 siRNAs in the presence of vehicle or Zotatifin. In D and E, representative data from three biological replicates were shown, and data are presented as mean ± SD of technical duplicates.
Figure 6.
Figure 6.
Zotatifin synergizes with carboplatin to suppress tumor progression. A, Kaplan-Meier survival curves of 2153L tumor-bearing mice from treatment start time. B, Survival regression analysis of 2153L tumor-bearing mice. Survival data are fitted using a parametric survival regression model with a log-normal distribution. Top table reports all possible pairwise comparisons using linear contrasts that are adjusted for multiple comparisons using the Holms method. Bottom table tests for overall main effects and interactions. In A-B, data from 3 to 5 independent experimental batches are integrated. n=24 for Vehicle, n=22 for Zotatifin, n=13 for Carboplatin, and n=24 for Zotatifin+Carboplatin. C and D, Kaplan-Meier survival curves of 2225L-LM2 (C) or 2208L (D) tumor-bearing mice from treatment start time. Mice were randomized and treatment was initiated when 2225L-LM2 tumors reach ~130 mm3 volume or 2208L tumors reach ~210 mm3 volume. n=5 biological replicates per group. E, Left, representative images of IF staining of γH2A.X (in red) in 2153L tumors that were treated with indicated drugs for 3 days. Scale bar, 50 μm. Right, quantification of IF staining. At least 2 representative views were analyzed for each tumor and at least 3 tumors for each treatment group were analyzed. Data are presented as mean ± SEM and analyzed using two-tailed unpaired Student’s t-test. F, Kaplan-Meier survival curves of 2153L tumor-bearing mice treated with indicated drugs. n≥4 biological replicates per group. G, Kaplan-Meier survival curves of 2225L-LM2 tumor-bearing mice treated with indicated drugs. n≥3 biological replicates per group. H, Kaplan-Meier survival curves of 2208L tumor-bearing mice treated with indicated drugs. n=4 biological replicates per group. In C, D, and F-H, the log-rank test (two-tailed) was used to test for the significant differences of curves between groups.
Figure 7.
Figure 7.
Zotatifin synergizes with carboplatin to induce an interferon response and promote T cell-dependent tumor inhibition. A, Scheme of sample collection strategy for mass spectrometry. Freshly dissociated 2153L tumor cells were transplanted into the 4th mammary fat pad of BALB/c mice and were allowed to grow until ~330 mm3 volume. Mice then were randomized and treated with indicated therapies for 3 days. Tumor tissues were collected 3 hrs after the second injection of Zotatifin. n = 4 biological replicates per group. B, GSEA enrichment plot for Hallmark interferon α response signature that is upregulated in combination therapy treated tumors compared with Zotatifin monotherapy. C, GSEA enrichment plot for Hallmark interferon α response signature that is upregulated in combination therapy treated tumors compared with carboplatin monotherapy. D, Heatmap for Hallmark interferon α response signature proteins from tumor tissues treated with indicated therapies. E-G, Mass cytometry analysis of tumor-infiltrating immune cells of 2153L tumors that were treated with indicated therapies for 7 days. E, The uniform manifold approximation and projection (UMAP) plot overlaid with color-coded clusters. Data from five biological replicates of each group were concatenated before UMAP and FlowSOM clustering analysis. Equal numbers of events are shown for each group and major cell types are marked. F, UMAP plot overlaid with the expression of Bst2 or Granzyme B. G, Quantification of major lymphoid populations from 2153L tumors in mass cytometry analysis. n=5 biological replicates per group. H, Outline of treatment design: freshly dissociated 2153L tumor cells were transplanted into nude mice or BALB/c mice in parallel. Treatment was initiated when tumors reached 100 mm3. I, Growth curves of 2153L tumors in nude mice treated with indicated drugs. n=5 biological replicates per group. J, Growth curves of 2153L tumors in BALB/c mice treated with indicated drugs. n=3 biological replicates for monotherapy groups and n=10 biological replicates for the combination treatment group. In I and J, data are presented as mean ± SEM and analyzed using two-way ANOVA with Bonferroni’s multiple comparison test.
Figure 8.
Figure 8.
Working model of Zotatifin. Inhibition of eIF4A by Zotatifin suppresses the translation of Sox4 and Fgfr1, induces interferon response, shifts the tumor immune landscape, and ultimately enhances the response to immune checkpoint blockade or chemotherapy.

References

    1. Prat A, Adamo B, Cheang MCU, Anders CK, Carey LA, and Perou CM. Molecular Characterization of Basal-Like and Non-Basal-Like Triple-Negative Breast Cancer. The Oncologist. 2013;18(2):123–33. - PMC - PubMed
    1. Symmans WF, Wei C, Gould R, Yu X, Zhang Y, Liu M, et al. Long-Term Prognostic Risk After Neoadjuvant Chemotherapy Associated With Residual Cancer Burden and Breast Cancer Subtype. J Clin Oncol. 2017;35(10):1049–60. - PMC - PubMed
    1. Schmid P, Cortes J, Pusztai L, McArthur H, Kümmel S, Bergh J, et al. Pembrolizumab for Early Triple-Negative Breast Cancer. New England Journal of Medicine. 2020;382(9):810–21. - PubMed
    1. Bardia A, Hurvitz SA, Tolaney SM, Loirat D, Punie K, Oliveira M, et al. Sacituzumab Govitecan in Metastatic Triple-Negative Breast Cancer. N Engl J Med. 2021;384(16):1529–41. - PubMed
    1. Schmid P, Adams S, Rugo HS, Schneeweiss A, Barrios CH, Iwata H, et al. Atezolizumab and Nab-Paclitaxel in Advanced Triple-Negative Breast Cancer. New England Journal of Medicine. 2018;379(22):2108–21. - PubMed

Publication types