[Preprint]. 2023 Sep 28:2023.09.26.23296146.
doi: 10.1101/2023.09.26.23296146.

Hematologic setpoints are a stable and patient-specific deep phenotype

Affiliations

Hematologic setpoints are a stable and patient-specific deep phenotype

Brody H Foy et al. medRxiv. .

Update in

  • Haematological setpoints are a stable and patient-specific deep phenotype.
    Foy BH, Petherbridge R, Roth MT, Zhang C, De Souza DC, Mow C, Patel HR, Patel CH, Ho SN, Lam E, Powe CE, Hasserjian RP, Karczewski KJ, Tozzo V, Higgins JM. Foy BH, et al. Nature. 2025 Jan;637(8045):430-438. doi: 10.1038/s41586-024-08264-5. Epub 2024 Dec 11. Nature. 2025. PMID: 39663453 Free PMC article.

Abstract

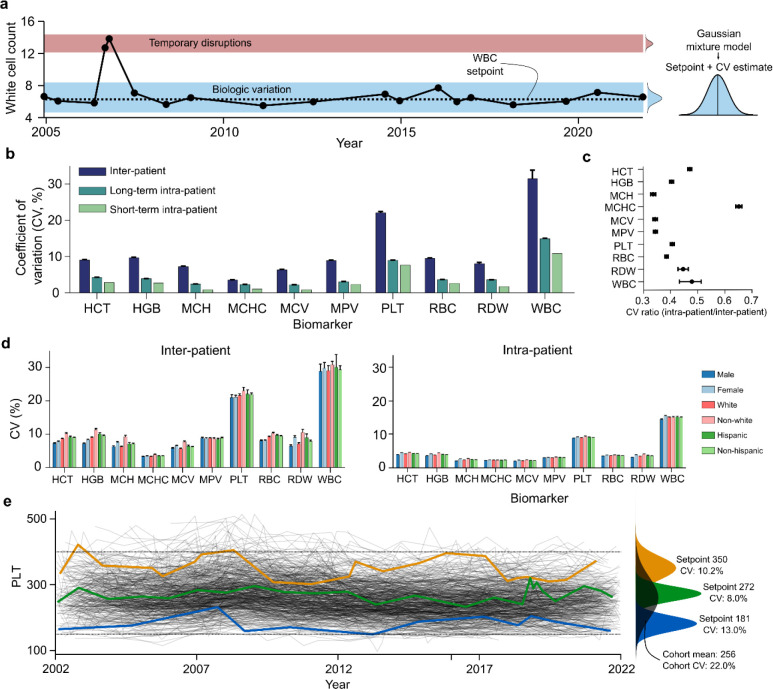
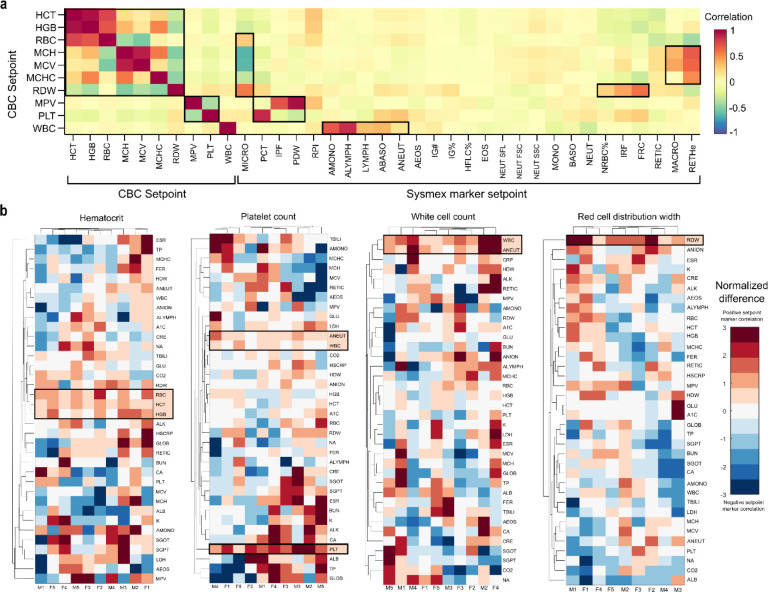
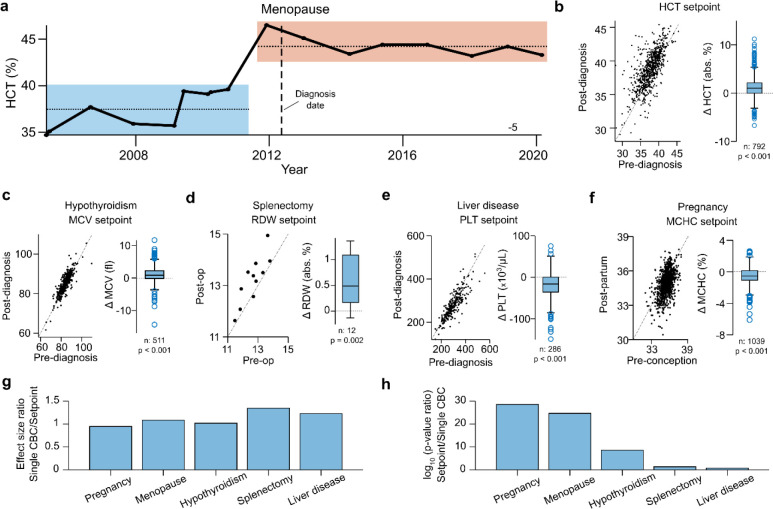
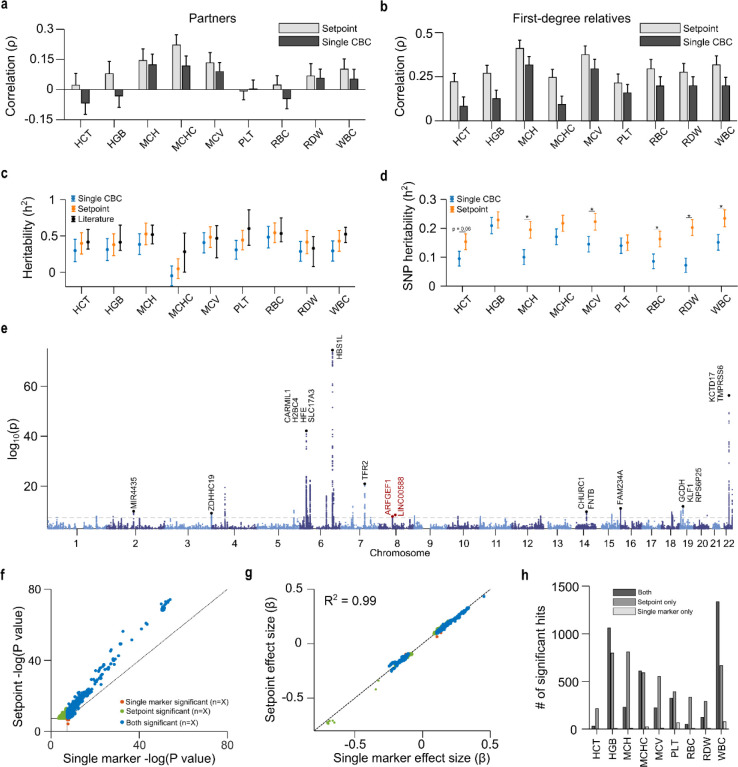
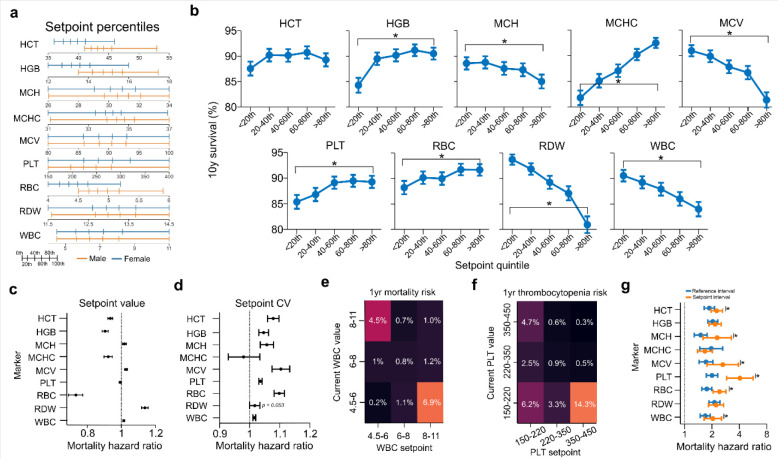
The complete blood count is an important screening tool for healthy adults and is the most commonly ordered test at periodic physical exams. However, results are usually interpreted relative to one-size-fits-all reference intervals, undermining the goal of precision medicine to tailor medical care to the needs of individual patients based on their unique characteristics. Here we show that standard complete blood count indices in healthy adults have robust homeostatic setpoints that are patient-specific and stable, with the typical healthy adult's set of 9 blood count setpoints distinguishable from 98% of others, and with these differences persisting for decades. These setpoints reflect a deep physiologic phenotype, enabling improved detection of both acquired and genetic determinants of hematologic regulation, including discovery of multiple novel loci via GWAS analyses. Patient-specific reference intervals derived from setpoints enable more accurate personalized risk assessment, and the setpoints themselves are significantly correlated with mortality risk, providing new opportunities to enhance patient-specific screening and early intervention. This study shows complete blood count setpoints are sufficiently stable and patient-specific to help realize the promise of precision medicine for healthy adults.


Conflict of interest statement

JMH reports funding from the National Institutes of Health (grant IDs: R01HD104756; R01DK123330). All authors report no conflicts of interest.

Figures

Figure 1 |
Figure 1 |. Hematologic setpoints are conserved over decades in states of health.
a. A single outpatient WBC trajectory over 20yrs, showing marked stability around 6×10³/μL with occasional transient pathophysiologic disruptions, and a 95% confident interval (4.5–8.1) about half as wide as the adult reference interval at the study hospital (4.5–11.0). b. Inter- and intra-patient variation in outpatient marker values over 20yrs (long-term) and multiple weeks (short-term); short-term intra-patient estimates were derived from the EFLM database. c. Ratio of intra- and inter-patient marker CVs, consistently below 0.5 for most markers. D. Long-term intra-patient CV estimates by demographics – showing high consistency between groups. e. Long-term PLT trajectories for 500 randomly chosen patients, with overall distribution (black) and individual trajectories of three patients with high, moderate, and low setpoints. Error bars in b-d reflect 95% confidence intervals on the mean, calculated via bootstrapping. Stratification of patient CVs by age and over different lengths of time are given in Fig S2–S3. Dotted lines in e reflect the MGH reference interval. Equivalent plots to panel e for RBC and WBC are given in Fig S6.
Figure 2 |
Figure 2 |. Physiologic associations and determinants of setpoints.
a. Correlations between setpoints and broader hematologic parameters from the Sysmex XN-9000. b. Comparison of lab marker differences across 10 matched patient pairs with setpoint differences. Markers in both a and b were ordered by hierarchical clustering. Highlighted values in b reflect those with p<0.05 significance (2-sided t-test). Summary characteristics for the Sysmex markers and four prospective cohorts are given in Table S4–S5. Note that RDW results in b are limited to 9 patient pairs due to resource constraints (see Supplementary Methods for further details).
Figure 3 |
Figure 3 |. Setpoint shifts across various pathophysiologic settings.
a. Long-term HCT trajectory in a patient pre- and post-menopause, illustrating a clear shift in HCT setpoint. b-f. Shifts in patient setpoints pre- and post- pathophysiologic events: c. hypothyroidism, d. splenectomy, e. liver disease, f. pregnancy. g. Ratio of effect size (mean marker change) estimates when using setpoints compared to a randomly chosen single isolated CBCs. h. Ratio of p-values from a t-test of effect sizes using setpoints or isolated CBCs, on a log10 scale. Summary characteristics of cohorts in b-f are given in Table S6. Lines in b-f reflect unity.
Figure 4 |
Figure 4 |. Setpoints reflect a deep phenotype, heightening mechanistic discovery.
a-b. Setpoint and single CBC correlations between romantic partners (a) and first-degree relatives (b). c. Heritability estimates derived from setpoints and single CBCs compared to literature values. d. SNP-heritability estimates from a cohort of 25,254 MGB patients, using setpoints and single CBCs. e. Manhattan plot for a GWAS of HGB setpoints in a cohort of ~25,000 MGB patients. f-g. Comparison of p-values (f) and effect sizes (g) in GWAS using HGB setpoints and single outpatient values. h. Yield increases in significant hits using setpoints comparative to single CBC markers. Dashed lines in f-g correspond to unity. Annotations in panel e correspond to nearby genes for highly significant association loci, with red annotations corresponding to novel loci. Literature heritability estimates are given in Table S7. Raw data plots for a are given in Fig S7–S8. Equivalent plots of panels e-g for other setpoints are given in Fig S9–S10, S16–S17. Quintile-quintile plots for each setpoint GWAS are given in Fig S18. A full list of GWAS hits, association loci and gene contexts is given in Tables S8–S10.
Figure 5 |
Figure 5 |. Hematologic setpoints capture significant aspects of patient mortality risk.
a. Setpoint distributions across cohort stratified by sex. b. 10yr mortality stratified by setpoint quintiles, excluding patients with abnormal setpoint values. c-d. Age- and sex-corrected 10y mortality hazard ratios by setpoint value (c) and coefficient of variation (d). e. Likelihood of mortality within 1yr given a patient’s current WBC count and setpoint. f. Likelihood of future thrombocytopenia (PLT < 150×103/μL) given current PLT count and setpoint. g. 10yr age, sex, and setpoint-corrected mortality hazard ratio if the current marker is outside the MGH reference interval (blue) or more than ±2std away from the setpoint. Results in c-d exclude setpoints outside the MGH reference interval. Results in d were corrected for the associated setpoint value. Results in g use the mean intra-patient standard deviations calculated in Fig 1e. Equivalent results to panels e-f are provided for a range of markers in Fig S14–S15. Results for b over different time periods are given in Fig S12.

References

    1. Horton S, Fleming KA, Kuti M, et al. The Top 25 Laboratory Tests by Volume and Revenue in Five Different Countries. Am J Clin Pathol. 2019;151(5):446–451. doi: 10.1093/AJCP/AQY165 - DOI - PubMed
    1. Blood Tests - Blood Tests | NHLBI, NIH. Published March 24, 2022. Accessed July 18, 2023. https://www.nhlbi.nih.gov/health/blood-tests
    1. Aarsand A, Fernandez-Calle P, Webster C, et al. The EFLM Biological Variation Database. Accessed February 14, 2023. https://biologicalvariation.eu/
    1. Wang S, Zhao M, Su Z, Mu R. Annual biological variation and personalized reference intervals of clinical chemistry and hematology analytes. Clin Chem Lab Med CCLM. 2022;60(4):606–617. doi: 10.1515/cclm-2021-0479 - DOI - PubMed
    1. Garner C, Tatu T, Reittie JE, et al. Genetic influences on F cells and other hematologic variables: a twin heritability study. Blood. 2000;95(1):342–346. - PubMed

Publication types