. 2023 Oct 5;15(1):2264619.
doi: 10.1080/20002297.2023.2264619. eCollection 2023.

Alterations of oral microbiota are associated with the development and severity of acute pancreatitis

Affiliations

Alterations of oral microbiota are associated with the development and severity of acute pancreatitis

Yiting Liu et al. J Oral Microbiol. .

Abstract

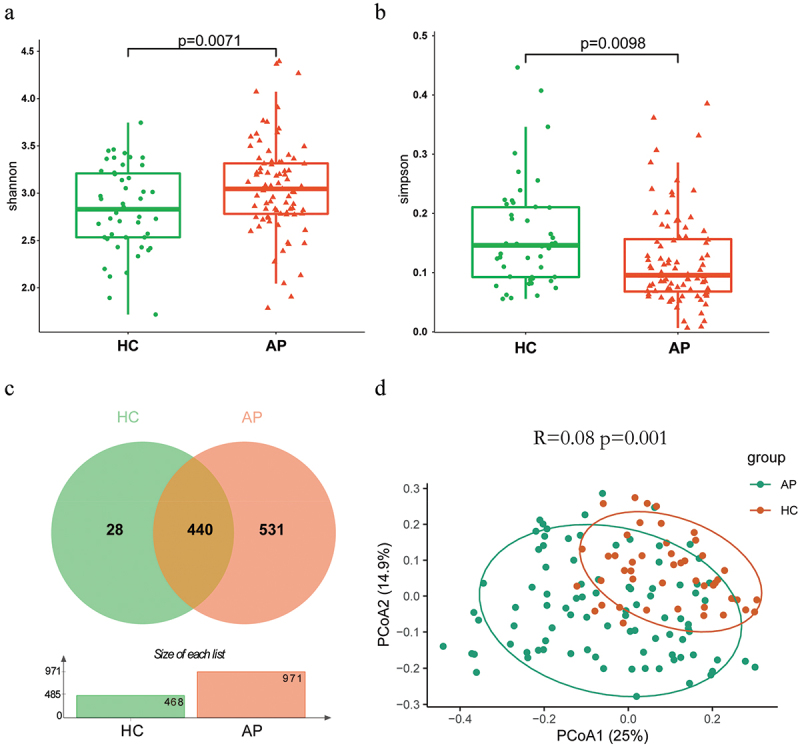
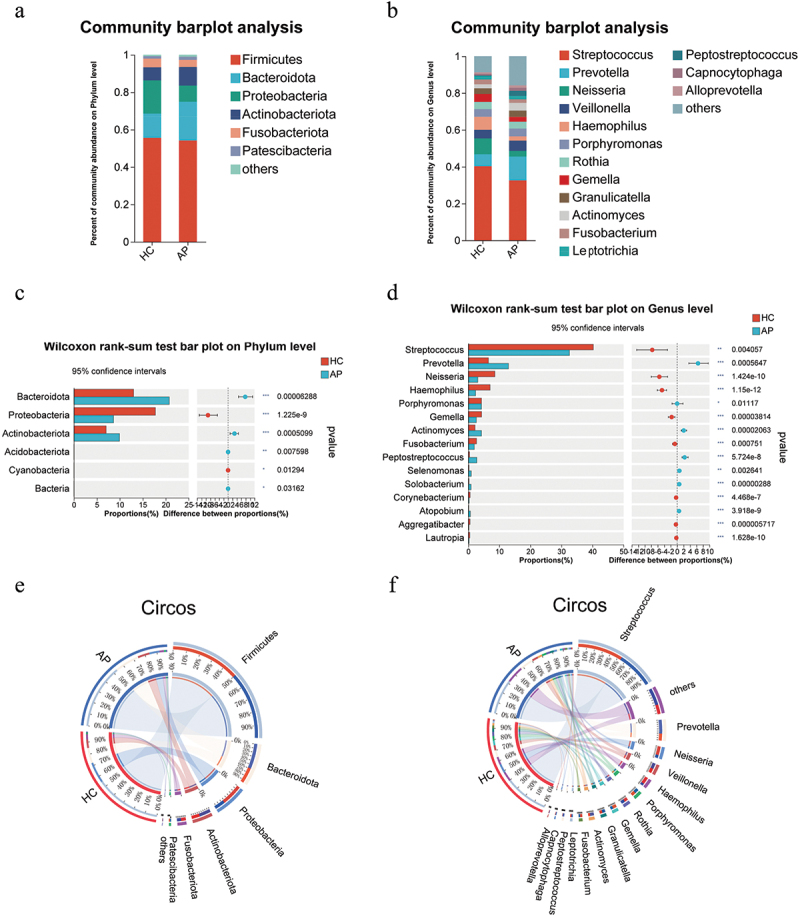
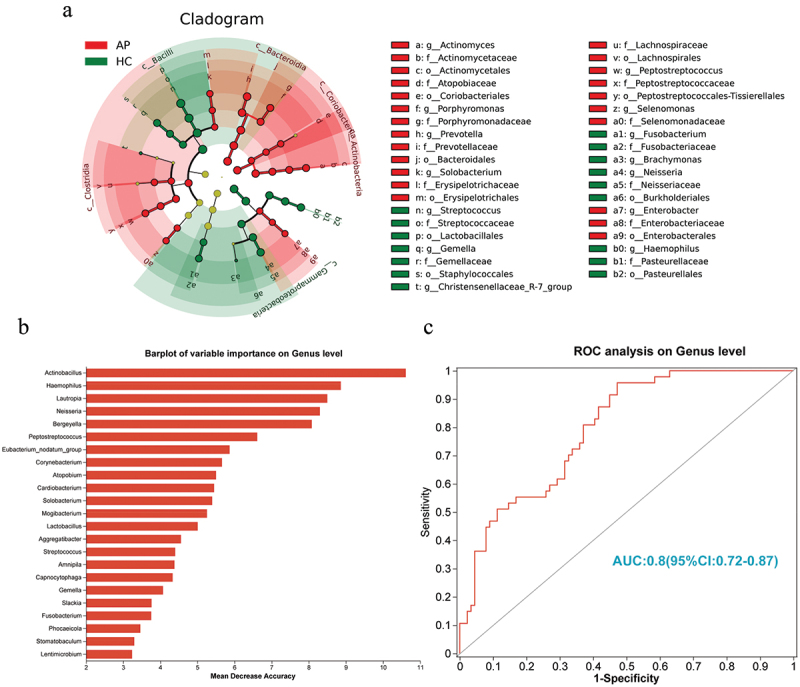
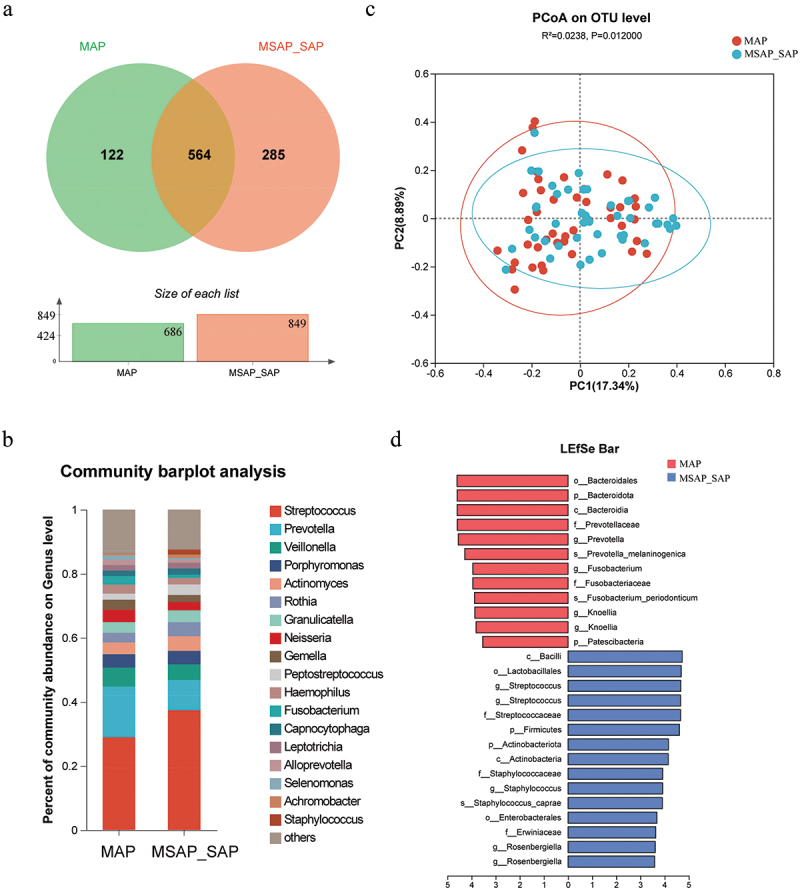
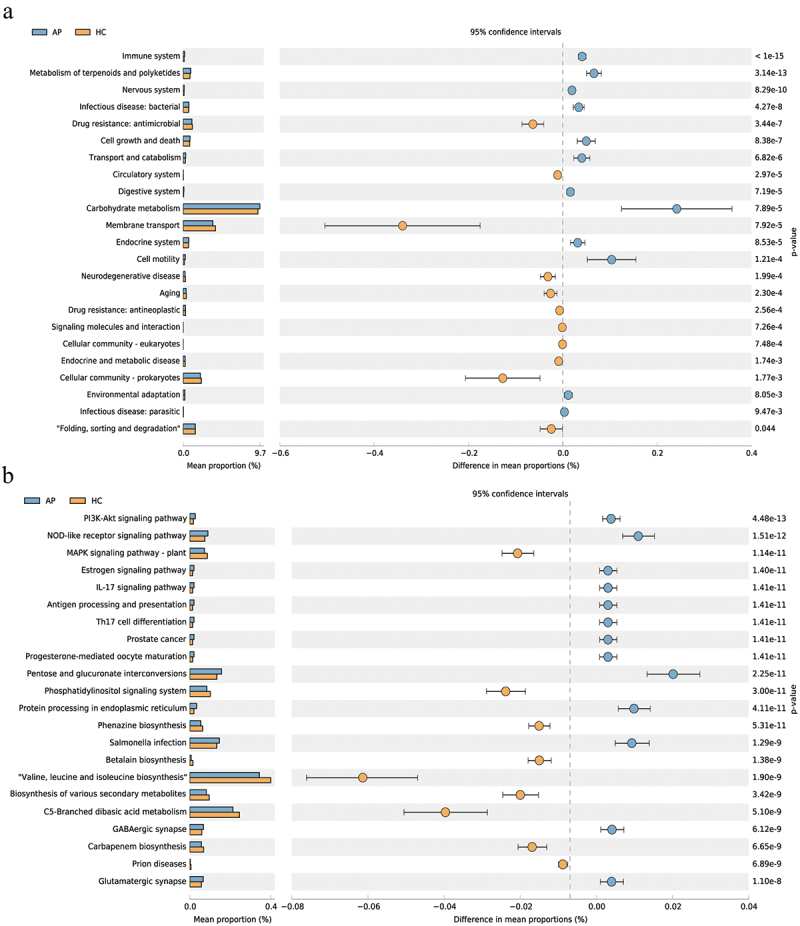
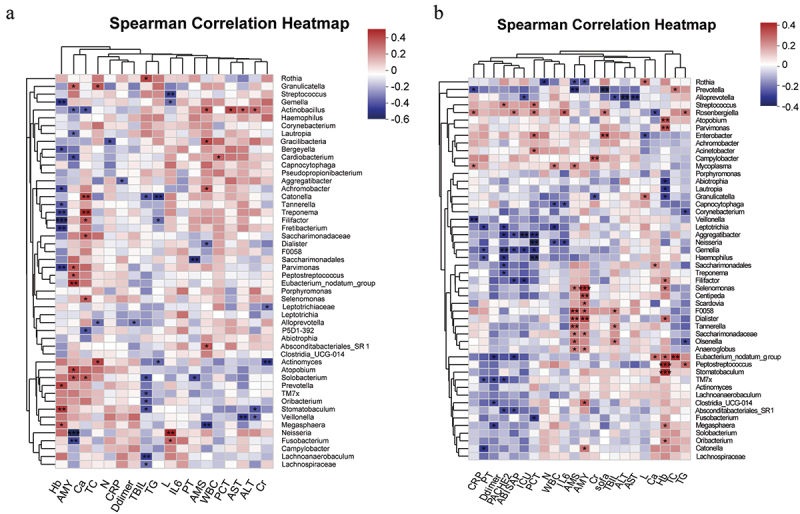
Acute pancreatitis (AP) is a common abdomen clinical emergency. Most APs have mild clinical symptoms and a good prognosis. However, about 20% of patients develop severe acute pancreatitis (SAP), increasing morbidity and mortality. The microbiome's impact on AP pathophysiology has received increasing attention. Hence, to explore changes in oral microbial composition in acute pancreatitis, we collected clinical information and oral saliva samples from 136 adult participants: 47 healthy controls, 43 acute mild AP (MAP), 29 moderate AP (MSAP), and 17 severe AP (SAP). Using 16S rRNA gene sequencing, 663,175 high-quality sequences were identified. The relative abundance and diversity of oral microorganisms in AP patients increased, with decreased beneficial bacteria such as Streptococcus, Neisseria, and Gemella, and increased Prevotella, Veillonella, Granulicatella, Actinomyces, and Peptostreptococcus in the AP group. Further changes in microbial composition occurred with increasing disease severity, including a decreased abundance of beneficial bacteria such as Neisseria, Haemophilus, and Gemella in MSAP and SAP compared to MAP. Moreover, the Lefse analysis showed that Prevotella, Peptostreptococcus, Actinomyces, and Porphyromonas were better microbial markers for AP. Therefore, oral microbiome changes could distinguish AP from healthy individuals and serve as an early novel predictor of disease severity in AP patients.

Keywords: 16S rRNA gene; Acute pancreatitis; diversity; dysbiosis; oral microbiota; prediction.


Conflict of interest statement

No potential conflict of interest was reported by the author(s).

Figures

Figure 1.
Figure 1.
Alpha and beta diversity analysis between AP and HC groups. (a) Alpha diversity based on the Shannon index; box-plot features represent the median (central line), upper and lower quartiles (box), and the maximum and minimum values of the data (bars). (b) Alpha diversity based on the Simpson index. (c) venn diagram reflecting the similarity and repeatability of species composition between two groups. (d) beta diversity based on the PCoA plot. Each symbol represents the gut microbiota of a sample. AP, acute pancreatitis; HC, healthy control.
Figure 2.
Figure 2.
Oral microbiota composition. average bacterial community composition at the phylum (a) and genus levels (b) levels. Analysis of species differences in oral flora between AP HC groups at the phylum(c and genus (d) levels. On the left, the X- and Y-axis represents the average relative abundance of the gut microbiota species in various groups and the gut microbiota species names at a certain classification level, respectively. On the right, the X- and Y-axis represents different gut microbiota species between various groups and p value of significance. *0.01 < p < 0.05, **0.01 < p < 0.001, ***p < 0.001. Circos diagram of microbial composition at the phylum(E) and genus(F) level in the three groups (left and right semicircles represent different samples and different species).
Figure 3.
Figure 3.
LEfSe and LDA based on OTUs among AP and HC groups. (a) the circles radiating from the inside to the outside represent the classification level from the phylum to the genus. Each circle of a level represents that at level’s classification, and the circle’s diameter represents its relative abundance. Biomarkers with significant differences are colored according to the grouping color (‘p’ represents phylum, ‘c’ represents class, ‘o’ represents order, ‘f’ represents family, ‘g’ represents genus). (b) the top 23 biomarker bacterial classes were identified by applying random forests regression to their relative abundance values. (c) we constructed receiver operating characteristic curves (ROCs) for optimized microbial biomarkers using the top 23 microbial markers identified by random forest regression to better distinguish between the HC and AP groups. AUC: area under the ROC curve.
Figure 4.
Figure 4.
Differences in oral microbiota between MAP and MSAP_SAP groups. (a) venn diagram reflecting the similarity and repeatability of species composition between two groups. (b) average composition of bacterial community at the genus levels. (c) beta diversity analysis based on the PCoA plot. (d) microbes with differential abundance (LDA score>3.5) were plotted as a histogram. LDA score histogram showing the oral microbiome with significant differences between the two groups.
Figure 5.
Figure 5.
Oral microbial functional dysbiosis in AP patients and HCs. differential KEGG pathways by PICRUSt. Significant differences between AP and HC groups at level 2 (a) and level 3 (b).
Figure 6.
Figure 6.
Associations between oral microbiomes and clinical indices of AP. Spearman correlations between the top 50 species regarding total taxonomic abundance, clinical outcomes, and disease severity indicators. Positive (red) or negative (blue) correlations are shown by a two-color heatmap, with asterisks denoting statistical significance (*p < 0.05, **p < 0.01).

Similar articles

Cited by

References

    1. Shah AU, Sarwar A, Orabi AI, et al. Protease activation during in vivo pancreatitis is dependent on calcineurin activation. Am J Physiol Gastrointest Liver Physiol. 2009;297(5):G967–13. doi: 10.1152/ajpgi.00181.2009 - DOI - PMC - PubMed
    1. Banks PA, Bollen TL, Dervenis C, et al. Classification of acute pancreatitis-2012: revision of the Atlanta classification and definitions by international consensus. Gut. 2013;62(1):102–111. doi: 10.1136/gutjnl-2012-302779 - DOI - PubMed
    1. Vege SS, Gardner TB, Chari ST, et al. Low mortality and high morbidity in severe acute pancreatitis without organ failure: a case for revising the Atlanta classification to include “moderately severe acute pancreatitis”. Am J Gastroenterol. 2009;104(3):710–715. doi: 10.1038/ajg.2008.77 - DOI - PubMed
    1. Hagjer S, Kumar N.. Evaluation of the BISAP scoring system in prognostication of acute pancreatitis - a prospective observational study. Int J Surg. 2018;54(Pt A):76–81. doi: 10.1016/j.ijsu.2018.04.026 - DOI - PubMed
    1. Lankisch PG, Warnecke B, Bruns D, et al. The APACHE II score is unreliable to diagnose necrotizing pancreatitis on admission to hospital. Pancreas. 2002;24(3):217–222. doi: 10.1097/00006676-200204000-00002 - DOI - PubMed

LinkOut - more resources