

A geometry and dose-volume based performance monitoring of artificial intelligence models in radiotherapy treatment planning for prostate cancer
- PMID: 37809056
- PMCID: PMC10550805
- DOI: 10.1016/j.phro.2023.100494
A geometry and dose-volume based performance monitoring of artificial intelligence models in radiotherapy treatment planning for prostate cancer
Abstract
Background and purpose: Clinical Artificial Intelligence (AI) implementations lack ground-truth when applied on real-world data. This study investigated how combined geometrical and dose-volume metrics can be used as performance monitoring tools to detect clinically relevant candidates for model retraining.
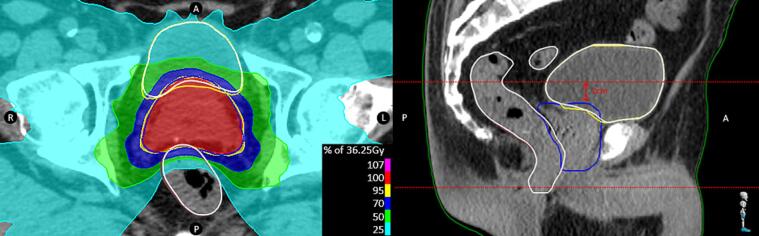
Materials and methods: Fifty patients were analyzed for both AI-segmentation and planning. For AI-segmentation, geometrical (Standard Surface Dice 3 mm and Local Surface Dice 3 mm) and dose-volume based parameters were calculated for two organs (bladder and anorectum) to compare AI output against the clinically corrected structure. A Local Surface Dice was introduced to detect geometrical changes in the vicinity of the target volumes, while an Absolute Dose Difference (ADD) evaluation increased focus on dose-volume related changes. AI-planning performance was evaluated using clinical goal analysis in combination with volume and target overlap metrics.
Results: The Local Surface Dice reported equal or lower values compared to the Standard Surface Dice (anorectum: (0.93 ± 0.11) vs (0.98 ± 0.04); bladder: (0.97 ± 0.06) vs (0.98 ± 0.04)). The ADD metric showed a difference of (0.9 ± 0.8)Gy for the anorectum . The bladder reported a difference of (0.7 ± 1.5)Gy. Mandatory clinical goals were fulfilled in 90 % of the DLP plans.
Conclusions: Combining dose-volume and geometrical metrics allowed detection of clinically relevant changes, applied to both auto-segmentation and auto-planning output and the Local Surface Dice was more sensitive to local changes compared to the Standard Surface Dice. This monitoring is able to evaluate AI behavior in clinical practice and allows candidate selection for active learning.
Keywords: Artificial intelligence; Clinical metrics; Deep Learning Planning; Deep Learning Segmentation; Performance monitoring; SBRT prostate.
© 2023 The Author(s).
Conflict of interest statement
The authors declare that they have no known competing financial interests or personal relationships that could have appeared to influence the work reported in this paper.
Figures


Similar articles
-
Evaluating the clinical acceptability of deep learning contours of prostate and organs-at-risk in an automated prostate treatment planning process.Med Phys. 2022 Apr;49(4):2570-2581. doi: 10.1002/mp.15525. Epub 2022 Feb 21. Med Phys. 2022. PMID: 35147216
-
The dosimetric impact of deep learning-based auto-segmentation of organs at risk on nasopharyngeal and rectal cancer.Radiat Oncol. 2021 Jun 23;16(1):113. doi: 10.1186/s13014-021-01837-y. Radiat Oncol. 2021. PMID: 34162410 Free PMC article.
-
Patient-specific transfer learning for auto-segmentation in adaptive 0.35 T MRgRT of prostate cancer: a bi-centric evaluation.Med Phys. 2023 Mar;50(3):1573-1585. doi: 10.1002/mp.16056. Epub 2022 Nov 7. Med Phys. 2023. PMID: 36259384
-
Auto-segmentation of organs at risk for head and neck radiotherapy planning: From atlas-based to deep learning methods.Med Phys. 2020 Sep;47(9):e929-e950. doi: 10.1002/mp.14320. Epub 2020 Jul 28. Med Phys. 2020. PMID: 32510603 Review.
-
A Review of the Metrics Used to Assess Auto-Contouring Systems in Radiotherapy.Clin Oncol (R Coll Radiol). 2023 Jun;35(6):354-369. doi: 10.1016/j.clon.2023.01.016. Epub 2023 Jan 31. Clin Oncol (R Coll Radiol). 2023. PMID: 36803407 Review.
Cited by
-
Monitoring performance of clinical artificial intelligence in health care: a scoping review.JBI Evid Synth. 2024 Dec 1;22(12):2423-2446. doi: 10.11124/JBIES-24-00042. JBI Evid Synth. 2024. PMID: 39658865 Free PMC article.
-
Auditing the clinical usage of deep-learning based organ-at-risk auto-segmentation in radiotherapy.Phys Imaging Radiat Oncol. 2025 Jan 30;33:100716. doi: 10.1016/j.phro.2025.100716. eCollection 2025 Jan. Phys Imaging Radiat Oncol. 2025. PMID: 39981522 Free PMC article.
-
Multicentre prospective risk analysis of a fully automated radiotherapy workflow.Phys Imaging Radiat Oncol. 2025 Apr 6;34:100765. doi: 10.1016/j.phro.2025.100765. eCollection 2025 Apr. Phys Imaging Radiat Oncol. 2025. PMID: 40248770 Free PMC article.
-
Auto-Segmentation and Auto-Planning in Automated Radiotherapy for Prostate Cancer.Bioengineering (Basel). 2025 Jun 6;12(6):620. doi: 10.3390/bioengineering12060620. Bioengineering (Basel). 2025. PMID: 40564436 Free PMC article.
References
LinkOut - more resources
Full Text Sources
