

Control of maternal Zika virus infection during pregnancy is associated with lower antibody titers in a macaque model
- PMID: 37809089
- PMCID: PMC10556460
- DOI: 10.3389/fimmu.2023.1267638
Control of maternal Zika virus infection during pregnancy is associated with lower antibody titers in a macaque model
Abstract
Introduction: Zika virus (ZIKV) infection during pregnancy results in a spectrum of birth defects and neurodevelopmental deficits in prenatally exposed infants, with no clear understanding of why some pregnancies are more severely affected. Differential control of maternal ZIKV infection may explain the spectrum of adverse outcomes.
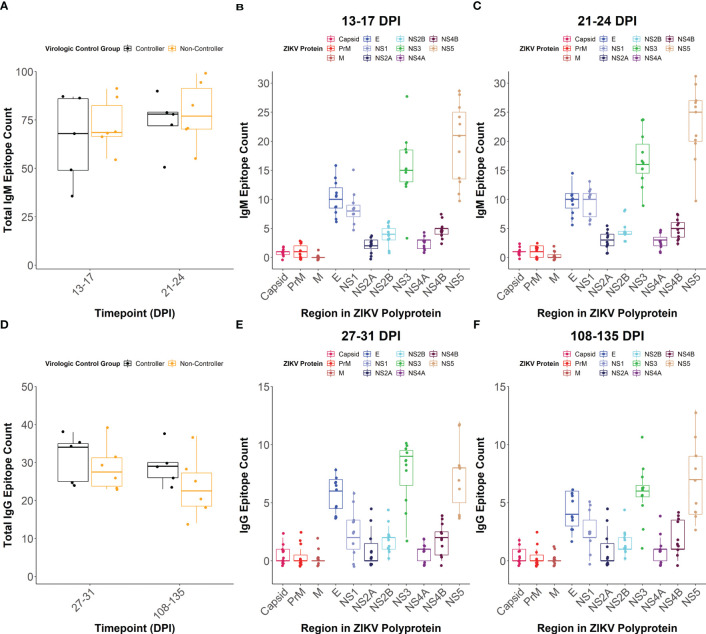
Methods: Here, we investigated whether the magnitude and breadth of the maternal ZIKV-specific antibody response is associated with better virologic control using a rhesus macaque model of prenatal ZIKV infection. We inoculated 18 dams with an Asian-lineage ZIKV isolate (PRVABC59) at 30-45 gestational days. Plasma vRNA and infectious virus kinetics were determined over the course of pregnancy, as well as vRNA burden in the maternal-fetal interface (MFI) at delivery. Binding and neutralizing antibody assays were performed to determine the magnitude of the ZIKV-specific IgM and IgG antibody responses throughout pregnancy, along with peptide microarray assays to define the breadth of linear ZIKV epitopes recognized.
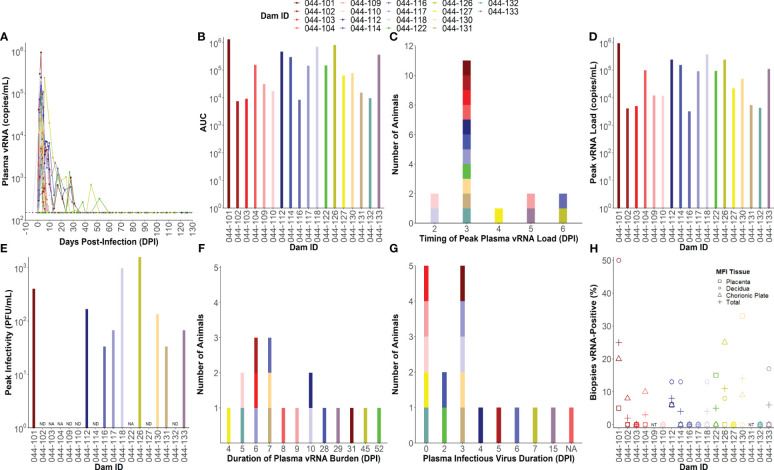
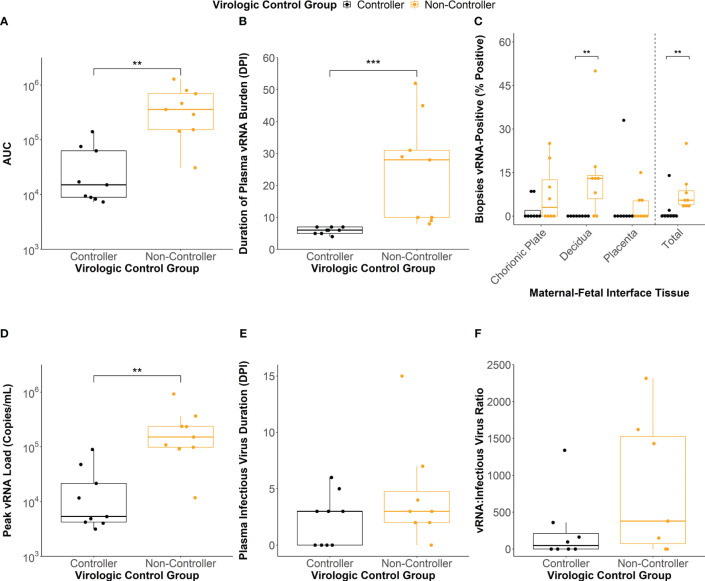
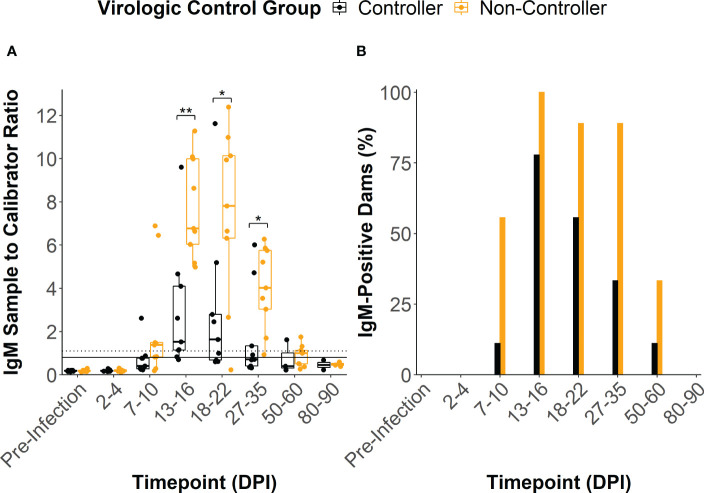
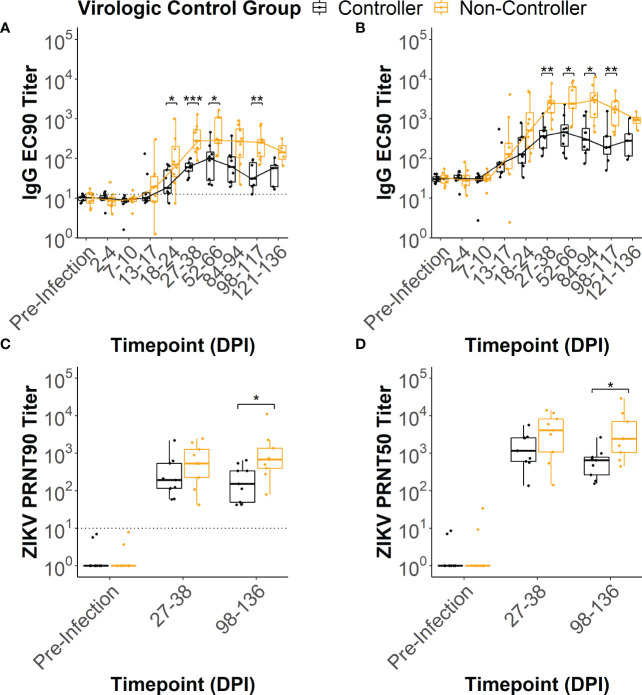
Results: Dams with better virologic control (n= 9) cleared detectable infectious virus and vRNA from the plasma by 7 days post-infection (DPI) and had a lower vRNA burden in the MFI at delivery. In comparison, dams with worse virologic control (n= 9) still cleared detectable infectious virus from the plasma by 7 DPI but had vRNA that persisted longer, and had higher vRNA burden in the MFI at delivery. The magnitudes of the ZIKV-specific antibody responses were significantly lower in the dams with better virologic control, suggesting that higher antibody titers are not associated with better control of ZIKV infection. Additionally, the breadth of the ZIKV linear epitopes recognized did not differ between the dams with better and worse control of ZIKV infection.
Discussion: Thus, the magnitude and breadth of the maternal antibody responses do not seem to impact maternal virologic control. This may be because control of maternal infection is determined in the first 7 DPI, when detectable infectious virus is present and before robust antibody responses are generated. However, the presence of higher ZIKV-specific antibody titers in dams with worse virologic control suggests that these could be used as a biomarker of poor maternal control of infection and should be explored further.
Keywords: ZIKV; Zika virus; congenital Zika syndrome (CZS); macaque model; maternal ZIKV infection; maternal antibody response; pregnancy.
Copyright © 2023 Krabbe, Razo, Abraham, Spanton, Shi, Bhattacharya, Bohm, Pritchard, Weiler, Mitzey, Eickhoff, Sullivan, Tan, Aliota, Friedrich, O’Connor, Golos and Mohr.
Conflict of interest statement
Authors ES and JT are employed by the company Nimble Therapeutics, Inc. The remaining authors declare that the research was conducted in the absence of any commercial or financial relationships that could be construed as a potential conflict of interest.
Figures
Similar articles
-
African-Lineage Zika Virus Replication Dynamics and Maternal-Fetal Interface Infection in Pregnant Rhesus Macaques.J Virol. 2021 Jul 26;95(16):e0222020. doi: 10.1128/JVI.02220-20. Epub 2021 Jul 26. J Virol. 2021. PMID: 34076485 Free PMC article.
-
Infection of the maternal-fetal interface and vertical transmission following low-dose inoculation of pregnant rhesus macaques (Macaca mulatta) with an African-lineage Zika virus.PLoS One. 2023 May 4;18(5):e0284964. doi: 10.1371/journal.pone.0284964. eCollection 2023. PLoS One. 2023. PMID: 37141276 Free PMC article.
-
Zika virus infection at mid-gestation results in fetal cerebral cortical injury and fetal death in the olive baboon.PLoS Pathog. 2019 Jan 18;15(1):e1007507. doi: 10.1371/journal.ppat.1007507. eCollection 2019 Jan. PLoS Pathog. 2019. PMID: 30657788 Free PMC article.
-
Zika Virus Infection in Pregnancy: Maternal, Fetal, and Neonatal Considerations.J Infect Dis. 2017 Dec 16;216(suppl_10):S891-S896. doi: 10.1093/infdis/jix448. J Infect Dis. 2017. PMID: 29267916 Free PMC article. Review.
-
Congenital Zika virus infection in laboratory animals: a comparative review highlights translational studies on the maternal-foetal interface.Mem Inst Oswaldo Cruz. 2025 Feb 28;120:e240125. doi: 10.1590/0074-02760240125. eCollection 2025. Mem Inst Oswaldo Cruz. 2025. PMID: 40052994 Free PMC article. Review.
Cited by
-
Role of non-human primate models in accelerating research and developing countermeasures against Zika virus infection.Lancet Microbe. 2025 Jun;6(6):101030. doi: 10.1016/j.lanmic.2024.101030. Epub 2025 Feb 27. Lancet Microbe. 2025. PMID: 40024258 Review.
-
Prenatal Zika Virus Exposure Disrupts Social-Emotional Development and Cortical Visual Function in Infant Macaques.bioRxiv [Preprint]. 2025 Jun 9:2025.06.09.658678. doi: 10.1101/2025.06.09.658678. bioRxiv. 2025. PMID: 40661604 Free PMC article. Preprint.
-
Pathogenesis of viral infections during pregnancy.Clin Microbiol Rev. 2024 Jun 13;37(2):e0007323. doi: 10.1128/cmr.00073-23. Epub 2024 Feb 29. Clin Microbiol Rev. 2024. PMID: 38421182 Free PMC article. Review.
-
Comparative Analysis of Two Zika Virus Isolates in a Rhesus Macaque Pregnancy Model.Viruses. 2025 May 27;17(6):762. doi: 10.3390/v17060762. Viruses. 2025. PMID: 40573353 Free PMC article.
References
-
- Roth NM, Reynolds MR, Lewis EL, Woodworth KR, Godfred-Cato S, Delaney A, et al. . Zika-associated birth defects reported in pregnancies with laboratory evidence of confirmed or possible Zika virus infection - U.S. Zika pregnancy and infant registry, december 1, 2015-march 31, 2018. MMWR Morb Mortal Wkly Rep (2022) 71:73–9. doi: 10.15585/mmwr.mm7103a1 - DOI - PMC - PubMed
Publication types
MeSH terms
Substances
Grants and funding
LinkOut - more resources
Full Text Sources
Medical
Molecular Biology Databases