Meta-Analysis
. 2023 Sep 21:14:1147573.
doi: 10.3389/fimmu.2023.1147573. eCollection 2023.

PheWAS and cross-disorder analysis reveal genetic architecture, pleiotropic loci and phenotypic correlations across 11 autoimmune disorders

Affiliations
Meta-Analysis

PheWAS and cross-disorder analysis reveal genetic architecture, pleiotropic loci and phenotypic correlations across 11 autoimmune disorders

Apostolia Topaloudi et al. Front Immunol. .

Abstract

Introduction: Autoimmune disorders (ADs) are a group of about 80 disorders that occur when self-attacking autoantibodies are produced due to failure in the self-tolerance mechanisms. ADs are polygenic disorders and associations with genes both in the human leukocyte antigen (HLA) region and outside of it have been described. Previous studies have shown that they are highly comorbid with shared genetic risk factors, while epidemiological studies revealed associations between various lifestyle and health-related phenotypes and ADs.

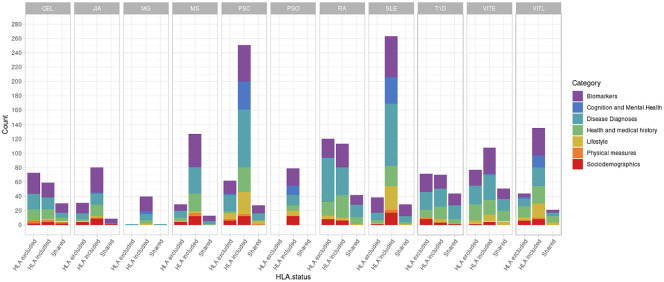
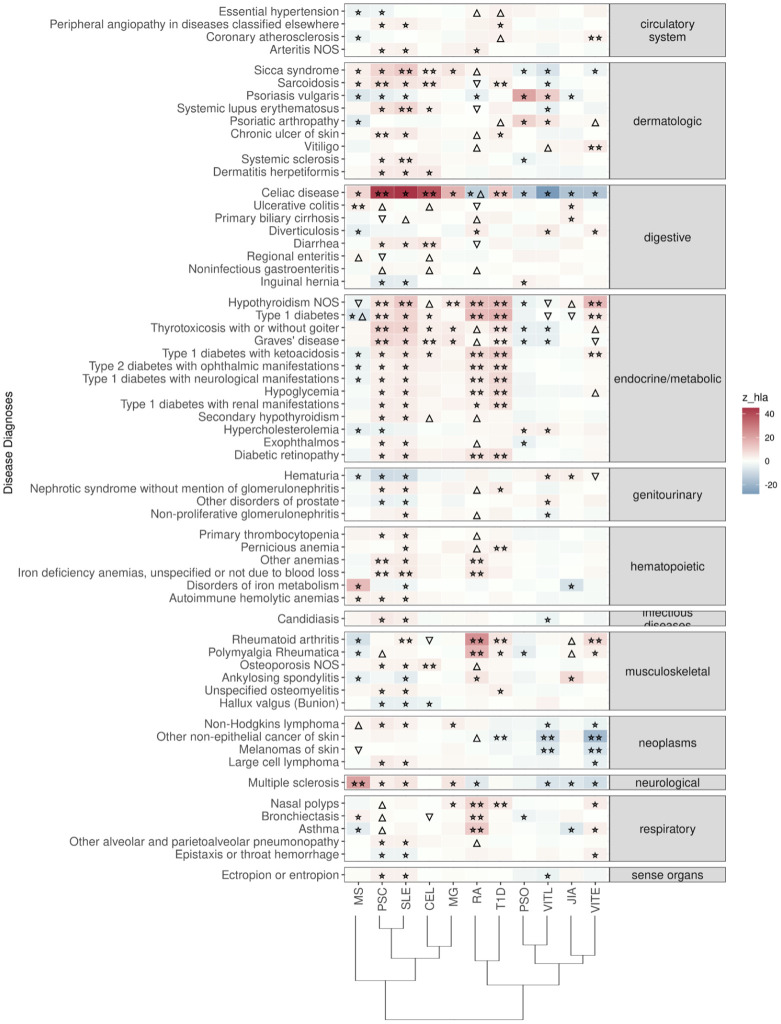
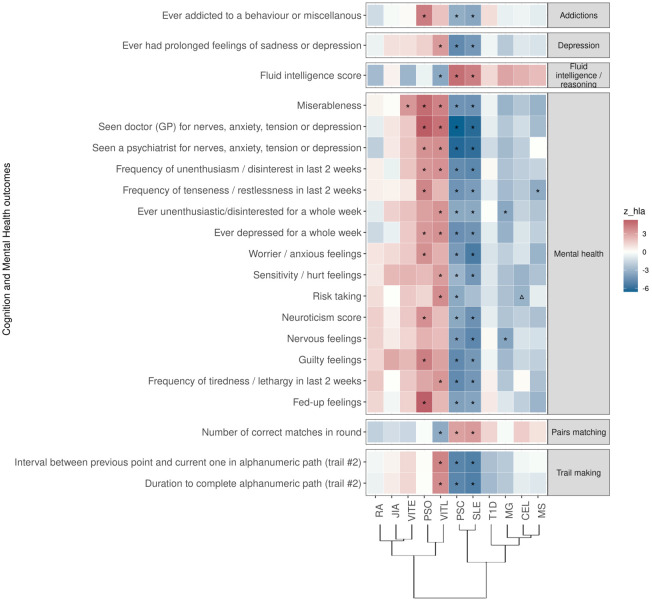
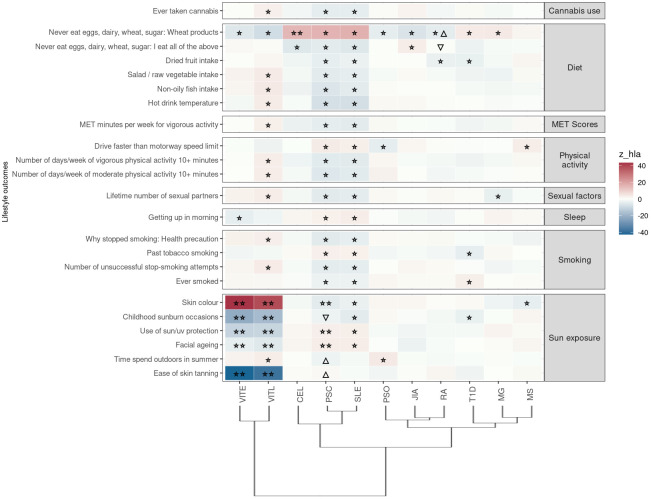
Methods: Here, for the first time, we performed a comparative polygenic risk score (PRS) - Phenome Wide Association Study (PheWAS) for 11 different ADs (Juvenile Idiopathic Arthritis, Primary Sclerosing Cholangitis, Celiac Disease, Multiple Sclerosis, Rheumatoid Arthritis, Psoriasis, Myasthenia Gravis, Type 1 Diabetes, Systemic Lupus Erythematosus, Vitiligo Late Onset, Vitiligo Early Onset) and 3,254 phenotypes available in the UK Biobank that include a wide range of socio-demographic, lifestyle and health-related outcomes. Additionally, we investigated the genetic relationships of the studied ADs, calculating their genetic correlation and conducting cross-disorder GWAS meta-analyses for the observed AD clusters.

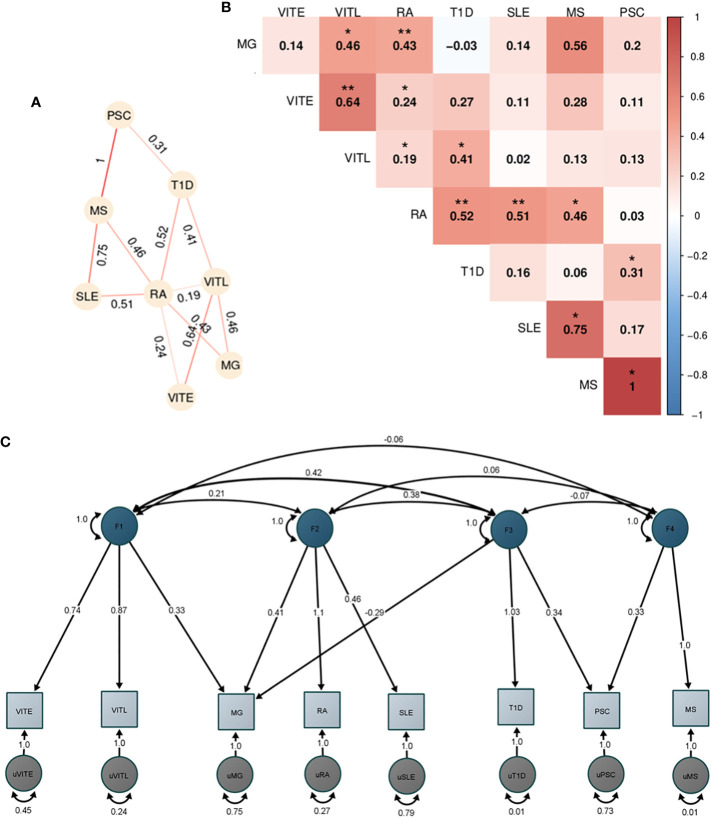
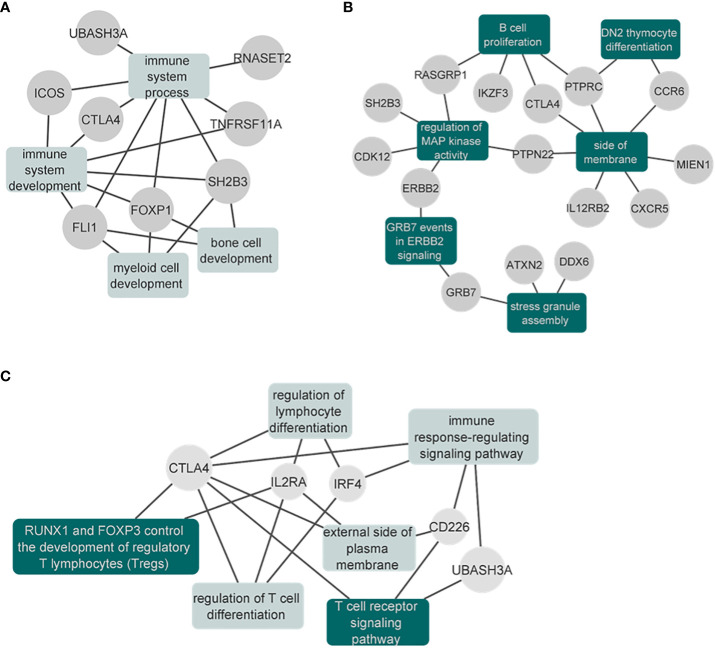
Results: In total, we identified 508 phenotypes significantly associated with at least one AD PRS. 272 phenotypes were significantly associated after excluding variants in the HLA region from the PRS estimation. Through genetic correlation and genetic factor analyses, we identified four genetic factors that run across studied ADs. Cross-trait meta-analyses within each factor revealed pleiotropic genome-wide significant loci.

Discussion: Overall, our study confirms the association of different factors with genetic susceptibility for ADs and reveals novel observations that need to be further explored.

Keywords: GWAS; PRS; PheWAS; autoimmune disorders; cross-disorder; meta-analysis.


Conflict of interest statement

KP is Founder and Head of the Institute for Research and Innovation. Based at Patras Science Park. The remaining authors declare that the research was conducted in the absence of any commercial or financial relationships that could be construed as a potential conflict of interest.

Figures

Figure 1
Figure 1
Number of significant phenotypes associated with autoimmune polygenic risk scores (p<10-5). The different colors represent the general UK Biobank categories. The “HLA excluded” bar shows the number of significant associations with the phenotypes when HLA was excluded from the AD PRS calculations. The “HLA included” bar shows the number of significant associations with the phenotypes when HLA was included in the AD PRS calculations. The “Shared” bar shows the number of significant associations with the phenotypes for both HLA included or excluded AD PRSs.
Figure 2
Figure 2
Significant PRS-PheWAS for at least three AD PRS with phenotypes in the Disease Diagnoses UK Biobank category, using the normalized PRS. The shown phenotypes were significantly associated, after FDR adjustment, with at least three AD PRS irrespectively of the HLA status. The colors of cells indicate the standardized effect sizes (β) for the regression between AD PRS with HLA and each phenotype. The one star “☆” shows the significant results only with the “HLA included” AD PRS. The two stars “☆☆” show the significant associations with both “HLA included or excluded” AD PRS with the same effect direction. The star and the upper facing triangle “☆▵” show the significant associations with both “HLA included or excluded” AD PRS but with opposite effect directions. The upper facing triangle “▵” shows the significant associations only with “HLA excluded” AD PRS that the effect direction is the same as the color indicates. The down-facing triangle “▿” shows the significant associations only with “HLA excluded” AD PRS that the effect direction is the opposite of what the color indicates. To group the disease diagnoses phenotypes, we used the R PheWAS tool and collapsed similar ICD-10 codes into one phecode. We used the hclust R function to perform the hierarchical clustering of the autoimmune disorders shown in the dendrogram using all standardized effect sizes for the disease diagnoses phenotypes.
Figure 3
Figure 3
Significant PRS-PheWAS for at least three AD PRS with phenotypes in the Cognition and Mental Health UK Biobank category, using the normalized PRS. The shown phenotypes were significantly associated, after FDR adjustment, with at least three AD PRS irrespectively of the HLA status. The colors of cells indicate the standardized effect sizes (β) for the regression between AD PRS with HLA and each phenotype. The one star “☆” shows the significant results only with the “HLA included” AD PRS. The upper facing triangle “▵” shows the significant associations only with “HLA excluded” AD PRS that the effect direction is the same as the color indicates. To group the phenotypes, we used the categories provided by the UK Biobank. We used the hclust R function to perform the hierarchical clustering of the autoimmune disorders showing in the dendrogram using all standardized effect sizes for the Cognition and Mental Health phenotypes.
Figure 4
Figure 4
Significant PRS-PheWAS for at least three AD PRS with phenotypes in the Lifestyle UK Biobank category, using the normalized PRS. The shown phenotypes were significantly associated, after FDR adjustment, with at least three AD PRS irrespectively of the HLA status. The colors of cells indicate the standardized effect sizes (β) for the regression between AD PRS with HLA and each phenotype. The one star “☆” shows the significant results only with the “HLA included” AD PRS. The two stars “☆☆” show the significant associations with both “HLA included or excluded” AD PRS with the same effect direction. The star and the upper facing triangle “☆▵” show the significant associations with both “HLA included or excluded” AD PRS but with opposite effect directions. The upper facing triangle “▵” shows the significant associations only with “HLA excluded” AD PRS that the effect direction is the same as the color indicates. To group the phenotypes, we used the categories provided by the UK Biobank. We used the hclust R function to perform the hierarchical clustering of the autoimmune disorders shown in the dendrogram using all standardized effect sizes for the Lifestyle category phenotypes.
Figure 5
Figure 5
Genetic correlation and factor analysis for 8 autoimmune disorders. The figure shows the analyses of the 8 autoimmune disorders with enough overlap (>200.000 SNPs) with HapMap3 data provided by LDSC after excluding the HLA locus (hg19, chr6 25-33 Mb). (A) Heatmap of the pairwise LDSC genome wide genetic correlations of the 8 autoimmune disorders after excluding the SNPs in the HLA region. The red color reflects more positive correlation coefficients while blue reflects more negative coefficients, and the numbers within each cell are the correlation coefficients. The correlations with p<0.05 are denoted with one asterisk (*), while two asterisks (**) show the correlations that are significant after Bonferroni correction. (B) Network representation of the genetic correlation between the autoimmune disorders with p<0.05. The numbers show the correlation coefficient and the stronger the line color shows a higher coefficient. (C) Path graph of the confirmatory factor model estimated using the Genomic SEM. Four factors were identified. The factor loadings for each trait are depicted by arrows between the trait and the factor, with the standardized loading value and the standard error in the parentheses. Correlation between factors is indicated by arrows between them. Residual variance for each trait is indicated by the two-headed arrow connecting the variable to itself.
Figure 6
Figure 6
Network plots of the enrichment analysis for the cross-disorder meta-analyses. (A) Results of the significantly enriched terms from the genes identified in the VITE-VITL-MG meta-analysis. Results are also shown in Supplementary Table 5 . (B) Results of the significantly enriched terms (after excluding the IEA terms) from the genes identified in the SLE-MG-RA meta-analysis. The full results are also shown in the Supplementary Table 7 . (C) Results of the significantly enriched terms from the genes identified in the T1D-MG-PSC meta-analysis. The full results are also shown in the Supplementary Table 9 . Enriched gene sets that remained significant after excluding the IEA GO terms are shown in dark green.

References

    1. Hayter SM, Cook MC. Updated assessment of the prevalence, spectrum and case definition of autoimmune disease. Autoimmun Rev (2012) 11:754–65. doi: 10.1016/j.autrev.2012.02.001 - DOI - PubMed
    1. Wang L, Wang F-S, Gershwin ME. Human autoimmune diseases: a comprehensive update. J Intern Med (2015) 278:369–95. doi: 10.1111/joim.12395 - DOI - PubMed
    1. Cooper GS, Stroehla BC. The epidemiology of autoimmune diseases. Autoimmun Rev (2003) 2:119–25. doi: 10.1016/S1568-9972(03)00006-5 - DOI - PubMed
    1. Mayer-Davis EJ, Lawrence JM, Dabelea D, Divers J, Isom S, Dolan L, et al. . Incidence trends of type 1 and type 2 diabetes among youths, 2002-2012. N Engl J Med (2017) 376:1419–29. doi: 10.1056/NEJMoa1610187 - DOI - PMC - PubMed
    1. Fatoye F, Gebrye T, Svenson LW. Real-world incidence and prevalence of systemic lupus erythematosus in Alberta, Canada. Rheumatol Int (2018) 38:1721–6. doi: 10.1007/s00296-018-4091-4 - DOI - PMC - PubMed

Publication types