. 2023 Sep 1;26(10):107813.
doi: 10.1016/j.isci.2023.107813. eCollection 2023 Oct 20.

A myeloid program associated with COVID-19 severity is decreased by therapeutic blockade of IL-6 signaling

Collaborators, Affiliations

A myeloid program associated with COVID-19 severity is decreased by therapeutic blockade of IL-6 signaling

Jason A Hackney et al. iScience. .

Abstract

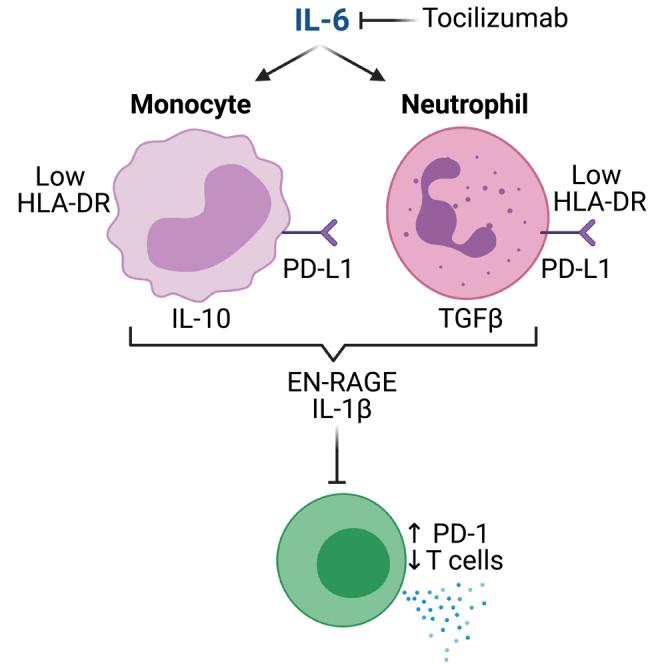
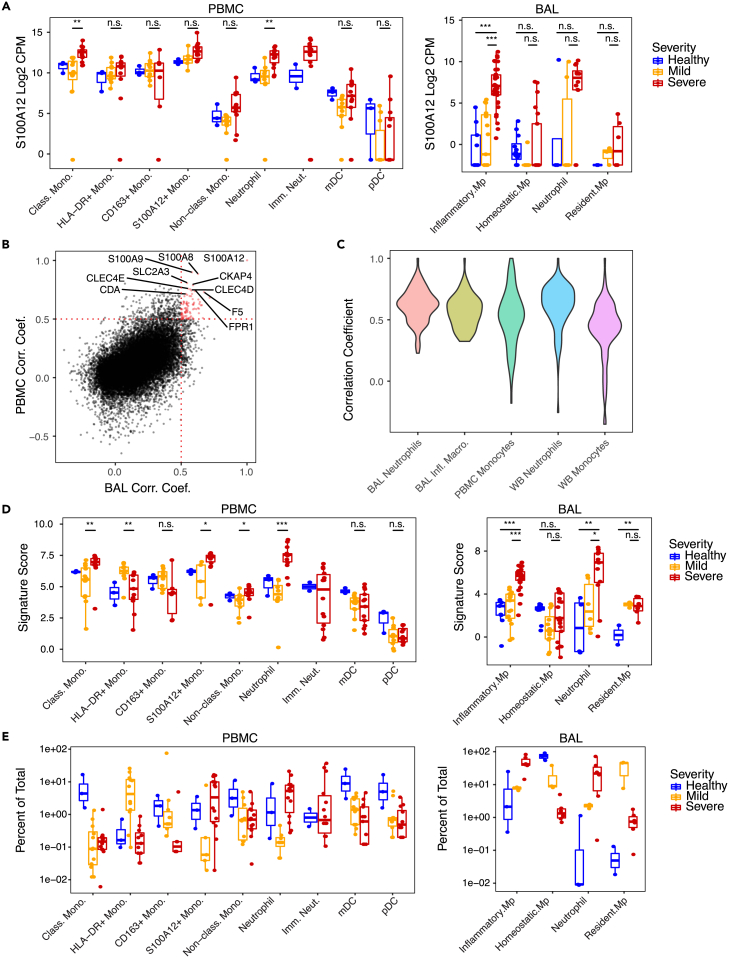
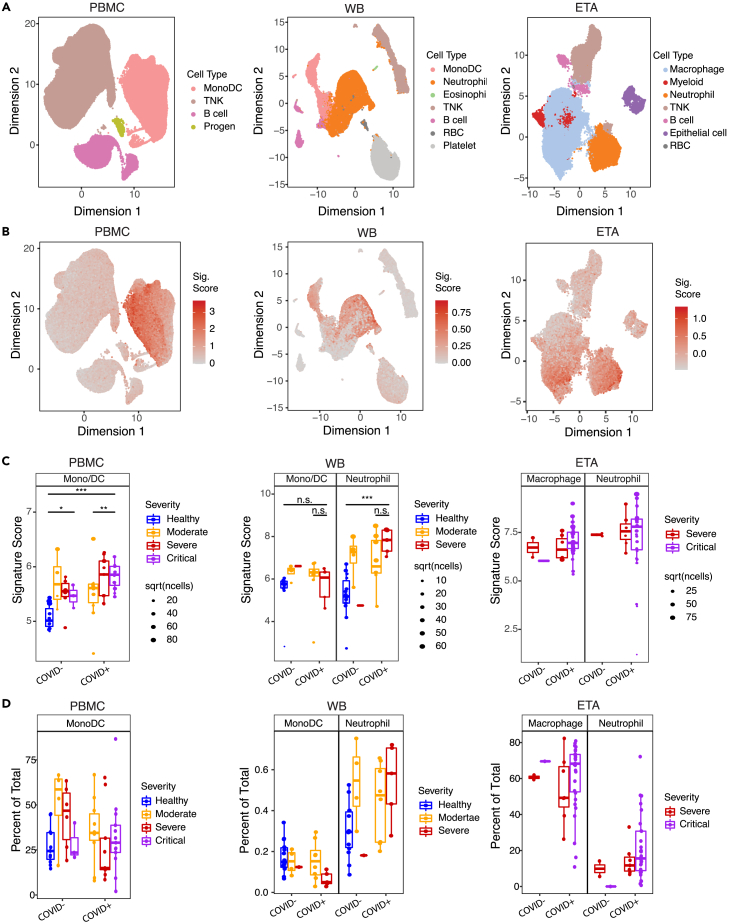
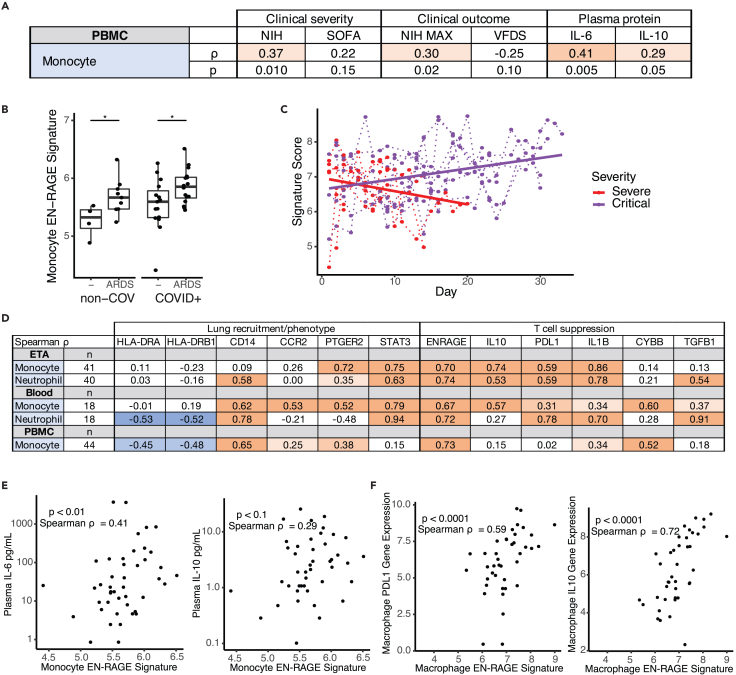
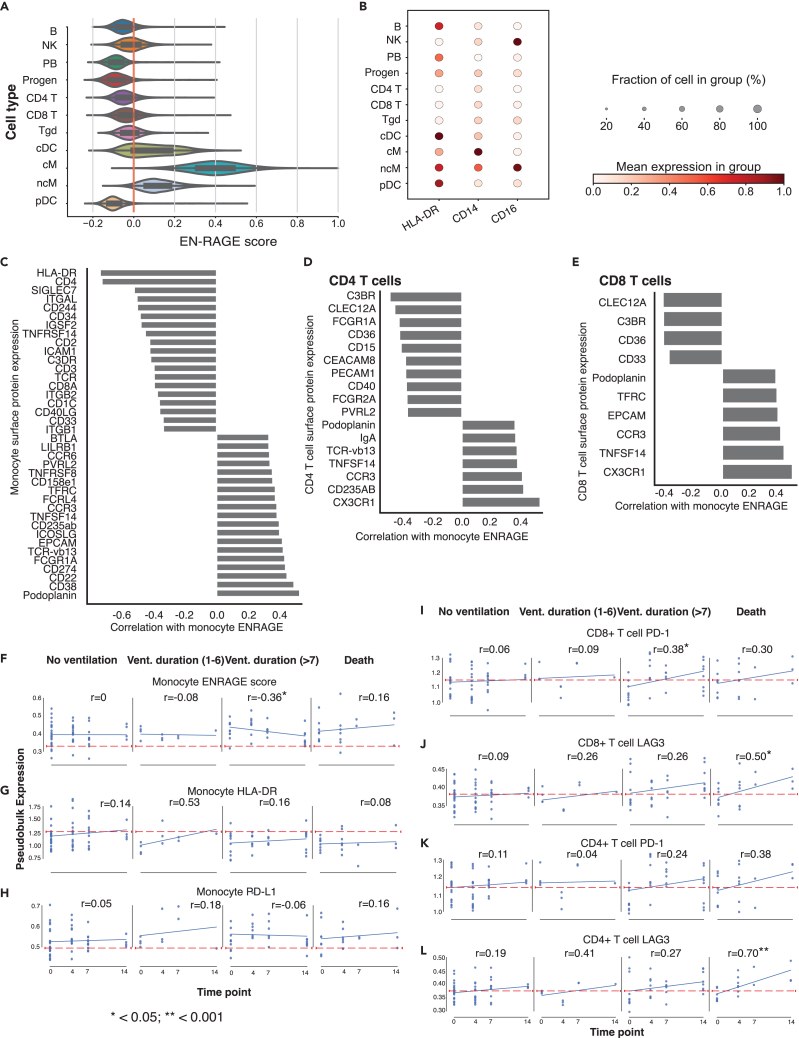
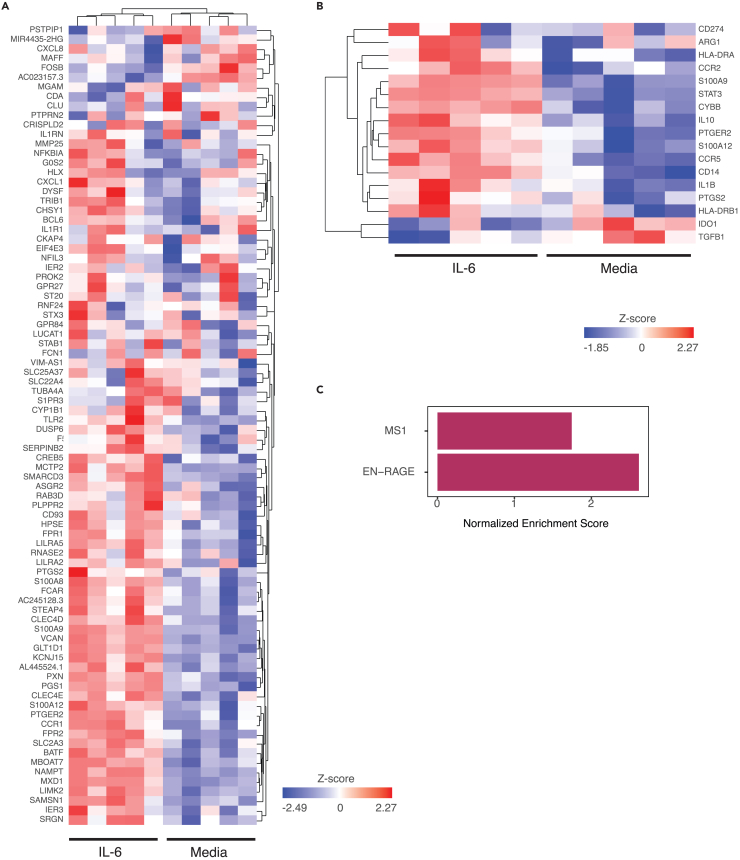
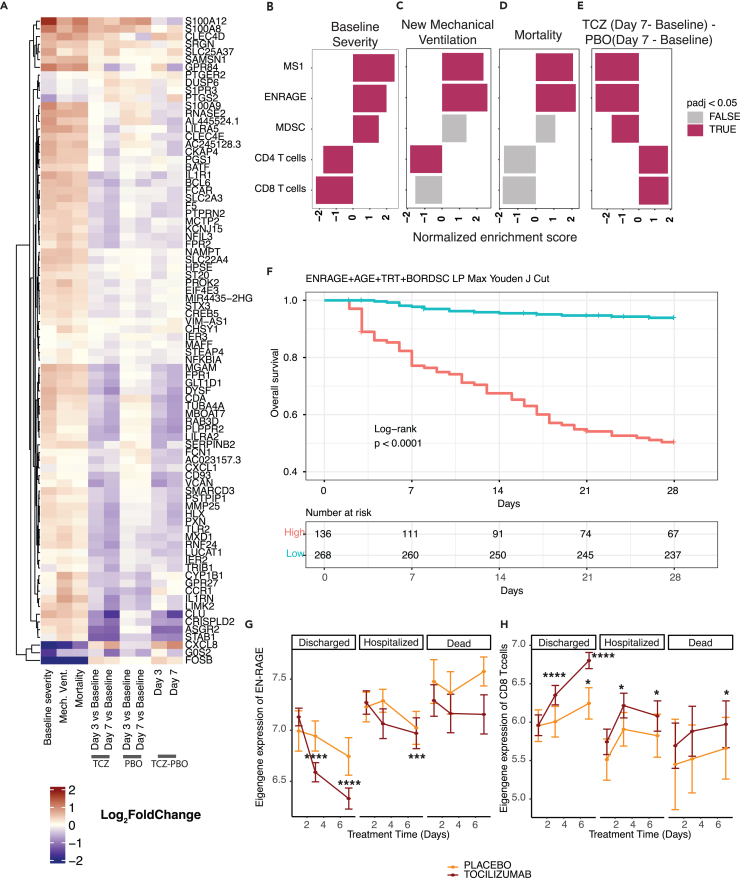
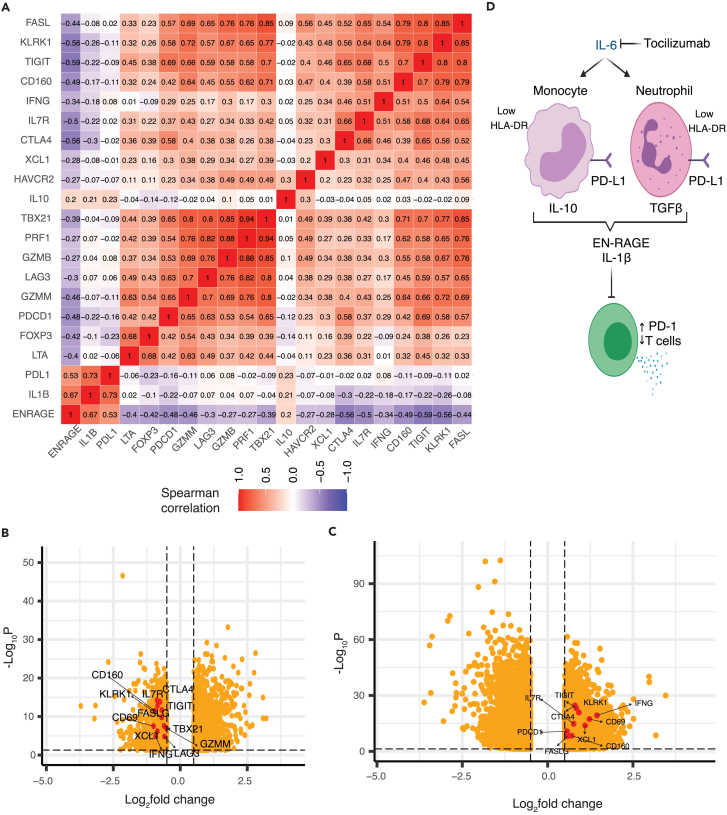
Altered myeloid inflammation and lymphopenia are hallmarks of severe infections. We identified the upregulated EN-RAGE gene program in airway and blood myeloid cells from patients with acute lung injury from SARS-CoV-2 or other causes across 7 cohorts. This program was associated with greater clinical severity and predicted future mechanical ventilation and death. EN-RAGEhi myeloid cells express features consistent with suppressor cell functionality, including low HLA-DR and high PD-L1. Sustained EN-RAGE program expression in airway and blood myeloid cells correlated with clinical severity and increasing expression of T cell dysfunction markers. IL-6 upregulated many EN-RAGE program genes in monocytes in vitro. IL-6 signaling blockade by tocilizumab in a placebo-controlled clinical trial led to rapid normalization of EN-RAGE and T cell gene expression. This identifies IL-6 as a key driver of myeloid dysregulation associated with worse clinical outcomes in COVID-19 patients and provides insights into shared pathophysiological mechanisms in non-COVID-19 ARDS.

Keywords: Clinical genetics; Immune response; Molecular medicine.


Conflict of interest statement

J.A.H., H.S., J.V.H., C.O., L.O., X.G., N.W., A.Q., D.C., A.C, D.F.C., T.R., J.M.M., F.C., A.T., M.B., L.T., A.R., S.B.K., R.N.B., and C.M.R. were employees of Genentech, Inc. at the time of this study and own equity in Roche. The COMET study was supported in part by Genentech funding. C.J.Y. is a scientific advisory board member for and holds equity in Related Sciences and ImmunAI, a consultant for and holds equity in Maze Therapeutics, and a consultant for TRex Bio. C.J.Y. has received research support from Chan Zuckerberg Initiative, Chan Zuckerberg Biohub, and Genentech. C.S.C. has received research funding from Roche-Genentech for an unrelated project as well as from NIH, DOD, and Quantum Leap Healthcare Collaborative. C.S.C. is a consultant for Vasomune, Quark, and GEn1E Lifesciences. C.H. is a consultant for Spring Discovery but does not have any financial interest in the company nor is the work related to what is covered in this manuscript. A.R. is a co-founder and equity holder of Celsius Therapeutics, an equity holder in Immunitas Therapeutics and, until 31 July 2020, was a scientific advisory board member of Thermo Fisher Scientific, Syros Pharmaceuticals, Asimov, and Neogene Therapeutics. A.R. is a named inventor on multiple patents related to single-cell and spatial genomics filed by or issued to the Broad Institute.

Figures

None
Graphical abstract
Figure 1
Figure 1
Identification of the severity-associated EN-RAGE myeloid signature in COVID-19 airway (BAL) and peripheral (PBMC) samples (A) Expression of S100A12 in either PBMC or BAL. Each point represents a patient. Blue = healthy (BAL n = 3; PBMC, n = 3), yellow = moderate/severe (BAL, n = 3; PBMC, n = 8; hospitalized −/+ supplemental O2), red = critical (BAL, n = 6; PBMC, n = 10; requiring mechanical ventilation), with severity defined within each dataset by the authors. Significance was tested using a t test across the indicated groups (n.s. = p > 0.05, ∗ = p < 0.05; ∗∗ = p < 0.01; ∗∗∗ = p < 0.001). Boxes represent the upper and lower quartile of the sample distribution, with the center line showing the median. Whiskers show the most extreme point up to 1.5x the inter-quartile range of the sample distribution. (B) Pairwise Pearson correlation between all genes and S100A12 in either PBMC or BAL. Each point represents a gene measured in both BAL and PBMC samples. Cutoffs for identifying genes in the signature are shown as dotted red lines. Genes that are part of the signature are shown in red, while all other genes are shown in black. Selected signature genes are identified by gene symbol. (C) Pairwise Pearson correlation between genes in the EN-RAGE signature in selected myeloid populations. Each violin represents the distribution of pairwise correlation coefficients across samples within a given myeloid population. (D) Pseudo-bulk expression profiles of EN-RAGE signature in PBMC and BAL. Each point represents a patient. Groups are colored as in panel A above. Significance was tested using a t test across the indicated groups (n.s. = p > 0.05, ∗ = p < 0.05; ∗∗ = p < 0.01; ∗∗∗ = p < 0.001). (E) Frequencies of myeloid populations in either PBMC or BAL. Each point represents a patient sample, colored as in panel (A).
Figure 2
Figure 2
Replication of EN-RAGE severity association across sample types in both COVID-19 and non-COVID-19 acute lung injury (COMET cohort) (A) UMAP plots with cell type annotations. Each point represents a single cell, colored by cell type. Each panel shows a different sample type, as indicated. PBMC: peripheral blood mononuclear cells, WB, whole blood; ETA, endotracheal aspirates. (B) UMAP plots showing EN-RAGE signature score. Each point represented a single cell colored by the expression signature value. (C) Pseudo-bulk expression profiles within myeloid cells. Each point represents the pseudo-bulk gene expression signature score for a cell type in a patient sample. PBMC severity: Moderate = no supplemental O2, severe = supplemental O2 and critical = mechanical ventilation. Whole blood severity: Mild/Moderate = 0 days on ventilator and no more than 1 day in ICU, Severe patients had ≥1 day on ventilator. ETA: Critical = VFDS = 0 (ventilation for ≥28 days or death), severe ETA = VFDS>0. Significance was tested using a t test across the indicated groups (n.s. = p > 0.05, ∗∗ = p < 0.01; ∗∗∗ = p < 0.001). Sample numbers per cohort: PBMC healthy, n = 11; PBMC COVID− moderate, n = 4; PBMC COVID− severe, n = 6; PBMC COVID− critical, n = 3; PBMC COVID+ moderate, n = 12; PBMC COVID+ severe, n = 10; PBMC COVID+ critical, n = 14. WB healthy, n = 14; WB COVID− mild, n = 4; WB COVID− severe, n = 1; WB COVID+ mild, n = 8; WB COVID+ severe, n = 5. ETA COVID− moderate/severe, n = 2; ETA COVID− critical, n = 1; ETA COVID+ moderate/severe, n = 5; ETA COVID+ critical, n = 8. Boxes represent the upper and lower quartile of the sample distribution, with the center line showing the median. Whiskers show the most extreme point up to 1.5x the inter-quartile range of the sample distribution. (D) Frequencies of myeloid populations in either PBMC or BAL. Each point represents a patient sample, colored as in panel (C).
Figure 3
Figure 3
EN-RAGE signature expression correlates with disease severity and immunosuppressive gene expression in myeloid cells (COMET cohort) (A) Spearman correlations between pseudo-bulk EN-RAGE signature score in PBMC monocytes and NIH ordinal severity score, maximal NIH severity score, SOFA organ failure score, and plasma IL-6 and IL-10 protein levels at study enrollment. (B) PBMC monocyte EN-RAGE gene score is higher in patients who develop ARDS (AECC definition) in COVID-19 patients; n = 46. Medians are indicated. ∗ t test p < 0.05. (C) Longitudinal changes in EN-RAGE signature in bulk ETA RNA-seq. Each point represents a patient sample from COVID-19 (n = 16 patients, n = 276 samples) and non-COVID (n = 3 patients, n = 6 samples) patients requiring mechanical ventilation. Samples from the same patient are linked by dotted lines. Points are colored by severity of disease. For illustrative purposes, linear regression trend lines for signature scores over time, grouped by severity level are shown as solid lines. Slopes were significantly different using a linear mixed model, p < 0.05. MV, mechanical ventilation. (D) Table of Spearman correlation coefficients between pseudo-bulk EN-RAGE signature score and genes encoding myeloid effector functions within monocyte or neutrophil populations across endotracheal aspirates (ETA), whole blood, and PBMCs from the COMET cohort. Positive correlations are shaded red and negative correlations shaded blue, with increasing darkness of shading indicating two-tailed p values of p < 0.05, p < 0.01, and p < 0.001. (E) PBMC myeloid EN-RAGE gene score correlates with plasma IL-6 and IL-10 protein; n = 46. (F) Correlation of pseudo-bulk expression signature for EN-RAGE genes compared to pseudo-bulk expression values of IL-10 and PD-L1 in monocytes in COMET tracheal aspirate samples. Each point represents the expression value in a cell type in a single sample; n = 40. Log2 gene expression, Spearman correlation coefficients, and two-tailed p values are shown.
Figure 4
Figure 4
Characterization of myeloid and T cell immunosuppression phenotypes (COMET PBMC cohort) (A) EN-RAGE gene set score is most highly expressed in classical monocytes (cM) in PBMC CITE-seq data. ncM = non-classical monocytes, progen = progenitor cells. Cells were defined by marker genes as previously described. (B) CD14, CD16, and HLA-DR surface protein expression across cell lineages in PBMC CITE-seq data. (C−E) Spearman correlations between EN-RAGE gene set expression in classical monocytes and protein expression on (C) classical monocytes, (D) CD4+ T cells, and (E) CD8+ cells; n = 128 samples, including 11 healthy controls. FDR<0.05 for all correlations, panel of 188 proteins measured. (F–L) Pseudo-bulked surface protein expression in 128 PBMC samples from 60 patients over 14 days in patients grouped by clinical outcomes. Classical monocyte expression of (F) EN-RAGE gene signature, (G). HLA-DR protein, (H) PD-L1 protein. CD8+ T cell expression of (I) PD-1 and (J) LAG3. CD4+ T cell expression of (K) PD-1 and (L) LAG3. Blue line denotes the linear regression trend for gene expression over time. Red line denotes expression level in healthy controls. Vent. duration = days of mechanical ventilation in survivors. n = 128 samples from 60 patients (429, 505 cells). Pearson correlation coefficients (r) and p values are indicated.
Figure 5
Figure 5
EN-RAGE signature genes are induced by in vitro treatment of monocytes with IL-6. Monocytes stimulated with IL-6 for 24 h compared with media, selected genes visualized as a heatmap using unsupervised clustering (A) EN-RAGE signature genes. (B) Genes associated with potential T cell suppressive functionality, from Table S3. (C) FGSEA analysis of EN-RAGE and MS1 signatures in IL-6-treated monocytes. Bars represent the normalized enrichment scores of how much each gene set is regulated by IL-6 treatment (BH adjusted p value for MS1 < 0.01 and EN-RAGE <0.001).
Figure 6
Figure 6
Severity-associated EN-RAGE gene set is associated with poor outcome and decreased by IL-6 blockade in COVID-19 patients (COVACTA cohort) (A) Heatmap of EN-RAGE gene set associations with NIH ordinal scale severity at baseline (Severity NIH), need for new mechanical ventilation in patients not ventilated at baseline (Mech Vent), 28-day mortality (Death), treatment with tocilizumab or placebo at day 3 or day 7 relative to baseline, and tocilizumab (TCZ) vs. placebo at day 7 relative to baseline. (B−E) Gene set enrichment analyses (GSEA) for gene sets associated with the myeloid cell programs EN-RAGE, MS1, and MDSC and T cells (CIBERSORT48). Normalized enrichment scores are shown, with red shading for FDR<0.05. TCZ = tocilizumab. For (C) and (D), analyses were adjusted for baseline severity by incorporating baseline ordinal score as a covariate in our model. F. Kaplan-Meier curve showing differences between high and low risk patients for 28-day mortality. The cut point used to determine high- vs. low-risk patients was determined using Youden’s J index on the ROC curve of a linear predictor defined using a combined risk score incorporating EN-RAGE expression, age, treatment arm, and baseline ordinal severity score. Significance was determined using the log rank test. (G and H) Tocilizumab treatment normalizes EN-RAGE and CD8+ T cell gene expression to healthy levels more rapidly than placebo in survivors. Only patients with measurements for all three time points are included. Lines represent the mean expression value for the gene set signature score across tocilizumab- or placebo-treated subjects. Error bars represent the 95% confidence interval around the mean. Patients are split into those that were discharged before 28, those that remained hospitalized, or subjects that died by day 28. Average signature scores are shown across the first 7 days of treatment. CTRL = healthy controls, SOC = standard of care drug therapy; significance testing was performed using t-test comparing each day to baseline, split by study arm ∗ = p < 0.05, ∗∗ = p < 0.01, ∗∗∗ = p < 0.001, ∗∗∗∗ = p < 0.0001.
Figure 7
Figure 7
IL-6 blockade reduces potential T cell suppressive factors and normalizes T cells in COVID-19 patients (COVACTA cohort) (A) The EN-RAGE program is positively correlated with IL-6-induced suppressive myeloid genes (IL-10, IL-1b, PD-L1) and inversely correlated with T cell genes (FASL, LKRK1, TIGIT, CD160, IFNG, IL7R, CTLA4, XCL1, HAVCR2, TBX21, PRF1, GZMB, LAG3, GZMM, PDCD1, FOXP3). Spearman correlation coefficients are shown for bulk whole blood gene expression. (B and C) Volcano plots of reduced expression of T cell genes shown in (A) (shown in red) in patients with greater baseline severity (requiring positive pressure ventilation) versus lower baseline severity (not requiring positive pressure ventilation) (B) and increased expression of T cell genes following 7 days treatment with tocilizumab (C). Dotted lines indicate absolute >0.5 log2 fold change and FDR<0.05. (D) Working model.

References

    1. Arunachalam P.S., Wimmers F., Mok C.K.P., Perera R.A.P.M., Scott M., Hagan T., Sigal N., Feng Y., Bristow L., Tak-Yin Tsang O., et al. Systems biological assessment of immunity to mild versus severe COVID-19 infection in humans. Science. 2020;369:1210–1220. - PMC - PubMed
    1. Combes A.J., Courau T., Kuhn N.F., Hu K.H., Ray A., Chen W.S., Chew N.W., Cleary S.J., Kushnoor D., Reeder G.C., et al. Global absence and targeting of protective immune states in severe COVID-19. Nature. 2021;591:124–130. doi: 10.1038/S41586-021-03234-7. - DOI - PMC - PubMed
    1. Zheng H., Rao A.M., Dermadi D., Toh J., Murphy Jones L., Donato M., Liu Y., Su Y., Dai C.L., Kornilov S.A., et al. Multi-cohort analysis of host immune response identifies conserved protective and detrimental modules associated with severity across viruses. Immunity. 2021;54:753–768.e5. doi: 10.1016/j.immuni.2021.03.002. - DOI - PMC - PubMed
    1. MacDonald L., Alivernini S., Tolusso B., Elmesmari A., Somma D., Perniola S., Paglionico A., Petricca L., Bosello S.L., Carfì A., et al. COVID-19 and RA share an SPP1 myeloid pathway that drives PD-L1+ neutrophils and CD14+ monocytes. JCI Insight. 2021;6 doi: 10.1172/jci.insight.147413. - DOI - PMC - PubMed
    1. Delorey T.M., Ziegler C.G.K., Heimberg G., Normand R., Yang Y., Segerstolpe Å., Abbondanza D., Fleming S.J., Subramanian A., Montoro D.T., et al. COVID-19 tissue atlases reveal SARS-CoV-2 pathology and cellular targets. Nature. 2021;595:107–113. doi: 10.1038/s41586-021-03570-8. - DOI - PMC - PubMed