. 2023 Sep 19;26(10):107966.
doi: 10.1016/j.isci.2023.107966. eCollection 2023 Oct 20.

The senescent secretome drives PLVAP expression in cultured human hepatic endothelial cells to promote monocyte transmigration

Affiliations

The senescent secretome drives PLVAP expression in cultured human hepatic endothelial cells to promote monocyte transmigration

Alex L Wilkinson et al. iScience. .

Abstract

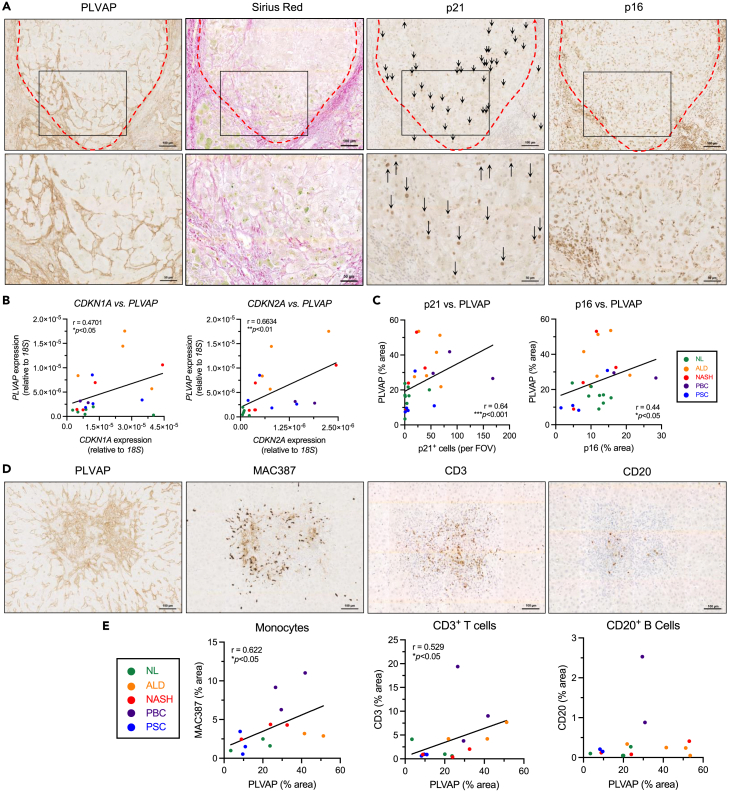
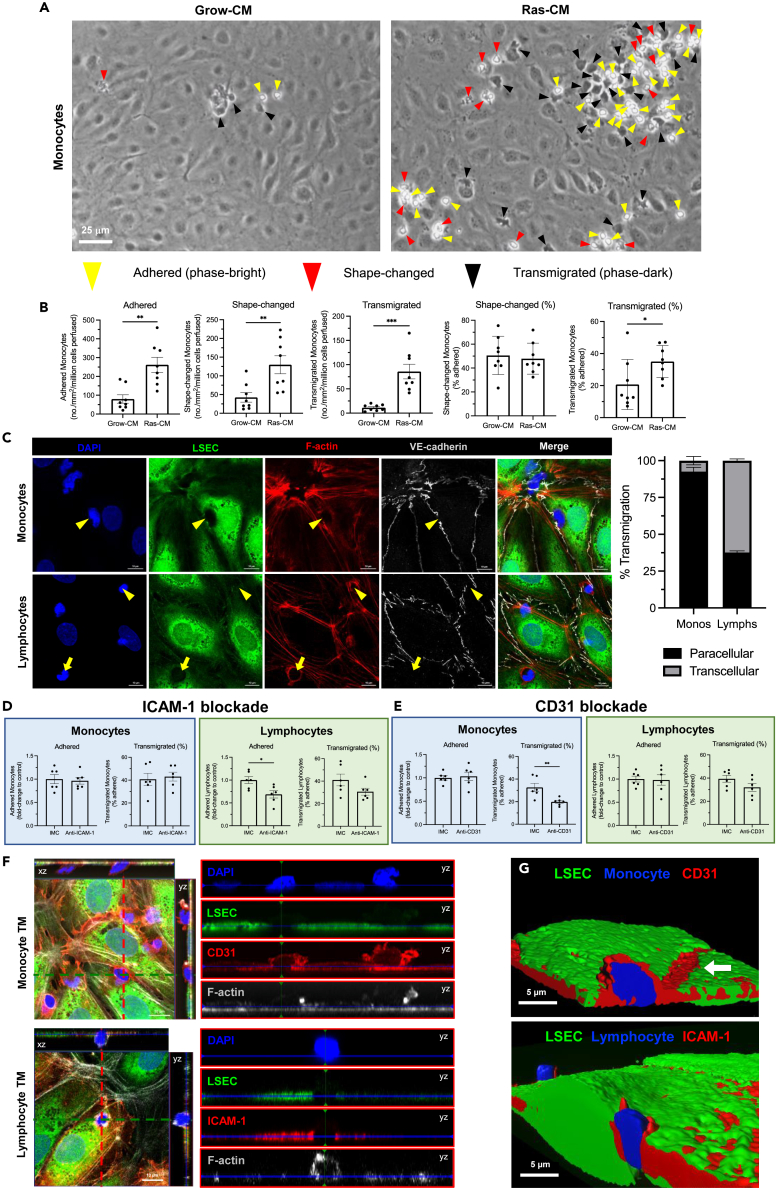
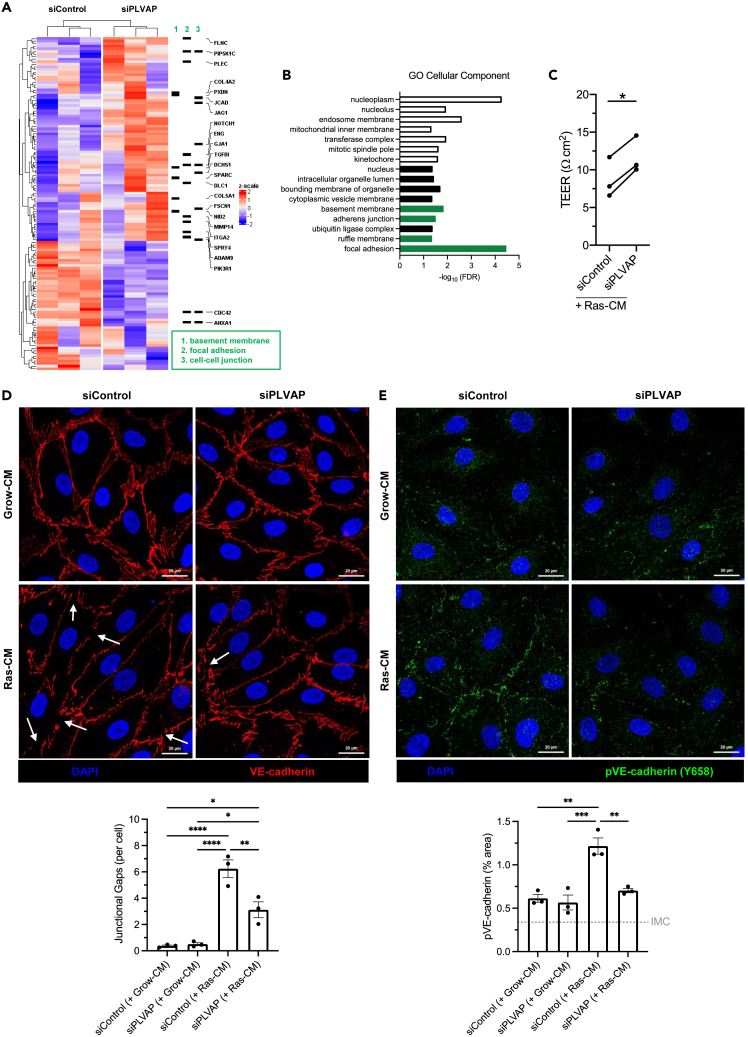
Liver sinusoidal endothelial cells (LSEC) undergo significant phenotypic change in chronic liver disease (CLD), and yet the factors that drive this process and the impact on their function as a vascular barrier and gatekeeper for immune cell recruitment are poorly understood. Plasmalemma-vesicle-associated protein (PLVAP) has been characterized as a marker of LSEC in CLD; notably we found that PLVAP upregulation strongly correlated with markers of tissue senescence. Furthermore, exposure of human LSEC to the senescence-associated secretory phenotype (SASP) led to a significant upregulation of PLVAP. Flow-based assays demonstrated that SASP-driven leukocyte recruitment was characterized by paracellular transmigration of monocytes while the majority of lymphocytes migrated transcellularly. Knockdown studies confirmed that PLVAP selectively supported monocyte transmigration mediated through PLVAP's impact on LSEC permeability by regulating phospho-VE-cadherin expression and endothelial gap formation. PLVAP may therefore represent an endothelial target that selectively shapes the senescence-mediated immune microenvironment in liver disease.

Keywords: Cell biology; Microenvironment; Molecular biology; Omics; Transcriptomics.


Conflict of interest statement

S.S. is a consultant for Faron Pharmaceuticals.

Figures

None
Graphical abstract
Figure 1
Figure 1
Plasmalemma-vesicle-associated protein (PLVAP) is upregulated in chronic liver disease (CLD) and displays a scar-associated expression pattern (A) PLVAP gene expression in normal liver (NL) (n = 6) versus cirrhotic liver (n = 24) was measured relative to 18S by qRT-PCR. Data shown are median ± IQR (∗∗∗p < 0.001, Mann-Whitney test). (B) Quantification of PLVAP immunohistochemical (IHC) staining (% area) in NL (n = 6) and CLD (n = 14) tissue (mean ± SEM, ∗∗∗p < 0.001 Student’s unpaired t test). Isotype-matched control (IMC) level is indicated by the gray gridline. (C) Correlation between PLVAP and Sirius Red staining (% area) in matched patient samples (∗∗∗∗p < 0.0001, Pearson’s correlation test). (D) Representative IHC images of PLVAP and Sirius Red in matched serial sections from normal (upper) and cirrhotic (lower) human liver. Fibrotic septa are indicated by red dashed lines. Scale bars: 200 μm left and middle column, 100 μm right column. (E) Dual immunofluorescent staining of PLVAP (red) with CD31 (left), L-SIGN (middle), and LYVE-1 (right) (green) in cirrhotic liver. DAPI (blue) was used as a nuclear counterstain. Yellow lines depict site of the intensity profiles (lower). Scale bars: 50 μm.
Figure 2
Figure 2
Plasmalemma-vesicle-associated protein (PLVAP) correlates with senescence and immune infiltrate in chronic liver disease (CLD) (A) Representative low (upper) and high (inset, lower) power images of immunohistochemical staining of PLVAP, Sirius Red, and senescence markers, p21 and p16, in serial sections from matched CLD patient samples. Scale bars: 100 μm top row, 50 μm bottom row. (B) Correlation analysis of PLVAP versus p21 (CDKN1A) (left) and PLVAP versus p16 (CDKN2A) (right) mRNA levels in normal liver (NL) (n = 5) and CLD (n = 15). Gene expression was measured relative to 18S by qPCR (∗p < 0.05, ∗∗p < 0.01, Spearman’s correlation test). (C) Correlation analysis of PLVAP versus p21 (left) (n = 27) and PLVAP versus p16 (right) (n = 24) immunohistochemical staining in normal liver (NL) and CLD (∗p < 0.05, ∗∗∗p < 0.001, Spearman’s correlation test). (D) Representative immunohistochemical staining of PLVAP, MAC387 (infiltrating monocytes), CD3 (T cells), and CD20 (B cells) (from left to right) in serial sections from cirrhotic liver patient samples. Visual fields are the same for each marker. Scale bars: 100 μm. (E) Correlation analysis of PLVAP staining area (%) with MAC387, CD3, and CD20 (from left to right) in normal liver (NL) (n = 3) and CLD (n = 11–12) (∗p < 0.05, Spearman’s correlation test).
Figure 3
Figure 3
Plasmalemma-vesicle-associated protein (PLVAP) is maintained in vitro in primary liver sinusoidal endothelial cells (LSEC) and is upregulated by the senescent secretome (A) PLVAP gene expression in passaged LSEC, activated liver myofibroblasts (aLMF), hepatic stellate cells (HSC), and biliary epithelial cells (BEC) relative to GAPDH (n = 5). Data shown are mean ± SEM (∗∗∗∗p < 0.0001, one-way ANOVA followed by Holm-Šídák’s multiple comparisons test). (B) Confocal images of PLVAP (red) immunofluorescence (white arrowheads) in patient-derived LSEC (25x objective) (left) and with junctional marker, VE-cadherin (green) (right) (63× objective). DAPI (blue) was used as a nuclear counterstain. Scale bars: 20 μm. (C) PLVAP gene expression relative to GAPDH in LSEC following 24 h treatment with the senescent secretome (Ras-CM) or the growing control (Grow-CM) (∗p < 0.05, Wilcoxon test) (n = 7). (D) PLVAP immunofluorescence area (left) and intensity (right) following Grow-CM or Ras-CM treatment. Staining was quantified via high-content imaging where nine visual fields per well were analyzed, with each condition performed in at least duplicate. Data shown are mean ± SEM from four independent cell isolates (∗p < 0.05, Student’s unpaired t test (area) or Mann-Whitney test (intensity). Isotype-matched control (IMC) levels are indicated by the gray gridline. (E) Representative immunofluorescent images of PLVAP (green) in LSEC following 24 h Grow-CM or Ras-CM treatment. DAPI (blue) was used as a nuclear counterstain. Scale bars:100 μm.
Figure 4
Figure 4
The senescent secretome drives recruitment of lymphocytes and monocytes across primary human liver sinusoidal endothelial cells (LSEC) by distinct molecular mechanisms (A) Flow adhesion assays were performed with peripheral blood monocytes and primary LSEC following Grow-CM or Ras-CM stimulation for 24 h. Representative phase-contrast images are shown indicating adhered (yellow arrowheads), shape-changed (red arrowheads), and transmigrated (black arrowheads) monocytes. Scale bar: 25 μm. (B) Quantification of adhered, shape-changed, and transmigrated monocytes following flow assays with Grow-CM- or Ras-CM-treated LSEC. Data shown are mean ± SEM from six independent experiments where 10 visual fields were analyzed per condition (∗p < 0.05, ∗∗p < 0.01, ∗∗∗p < 0.001, Mann-Whitney test (adhered and % transmigrated) or Student’s unpaired t test). (C) Confocal images of LSEC pre-labeled with CellTracker Green (green) and SiR-actin (red) following flow assays with monocytes (upper) or lymphocytes (lower). Paracellular (yellow arrowheads) and transcellular (yellow arrows) transmigration (TM) was determined based on integrity of VE-cadherin+ intercellular junctions (gray). Quantification of transmigratory route as a percentage of total TM events is shown (159 lymphocyte events and 327 monocyte events). Data are mean ± SEM from three independent cell isolates. Scale bars: 10 μm. (D) Quantification of adhered and transmigrated (% adhered) monocytes (left) and lymphocytes (right) following antibody-mediated blockade of intercellular adhesion molecule 1 (ICAM-1) (∗p < 0.05, Mann-Whitney test). (E) Quantification of adhered and transmigrated (% adhered) monocytes (left) and lymphocytes (right) following antibody-mediated blockade of CD31 (∗∗p < 0.01, Student’s unpaired t test). (F) Orthogonal confocal images of monocyte (upper) and lymphocyte (lower) TM. LSEC were pre-labeled with CTG (green) and SiR-actin (gray). CD31 (upper) and ICAM-1 (lower) were stained post-fixation (red). (G) 3D rendered images of z-stacks showing monocyte (upper) and lymphocyte (lower) TM in association with CD31 and ICAM-1, respectively (red). Scale bars: 10 μm left column, 5 μm right column.
Figure 5
Figure 5
Plasmalemma-vesicle-associated protein (PLVAP) mediates monocyte, but not lymphocyte, transmigration across patient-derived liver sinusoidal endothelial cells (LSEC) in response to the senescent secretome (A) Genetic knockdown of PLVAP was performed via siRNA transfection of LSEC, and efficiency was validated at the mRNA and protein level by qRT-PCR and immunofluorescence, respectively (∗∗p < 0.01, ∗∗∗∗p < 0.0001, Student’s unpaired t test). Scale bars: 100 μm. (B) Flow adhesion assays were performed following PLVAP knockdown (siPLVAP) with Ras-CM-treated LSEC and either monocytes or lymphocytes. Representative phase-contrast images of monocytes are shown. Adhered and transmigrated (% adhered) monocytes and lymphocytes were quantified in 10 visual fields per lane with each condition performed in duplicate. Data shown are mean ± SEM from 3 to 4 independent experiments (∗∗∗p < 0.001, Student’s unpaired t test). Scale bar: 25 μm. (C) Quantification of antibody binding (% area) following treatment of live LSEC with an anti-PLVAP antibody or isotype-matched control (IMC). Cells were then fixed, permeabilized, and stained with an anti-mouse Alexa Fluor 488 secondary antibody. Representative images are shown. Data are mean ± SEM from three independent experiments (∗p < 0.05, Student’s unpaired t test). Scale bars: 20 μm. (D) Flow adhesion assays were performed following antibody-mediated PLVAP blockade with Ras-CM-treated LSEC and either monocytes or lymphocytes. Representative phase-contrast images of monocytes are shown. Adhered and transmigrated (% adhered) monocytes and lymphocytes were quantified in 10 visual fields per lane with each condition performed in duplicate. Data shown are mean ± SEM from three independent experiments (∗p < 0.05, Student’s unpaired t test). Scale bar: 25 μm. (E) Dual immunofluorescent staining of PLVAP (green) and MAC387 (red) in human liver cirrhosis. DAPI (blue) was used as a nuclear counterstain. Scale bars: 100 μm left panel, 20 μm right panel.
Figure 6
Figure 6
Plasmalemma-vesicle-associated protein (PLVAP) regulates endothelial paracellular permeability by altering intercellular junctions (A) Genetic knockdown of PLVAP was performed via siRNA transfection of LSEC (n = 3), and RNA was extracted and subject to bulk RNA sequencing. Heatmap indicates significant differential gene expression, and specific genes from gene ontology pathway analysis are highlighted. (B) Gene ontology (GO) cellular component pathway analysis. Unfilled bars indicate downregulation, and filled bars indicate upregulation in siPLVAP cells. Relevant pathways are highlighted in green. (C) Transendothelial electrical resistance (TEER) of LSEC monolayers following PLVAP knockdown (siPLVAP) or negative control (siControl) in the presence (Ras-CM) or absence (Grow-CM) of the senescent secretome. Data shown are mean fold-change to control ±SEM from three independent LSEC isolates (∗p < 0.05, paired t test). (D) Confocal images of VE-cadherin (red) in LSEC following PLVAP knockdown and 24 h Ras-CM treatment. DAPI (blue) was used as a nuclear counterstain. Junctional gaps (lower) were scored manually for six visual fields per condition and normalized to the cell count. Data shown are mean ± SEM from three independent LSEC isolates (∗p < 0.05, ∗∗∗∗p < 0.0001, one-way ANOVA and Tukey’s post-hoc test). Scale bars: 20 μm. (E) Confocal images of phospho-VE-cadherin (Y658) (green) in LSEC following PLVAP knockdown and 24 h Ras-CM treatment. DAPI (blue) was used as a nuclear counterstain. pVE-cadherin % staining area (lower) was quantified for six visual fields per condition. Isotype-matched control (IMC) level is indicated by the gray gridline. Data shown are mean ± SEM from three independent LSEC isolates (∗∗p < 0.01, ∗∗∗p < 0.001, one-way ANOVA and Tukey’s post-hoc test).

References

    1. Asrani S.K., Devarbhavi H., Eaton J., Kamath P.S. Burden of liver diseases in the world. J. Hepatol. 2019;70:151–171. - PubMed
    1. Geneva World Health Organisation 2020. https://www.who.int/data/gho/data/themes/mortality-and-global-health-est...
    1. O'Rourke J.M., Sagar V.M., Shah T., Shetty S. Carcinogenesis on the background of liver fibrosis: Implications for the management of hepatocellular cancer. World J. Gastroenterol. 2018;24:4436–4447. - PMC - PubMed
    1. International Agency for Research on Cancer GLOBOCAN . 2018. https://gco.iarc.fr/today/online-analysis-map?v=2020&mode=population&mod...
    1. Shetty S., Lalor P.F., Adams D.H. Liver sinusoidal endothelial cells - gatekeepers of hepatic immunity. Nat. Rev. Gastroenterol. Hepatol. 2018;15:555–567. - PMC - PubMed