. 2023 Oct 17;95(41):15180-15188.
doi: 10.1021/acs.analchem.3c01701. Epub 2023 Oct 9.

Deep Proteomic Compound Profiling with the Orbitrap Ascend Tribrid Mass Spectrometer Using Tandem Mass Tags and Real-Time Search

Affiliations

Deep Proteomic Compound Profiling with the Orbitrap Ascend Tribrid Mass Spectrometer Using Tandem Mass Tags and Real-Time Search

Steven R Shuken et al. Anal Chem. .

Abstract

Tandem mass tags (TMT) and tribrid mass spectrometers are a powerful combination for high-throughput proteomics with high quantitative accuracy. Increasingly, this technology is being used to map the effects of drugs on the proteome. However, the depth of proteomic profiling is still limited by sensitivity and speed. The new Orbitrap Ascend mass spectrometer was designed to address these limitations with a combination of hardware and software improvements. We evaluated the performance of the Ascend in multiple contexts including deep proteomic profiling. We found that the Ascend exhibited increased sensitivity, yielding higher signal-to-noise ratios than the Orbitrap Eclipse with shorter injection times. As a result, higher numbers of peptides and proteins were identified and quantified, especially with low sample input. TMT measurements had significantly improved signal-to-noise ratios, improving quantitative precision. In a fractionated 16plex sample that profiled proteomic differences across four human cell lines, the Ascend was able to quantify hundreds more proteins than the Eclipse, many of them low-abundant proteins, and the Ascend was able to quantify >8000 proteins in 30% less instrument time. We used the Ascend to analyze 8881 proteins in HCT116 cancer cells treated with covalent sulfolane/sulfolene inhibitors of peptidyl-prolyl cis-trans isomerase NIMA-interacting 1 (PIN1), a phosphorylation-specific peptidyl-prolyl cis-trans isomerase implicated in several cancers. We characterized these PIN1 inhibitors' effects on the proteome and identified discrepancies among the different compounds, which will facilitate a better understanding of the structure-activity relationship of this class of compounds. The Ascend was able to quantify statistically significant, potentially therapeutically relevant changes in proteins that the Eclipse could not detect.


Conflict of interest statement

The authors declare the following competing financial interest(s): G.C.M., W.D.B., J.D.C., D.B., J.H., R.H., and V.Z. are employees of Thermo Fisher Scientific, the manufacturer of the Orbitrap Ascend Tribrid mass spectrometer.

Figures

Figure 1.
Figure 1.
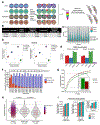
TMT analysis in the Orbitrap Ascend mass spectrometer. (A) Schematic of an 18plex experiment in which compound treatments are assessed in triplicate with an RTS-SPS-MS3 method. CID is collision-induced dissociation. RTS = real-time search. SPS = synchronous precursor selection. HCD = higher-energy CID. (B) Diagram of the Orbitrap Ascend with new features highlighted with italic text, components labeled with nonitalic text, and isolation/fragmentation/analysis events highlighted with colored boxes.
Figure 2.
Figure 2.
Eclipse vs Ascend comparison using an unfractionated two-proteome mixture. (A) Schematic of two-proteome sample preparation. (B) Measured TMT ratios for defined 3:2 (1.5) yeast peptides. Each dot is a peptide, and the ratio of values averaged across triplicate channels is plotted along the y-axis. Only yeast peptides identified by both instruments are shown. SD is the standard deviation. Sum SN is the sum of TMT peak signal-to-noise ratios. P-value from the two-sided F test. (C) Counts of scans, peptides, and proteins. (D) Median injection times and signal levels in RTS-MS3 data. Precursor max intensity = intensity at chromatographic peak apex.
Figure 3.
Figure 3.
Four-cell-line experiment. (A) Schematic of sample preparation. (B) MS3, peptide, and protein counts. (C) TMT summed signal-to-noise (Sum SN) distributions. Horizontal line = median. (D) PCA plots. (E) Example bar plot of protein quantification. GMDS = GDP-mannose 4,6 dehydratase. RA = relative abundance. (F) Peptide quantification events (i.e., MS3 scans) throughout the 12-fraction acquisition, color-coded according to whether a new protein (i.e., not quantified in preceding fractions) was quantified in the event. (G) Cumulative protein quantifications by fraction. Inset: time per proteome (# fractions x 65 min/16 proteomes) at >8000 proteins. (H) iBAQ quantity distributions for proteins quantified by both instruments, by the Eclipse only, or by the Ascend only. (I) Protein and peptide counts for 7-fraction experiments with two different gradient lengths. Total method lengths: 75 min for 65 min gradient and 90 min for 85 min gradient.
Figure 4.
Figure 4.
Covalent PIN1 inhibitor treatment with Eclipse and Ascend. (A) Experimental workflow. (B) Peptide and protein counts. (C) PCA comparison at compound and instrument levels. (D) Log 2 (FC) from CL41 treatment measured by Eclipse vs Ascend. (E) Quantification of c-Myc, PDE4B, and ODC1, all involved in the oncogenic Ras pathway. The asterisk signifies p < 0.05 (two-sided t-test).
Figure 5.
Figure 5.
Biological effects of PIN1 inhibitor treatment in HCT116 cells. (A) Volcano plot showing effects of CL41 treatment. FC = fold change. BH = Benjamini–Hochberg. (B) Significantly changed protein counts (FDR < 0.05 and |log2 (FC)| > 0.5) by compound and instrument. (C) Quantification of FGFR1 and scheme of the role of FGFR1 in the oncogenic Ras pathway. (D) Venn diagram of significantly changed proteins with each compound. (E) Gene Ontology enrichment analysis for biological pathways of significantly changed proteins with treatment of CL71 and CL41. Identical biological pathways are connected by black lines. FDR was calculated using the PANTHER web application.

References

    1. Frantzi M; Latosinska A; Mischak H Proteomics: Clin. Appl 2019, 13, 1800087. - PubMed
    1. Saei AA; Beusch CM; Chernobrovkin A; Sabatier P; Zhang B; Tokat ÜG; Stergiou E; Gaetani M; Végvári Á; Zubarev RA Nat. Commun 2019, 10, 5715. - PMC - PubMed
    1. Mitchell DC; Kuljanin M; Li J; Van Vranken JG; Bulloch N; Schweppe DK; Huttlin EL; Gygi SP Nat. Biotechnol 2023, 41, 845–857. - PMC - PubMed
    1. Zecha J; Bayer FP; Wiechmann S; Woortman J; Berner N; Müller J; Schneider A; Kramer K; Abril-Gil M; Hopf T; et al. Science 2023, 380, 93–101. - PMC - PubMed
    1. Thompson A; Schäfer J; Kuhn K; Kienle S; Schwarz J; Schmidt G; Neumann T; Hamon C Anal. Chem 2003, 75, 1895–1904. - PubMed

Publication types