. 2023 Nov 10;51(20):11239-11257.
doi: 10.1093/nar/gkad772.

Alternative splicing of BCL-x is controlled by RBM25 binding to a G-quadruplex in BCL-x pre-mRNA

Affiliations

Alternative splicing of BCL-x is controlled by RBM25 binding to a G-quadruplex in BCL-x pre-mRNA

Ronan Le Sénéchal et al. Nucleic Acids Res. .

Abstract

BCL-x is a master regulator of apoptosis whose pre-mRNA is alternatively spliced into either a long (canonical) anti-apoptotic Bcl-xL isoform, or a short (alternative) pro-apoptotic Bcl-xS isoform. The balance between these two antagonistic isoforms is tightly regulated and overexpression of Bcl-xL has been linked to resistance to chemotherapy in several cancers, whereas overexpression of Bcl-xS is associated to some forms of diabetes and cardiac disorders. The splicing factor RBM25 controls alternative splicing of BCL-x: its overexpression favours the production of Bcl-xS, whereas its downregulation has the opposite effect. Here we show that RBM25 directly and specifically binds to GQ-2, an RNA G-quadruplex (rG4) of BCL-x pre-mRNA that forms at the vicinity of the alternative 5' splice site leading to the alternative Bcl-xS isoform. This RBM25/rG4 interaction is crucial for the production of Bcl-xS and depends on the RE (arginine-glutamate-rich) motif of RBM25, thus defining a new type of rG4-interacting domain. PhenDC3, a benchmark G4 ligand, enhances the binding of RBM25 to the GQ-2 rG4 of BCL-x pre-mRNA, thereby promoting the alternative pro-apoptotic Bcl-xS isoform and triggering apoptosis. Furthermore, the screening of a combinatorial library of 90 putative G4 ligands led to the identification of two original compounds, PhenDH8 and PhenDH9, superior to PhenDC3 in promoting the Bcl-xS isoform and apoptosis. Thus, favouring the interaction between RBM25 and the GQ-2 rG4 of BCL-x pre-mRNA represents a relevant intervention point to re-sensitize cancer cells to chemotherapy.


Figures

Graphical Abstract
Graphical Abstract
Figure 1.
Figure 1.
GQ-2 is an rG4 that may form in close proximity to the alternative splice site that leads to the synthesis of Bcl-xS, the short alternative pro-apoptotic isoform of Bcl-x. (A) Schematic representation of the BCL-x gene. The two alternative 5′ splice sites in the exon 2 are indicated (xS 5′ss is highlighted in blue and xL 5′ss in red) as well as the two putative rG4 (GQ-2 and GQ-5) that may assemble at close proximity to these two splice sites. GQ-1 (written in grey) is a putative quadruplex sequence (PQS), as predicted by G4-finder, which has not been confirmed in vitro. (B) Sequences of the various RNA oligonucleotides that have been used for RNA pulldown experiments. The various sequences, together with their predicted propensity to form G4 (as determined using two different software: G-score and G4-hunter) are indicated and the guanines potentially important for G4 formation are underlined. (C) TDS (ΔAbs = Abs (80°C) − Abs (20°C)) of GQ-2 and GM-2 RNA oligonucleotides (4 μM) in 10 mM lithium cacodylate buffers supplemented with 100 mM KCl (solid lines) or 100 mM LiCl (dashed lines). G4-characteristic peaks are indicated with asterisks. (D) UV-melting analysis of GQ-2 (4 μM) in the presence of various concentrations of K+ as indicated.
Figure 2.
Figure 2.
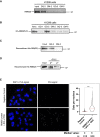
RBM25 selectively binds to GQ-2 rG4 in a G4-dependent manner (A) RNA pulldown of extracts from H1299 cells using the indicated RNA oligonucleotide matrices. The proteins still bound after an 800 mM KCl wash were eluted and analysed by sodium dodecyl sulphate-polyacrylamide gel electrophoresis (SDS–PAGE) and western blot using an anti-RBM25 antibody to reveal endogenous RBM25. Gel represents n≥ 3. (B) Same RNA pulldown experiment as in (A) except that extracts from H1299 cells transfected by a plasmid allowing expression of HA-tagged RBM25 (HA-RBM25-FL) were used. Exogenous HA-RBM25-FL was revealed using an anti-HA antibody. Gel represents n≥ 3. (C) The same RNA pulldown experiment as in (A) and (B) except that a recombinant polyhistidine-tagged RBM25 protein (His-RBM25) was used instead of extracts from H1299 cells. Gel represents n≥ 3. (D) Control experiment using the GQ-2 matrix folded in the presence of 100 mM KCl (that favours G4 formation) or 100 mM LiCl (that does not favour formation of G4), as indicated, and recombinant His-RBM25. Gel represents n≥ 3. (E) Adaptation of the PLA to monitor the RBM25 protein-BCL-x mRNA interaction performed in H1299 cells natively expressing RBM25 protein and BCL-x mRNA. Microscopy images of H1299 cells analysed using a probe specifically hybridizing to the BCL-x RNA (lower panels) or not (upper panels, negative controls) as indicated. Nuclei were revealed by DAPI staining and appear in blue. White dots (PLA signals) indicated interaction (close proximity) between RBM25 protein and BCL-x RNA. The graph on the right indicates the number of PLA dots per cell in each condition. Data from three biological replicates, at least 250 cells per sample, were analysed by a non-parametric Mann–Whitney's test using the GraphPad Prism 8 Software (***P< 0.0001).
Figure 3.
Figure 3.
GQ-2 rG4 is required for both RBM25 binding and synthesis of the alternative pro-apoptotic Bcl-xS isoform (A) Schematic representation of the BCL-x gene with the two alternative 5′ splice sites in the exon 2 indicated (xS 5′ss in blue and xL 5′ss in red) as well as the GQ-2 rG4. (B) Schematic representation of the Bcl-x 672 WT (upper panel) and Bcl-x 672 GM-2 (lower panel) minigenes. The only differences between the WT and the GM-2 minigenes are the replacement of three guanines critical for GQ-2 rG4 formation by three adenines (highlighted in red). (C) Semi-quantitative RT–PCR experiment from HeLa cells transfected by the WT or GM-2 minigene, as indicated, to determine the relative proportion of the Bcl-xS and Bcl-xL isoforms synthesized from the minigenes. The PCR products were analysed by electrophoresis in a 1% agarose gel, revealed by an ethidium bromide staining and quantified by densitometry. An image of a resulting gel is shown (n≥ 3). (D) Same semi-quantitative RT–PCR experiment as in (C) except that, in addition to the WT or GM-2 minigene, HeLa cells were also transfected by the indicated quantities of a plasmid allowing expression of HA-tagged RBM25 wt (HA-RBM25-FL) or, as a control, by an empty plasmid. The result of the semi-quantitative RT–PCR experiment is shown in the upper panel and western blot analysis of the level of expression of HA-RBM25-FL, as compared to the loading control GAPDH, is shown in the two lower panels (n≥ 3). (E) Same PLA experiments as in Figure 2E, except that H1299 cells were transfected by a GFP-encoding plasmid that also express the WT or the GM-2 minigene, as indicated. Microscopy images of cells analysed using a probe specifically hybridizing to the BCL-x RNA transcribed from the minigenes. GFP signal indicates cells that were efficiently transfected and nuclei were revealed by DAPI staining and appear in blue. White dots (PLA signals) indicated interaction (close proximity) between the RBM25 protein and the BCL-x RNA transcribed from the minigene. The graph on the right indicates the number of PLA dots per cells in each condition. Data from two biological replicates, at least 35 GFP+ cells per sample, were analysed by a non-parametric Mann–Whitney's test using the GraphPad Prism 8 Software (***P< 0.0001).
Figure 4.
Figure 4.
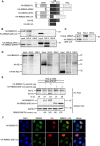
The RE domain of RBM25 is necessary and sufficient for binding to GQ-2 rG4. (A) Schematic representation of the RBM25 protein with its three motifs known to potentially interact with nucleic acids (RRM, RE and PWI) and of the various constructions used for the determination of the role of each of these three domains in binding to GQ-2 rG4. All the constructs are N-terminally HA-tagged (HA tag written in grey and represented as a hatched box). (B) Same RNA pulldown experiments as in Figure 2B using the GQ-2 or GM-2 matrices as indicated except that, in addition to H1299 cells transfected with an HA-tagged RBM25 (HA-RBM25-FL)-encoding plasmid, H1299 cells transfected with one or the other of the plasmids expressing the various HA-tagged forms of RBM25 deleted for one of its three domains were also used. The proteins still bound after an 800 mM KCl wash were eluted and analysed by SDS–PAGE and western blot using an anti-HA antibody to reveal the exogenously expressed various forms of HA-tagged RBM25. Gels represent n≥ 3. (C) Same experiment as in (B) using only the HA-RBM25-ΔRE-rich plasmid except that an anti-RBM25 antibody was used for the western blot analysis to reveal both exogenously expressed HA-RBM25-ΔRE-rich and endogenously expressed RBM25 that thus serves as an internal positive control. (D) Same experiment as in (B) except that a plasmid allowing expression of a HA-tagged full length RE motif (HA-RE) or only the RE-rich part of RE motif (HA-RE-rich) was used. (E) Same experiment as in Figure 3D except that, in addition to the effect of overexpressing HA-RBM25-FL on alternative splicing from the Bcl-x 672 WT minigene, the effect of overexpressing HA-RBM25-ΔRE-rich was also assessed. The result of the semi-quantitative RT–PCR experiment is shown in the upper panel and the western blot analysis of the level of expression of HA-RBM25-FL or HA-RBM25-ΔRE-rich, as compared to the loading control GAPDH, is shown in the two lower panels. Gels represent n≥ 3. (F) Immunofluorescence analysis of H1299 cells expressing HA-RBM25-FL or HA-RBM25-ΔRE-rich, as indicated. Microscopy images of fixed cells analysed using anti-RBM25 or anti-HA antibodies were shown as indicated. Merged images were also shown.
Figure 5.
Figure 5.
Effect of the PhenDC3 G4 ligand on RBM25/BCL-x RNA interaction, synthesis of the alternative pro-apoptotic Bcl-xS isoform and apoptosis. (A) Same semi-quantitative RT–PCR experiment as in Figure 3C to determine the relative proportion of the Bcl-xS and Bcl-xL isoforms synthesized from the minigenes, except that HeLa cells transfected by the WT or GM-2 minigene (as indicated) were also treated, or not, by various concentrations of the benchmark G4 ligand PhenDC3. Gel represents n≥ 3. (B) Same experiment as in (A) except that the alternative splicing of the endogenous BCL-x gene was analysed in A549 cells. Gel represents n≥ 3. (C) Same PLA experiment as in Figure 2E except that cells were treated, or not, with 20 μM PhenDC3. Microscopy images of H1299 cells analysed using a probe specifically hybridizing to the BCL-x RNA. Nuclei were revealed by DAPI staining and appear in blue. White dots (PLA signals) indicated interaction (close proximity) between endogenous RBM25 protein and endogenous BCL-x RNA. The graph on the right indicates the number of PLA dots per cells in each condition. Data from three biological replicates, at least 200 cells per sample, were analysed by a non-parametric Mann–Whitney's test using the GraphPad Prism 8 Software (***P< 0.0001). (D) Normalized UV-melting curves of GQ-2 (4 μM in lithium cacodylate buffer supplemented with 1 mM KCl and 99 mM LiCl) in the absence (black) or in the presence of 1 molar equivalent (orange) of 2 molar equivalents (red) of PhenDC3. (E) Determination, using the Caspase Glo 3/7 Assay, of the relative caspase 3/7 activity in A549 cells treated with DMSO (vehicle, negative control), 40 μM PhenDC3 or 1 μM Navitoclax or 1 μM ABT-737 as positive controls. Data from four biological replicates were analysed by ANOVA in conjunction with Tukey's test using GraphPad Prism 8 Software (***P< 0.0001).
Figure 6.
Figure 6.
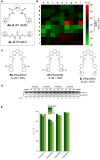
Screening of a library of 90 putative G4 ligands and identification of PhenDH2, 8 and 9. (A) Generic structure of the combinatorial library of 90 cationic bis(acylhydrazones) (AaJi). (B) The effect of individual library members (at ∼10 μM) on alternative splicing from the Bcl-x 672 WT minigene, as determined by semi-quantitative RT–PCR experiments on HeLa cells transfected by the Bcl-x 672 WT minigene was determined. The percentage of Bcl-xS obtained for each compound is indicated as a heatmap (% xS). PhenDC3 at the same concentration was used as a positive control. (C) Chemical structures of hit compounds Ef (PhenDH8), Ei (PhenDH9) and the inactive analogue Eb (PhenDH2). (D) Semi-quantitative RT–PCR experiments to assess alternative splicing of the endogenous BCL-x gene in A549 cells submitted to increasing concentrations of PhenDC3, PhenDH8, PhenDH9 or PhenDH2, as indicated. PhenDH8 and 9 are more potent than PhenDC3 to induce the alternative pro-apoptotic Bcl-xS whereas PhenDH2, although structurally close, is inactive at all tested concentrations. Gel represents n≥ 3. (E) Ligand-induced stabilization of GQ2 observed in FRET-melting experiments, performed with double-labelled oligonucleotide (F-GQ2-T, 0.2 μM) in the presence of the ligands (1.0 μM each) and in the absence or in the presence of double-stranded DNA competitor (ds26: 0, 3 or 10 μM). Experiments were performed in 10 mM lithium cacodylate buffer (pH 7.2) supplemented with 10 mM KCl and 90 mM LiCl.
Figure 7.
Figure 7.
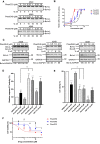
Quantitative analysis of the effect of PhenDC3, PhenDH8 and PhenDH9 on alternative splicing of BCL-x, apoptosis and cytotoxicity. (A) Semi-quantitative RT–PCR experiments to assess alternative splicing of the endogenous BCL-x gene in A549 cells submitted to increasing concentrations of PhenDC3, PhenDH9 or PhenDH8, as indicated. Gels represent n≥ 3. (B) Semi-logarithmic representation of the data shown in (A). (C) Western blot analysis of the effect of a range of concentration of PhenDH2, PhenDH9 or PhenDH8 (as indicated) on the protein level of the anti-apoptotic isoform Bcl-xL (middle gels) as compared to GAPDH (loading control, lower gels). The impact of the various G4 ligands on the alternative splicing of the endogenous BCL-x gene was determined in the same samples using semi-quantitative RT–PCR experiments (upper gels) as in (A). Gels represent n≥ 3. (D) Effect of PhenDC3, PhenDH8, PhenDH9 or PhenDH2 (all at 40 μM) on apoptosis as determined using the Caspase Glo 3/7 Assay as in Figure 5E. DMSO (vehicle) was used as a negative control and Navitoclax and ABT-737 were used as positive controls. Data from three biological replicates were analysed by ANOVA in conjunction with Tukey's test (***P< 0.0001). (E) Effect of PhenDC3, PhenDH8, PhenDH9 or PhenDH2 (all at 40 μM) on cell viability as determined using the MTT assay. DMSO (vehicle) was used as a negative control and Navitoclax and ABT-737 were used as positive controls. Data from three biological replicates were analysed by ANOVA in conjunction with Tukey's test using GraphPad Prism 8 Software (**P< 0.001, ***P< 0.0001). (F) Semi-logarithmic representation of the data obtained when testing the effect of a range of concentrations of PhenDC3, PhenDH8, PhenDH9 or PhenDH2 on cell viability as determined using the MTT assay as in (E).

References

    1. Berget S.M., Moore C., Sharp P.A. Spliced segments at the 5' terminus of adenovirus 2 late mRNA. Proc. Natl Acad. Sci. USA. 1977; 74:3171–3175. - PMC - PubMed
    1. Chow L.T., Gelinas R.E., Broker T.R., Roberts R.J. An amazing sequence arrangement at the 5' ends of adenovirus 2 messenger RNA. Cell. 1977; 12:1–8. - PubMed
    1. Chow L.T., Roberts J.M., Lewis J.B., Broker T.R. A map of cytoplasmic RNA transcripts from lytic adenovirus type 2, determined by electron microscopy of RNA:DNA hybrids. Cell. 1977; 11:819–836. - PubMed
    1. Dvinge H., Kim E., Abdel-Wahab O., Bradley R.K. RNA splicing factors as oncoproteins and tumour suppressors. Nat. Rev. Cancer. 2016; 16:413–430. - PMC - PubMed
    1. Scotti M.M., Swanson M.S. RNA mis-splicing in disease. Nat. Rev. Genet. 2016; 17:19–32. - PMC - PubMed

Publication types