. 2023 Oct 19;127(41):8762-8768.
doi: 10.1021/acs.jpcb.3c03387. Epub 2023 Oct 9.

Cyclic Disulfide-Bridged Dinitroxide Biradical for Measuring Thiol Redox Status by Electron Paramagnetic Resonance

Affiliations

Cyclic Disulfide-Bridged Dinitroxide Biradical for Measuring Thiol Redox Status by Electron Paramagnetic Resonance

Lukas B Woodcock et al. J Phys Chem B. .

Abstract

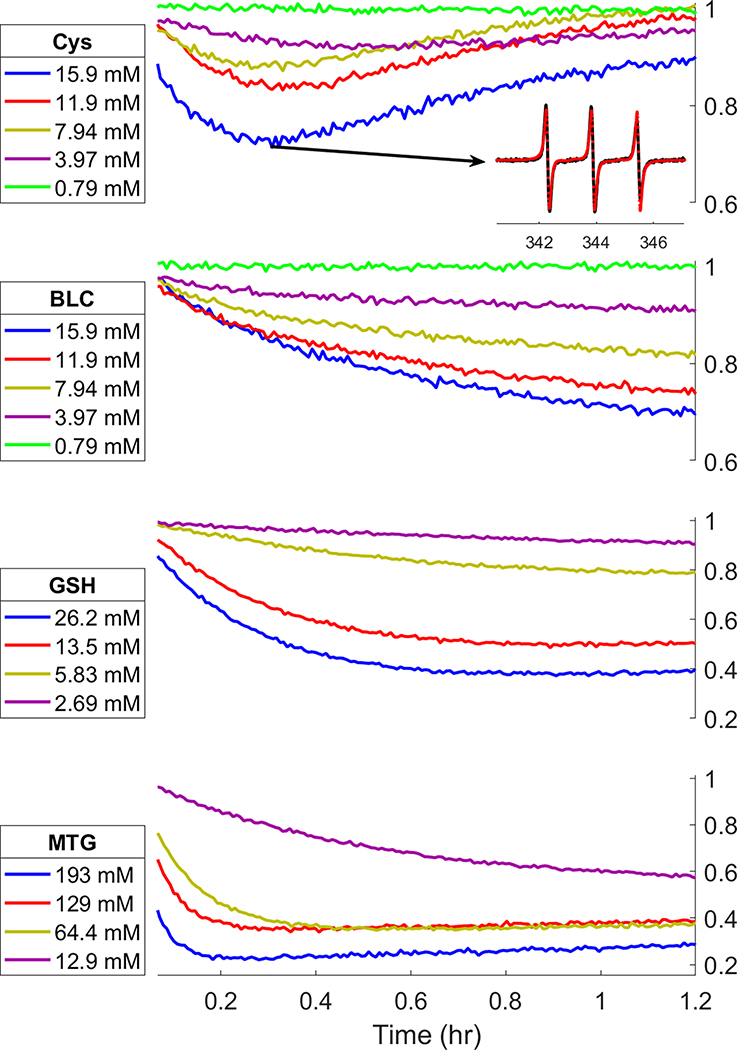
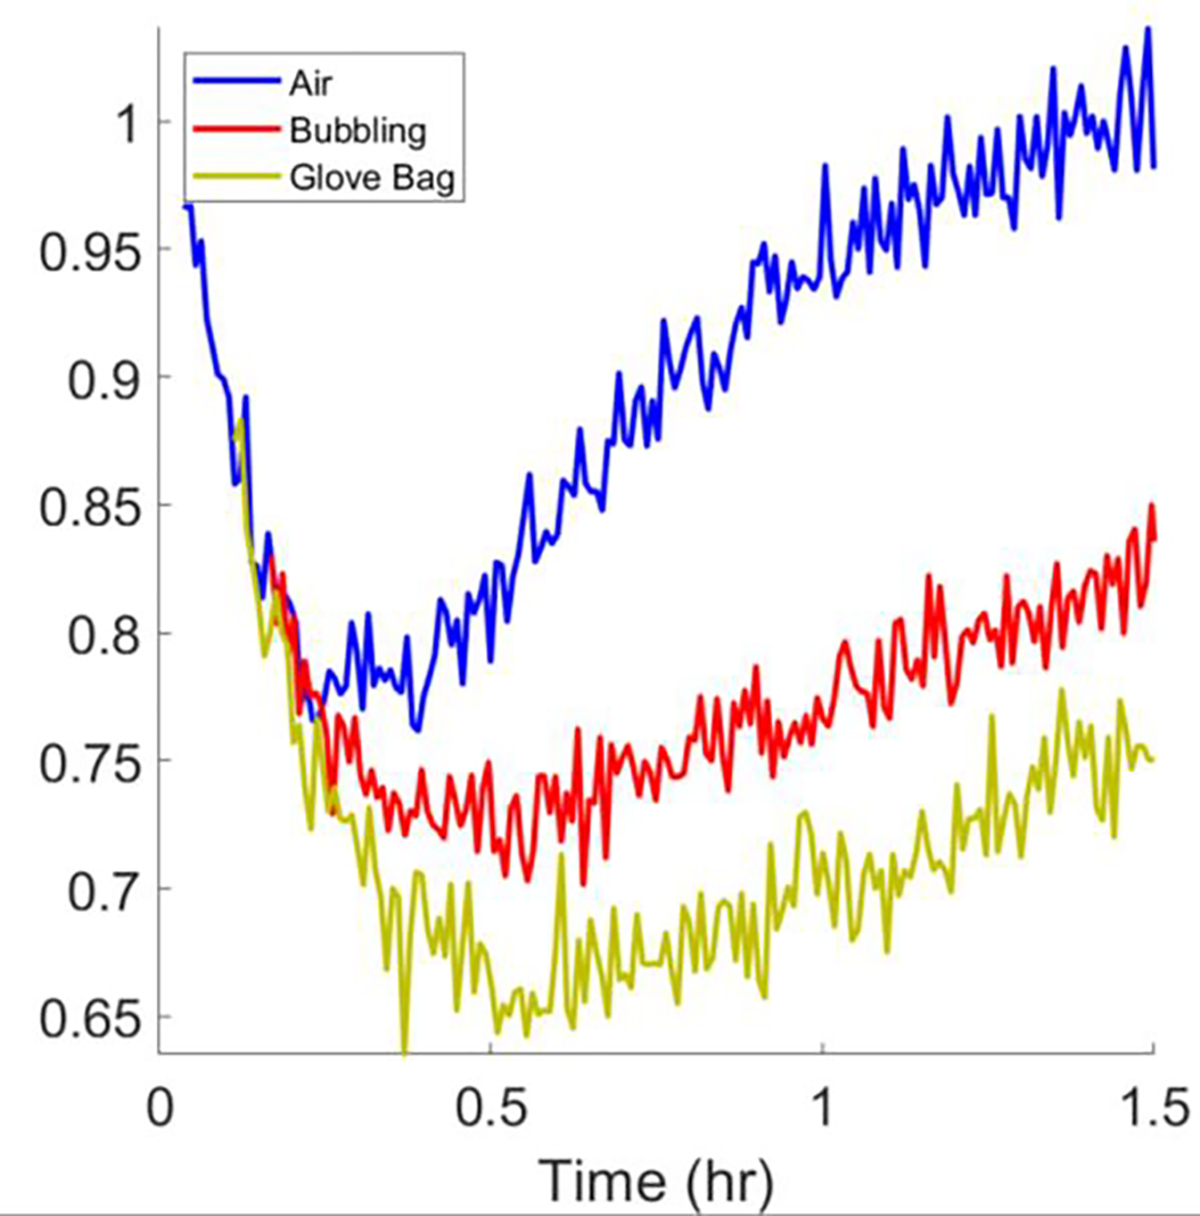
Among low-molecular-weight thiols, glutathione (GSH) is the main antioxidant in the cell, and its concentration is an indicator of the redox status. A cyclic disulfide-linked dinitroxide was designed for monitoring GSH by electron-paramagnetic resonance (EPR) spectroscopy. Reaction of the disulfide with GSH and three other thiols was measured at 9.6 GHz (X-band) and shown to be of first order in thiols. It is proposed that the reaction of the disulfide with 1 equiv of thiolate produced a short-lived intermediate that reacts with 1 equiv of thiolate to produce the cleavage product. The equilibrium ratio of the cleaved and intact disulfide is a measure of the redox state. Since the long-term goal is to use the disulfide to probe physiology in vivo, the feasibility of EPR spectroscopy and imaging of the disulfide and its cleavage product was demonstrated at 1 GHz (L-band).


Figures

Figure 1:
Figure 1:
X-band spectra (black line) and simulations (red dashed line) of 0.1 mM cPxSSPx-1 before (top) and after (bottom) cleavage of disulfide bond by reduction with 1 mM TCEP. Arrows mark the broad lines characteristic of electron spin-spin interaction. The amplitude of the sharp peaks is a factor of three smaller in the cleaved conformation with significant electron-electron spin-spin interaction than in the cyclic form. The parameters for the simulations are given in the text.
Figure 2:
Figure 2:
Scheme for reaction of cPxSSPx-1 with thiols. The three populations used for simulation are labeled P1 (uncleaved), P2 (cleaved, weakly spin-coupled conformation), and P3 (cleaved, strongly spin-coupled conformation). The rate constants used in the simulation were k1’ and k3, representing the reaction and conformational exchange rates, respectively, and the corresponding equilibrium constants K1 and K3. The proposed intermediate P4 is not included in the kinetic analysis because its concentration is expected to be very low.
Figure 3:
Figure 3:
Reaction order plots for cPxSSPx-1 reacting with thiol reducing agents. Blue symbols are data (mean ± SE); red lines are least-squares fits. The y axis for each plot spans more than 1 log unit. The [thiolate] is proportional to Ka·[thiol] so the intercept depends on Ka and the slope defines the reaction order.
Figure 4:
Figure 4:
Time dependence of intensity of the low-field line in the X-Band spectra of cPxSSPx-1 reacting with varying concentrations of thiol. Inset: Data (black) and simulation (dotted red) of indicated point on the 15.9 mM Cys trace; field axis in mT.
Figure 5:
Figure 5:
Time dependence of intensity of the low-field line in the X-Band spectra of cPxSSPx-1 reacting with 15.9 mM Cys under air, with N2 bubbling, or under N2 atmosphere in a glove bag. After initiation of the reaction, the delays in starting data acquisition were 2, 5, and 8 min, for air, N2-bubbled, and N2 glove bag cases, respectively.
Figure 6:
Figure 6:
Dependence of the equilibrium ratio of the concentrations of cleaved (reduced) and uncleaved (oxidized) cPxSSPx-1 on equilibrium ratio of [GSHT]2 to [GSSGT]. The populations of biradical were calculated from simulations and the values on the abscissa were calculated using Eq. 9. Blue symbols are data (mean ± SE); red line is the least-squares linear fit to the data. Concentration is in mM.
Figure 7:
Figure 7:
Images (A, B) of a 2-compartment phantom (C) with 0.1 mM cPxSSPx-1 in the upper cylinder and a reference sample of 0.1 mM 15N,d13-CTPO in the lower cylinder. The images were acquired before (A) and after (B) reaction with 26.9 mM GSH. Non-gradient spectra (black lines) before (D) and after (E) reaction with GSH show the decrease in intensity of the low-field line relative to that for the reference 15N signal (marked with *). Derivatives of spectral slices through the center of the upper compartment are shown as red dotted lines in (D) and (E). Positions of spectral slices through the images are shown by red dotted lines overlayed on images in A and B.

References

    1. Forman HJ; Zhang H; Rinna A Glutathione: Overview of Its Protective Roles, Measurement, and Biosynthesis. Mol. Aspects Med. 2009, 30 (1–2), 1–12. 10.1016/j.mam.2008.08.006. - DOI - PMC - PubMed
    1. Blair I Endogenous Glutathione Adducts. Curr. Drug Metab. 2006, 7 (8), 853–872. 10.2174/138920006779010601. - DOI - PubMed
    1. Hayes JD; Flanagan JU; Jowsey IR Glutathione Transferases. Annu. Rev. Pharmacol. Toxicol. 2005, 45 (1), 51–88. 10.1146/annurev.pharmtox.45.120403.095857. - DOI - PubMed
    1. Cook JA; Gius D; Wink DA; Krishna MC; Russo A; Mitchell JB Oxidative Stress, Redox, and the Tumor Microenvironment. Semin. Radiat. Oncol. 2004, 14 (3), 259–266. 10.1016/j.semradonc.2004.04.001. - DOI - PubMed
    1. Khramtsov VV; Yelinova (Popova) VI; Weiner LM; Berezina TA; Martin VV; Volodarsky LB. Quantitative Determination of SH Groups in Low- and High-Molecular-Weight Compounds by an Electron Spin Resonance Method. Anal. Biochem. 1989, 182 (1), 58–63. 10.1016/0003-2697(89)90718-5. - DOI - PubMed

Publication types

MeSH terms