. 2023 Nov 15;83(22):3796-3812.
doi: 10.1158/0008-5472.CAN-23-0385.

Subclonal Somatic Copy-Number Alterations Emerge and Dominate in Recurrent Osteosarcoma

Affiliations

Subclonal Somatic Copy-Number Alterations Emerge and Dominate in Recurrent Osteosarcoma

Michael D Kinnaman et al. Cancer Res. .

Abstract

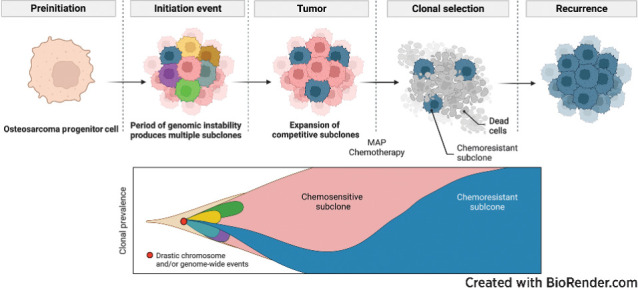
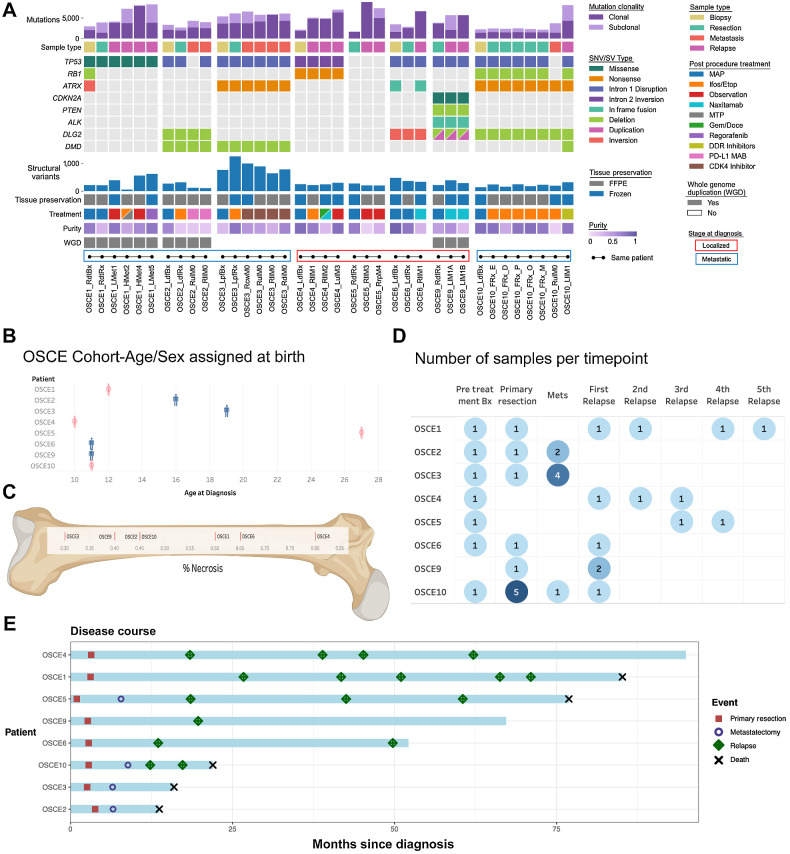
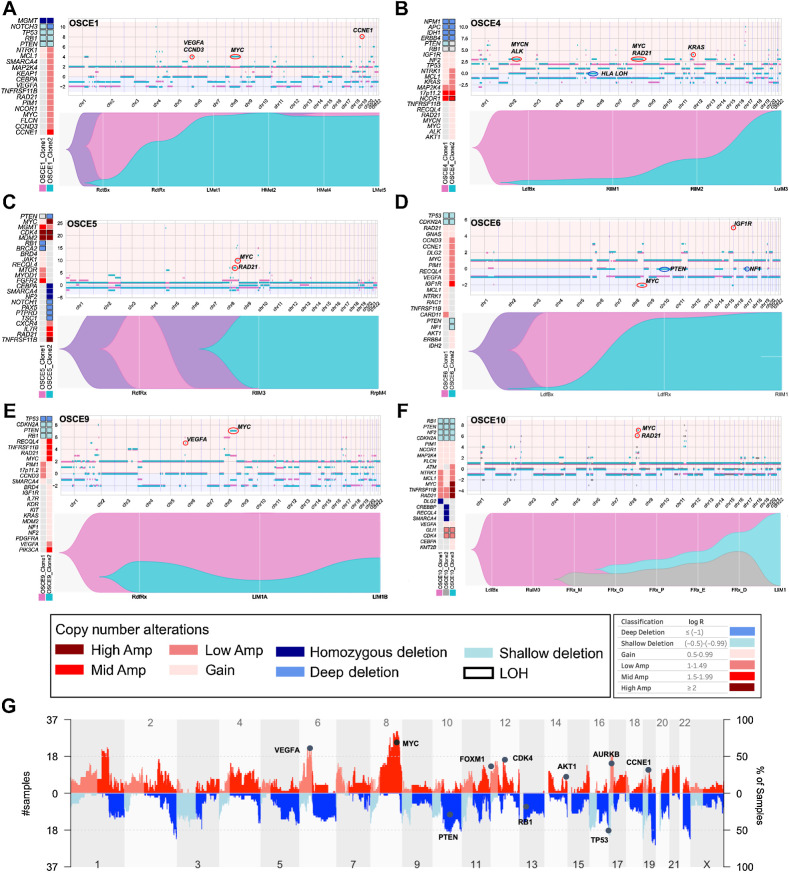
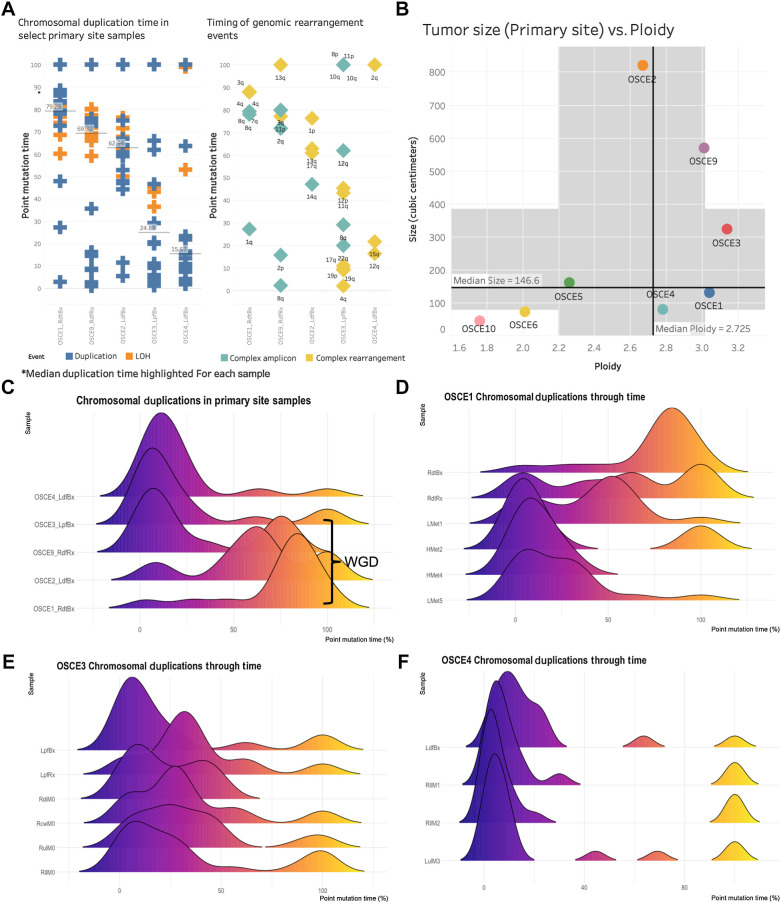
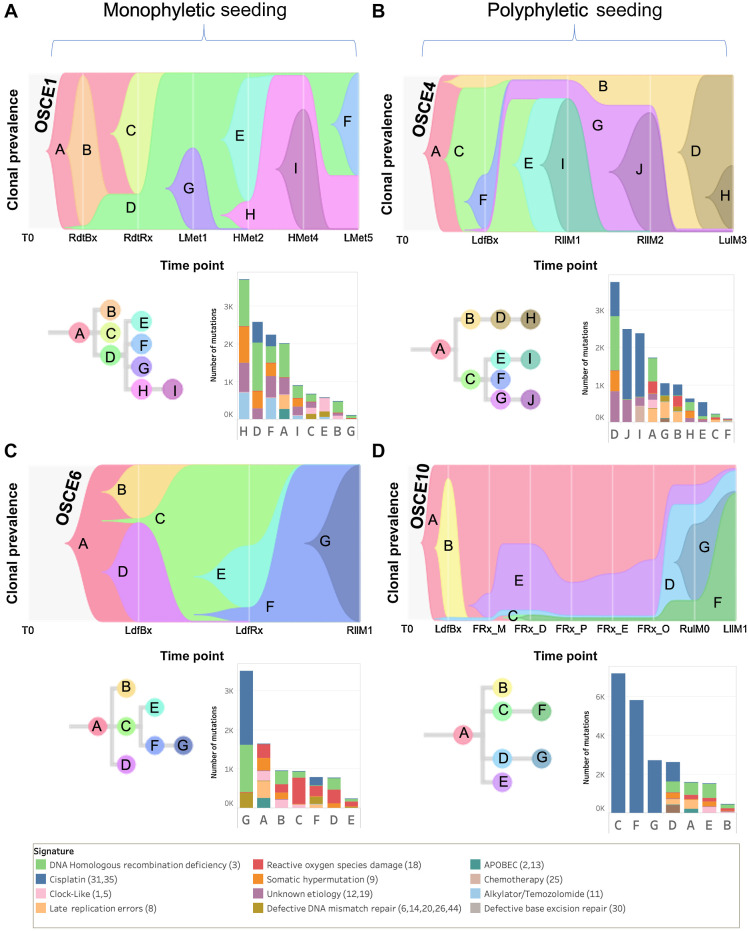
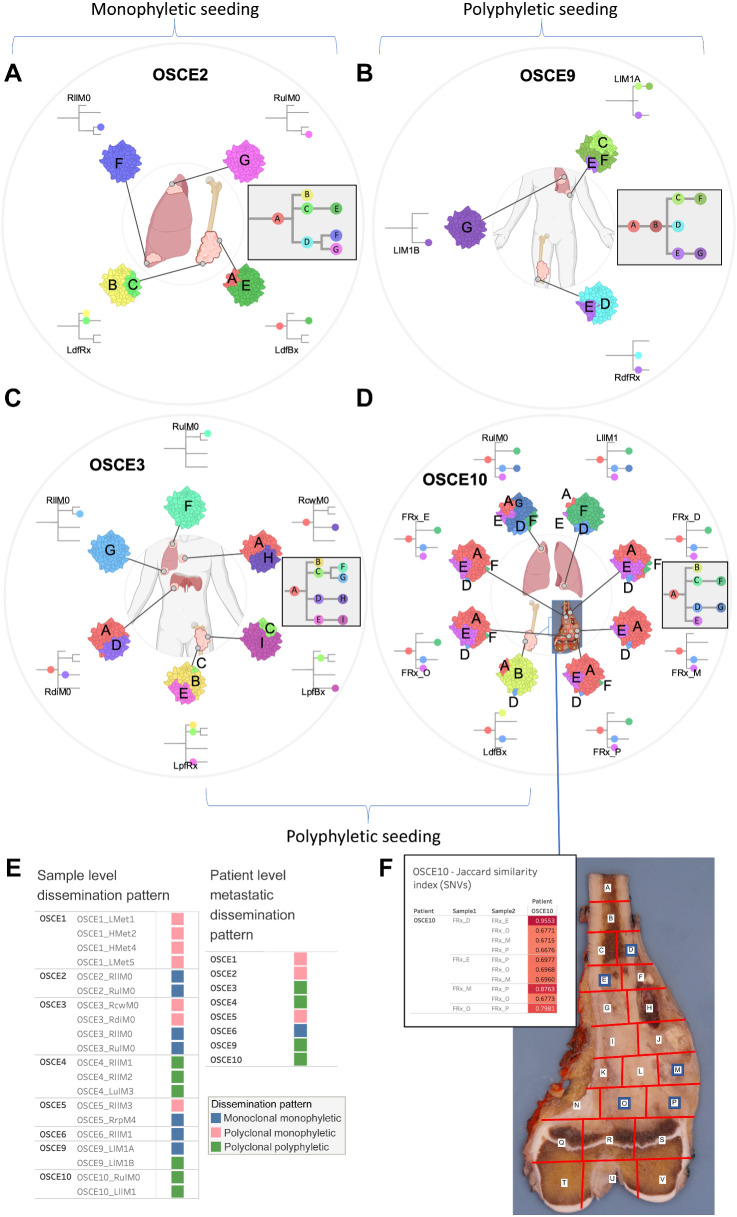
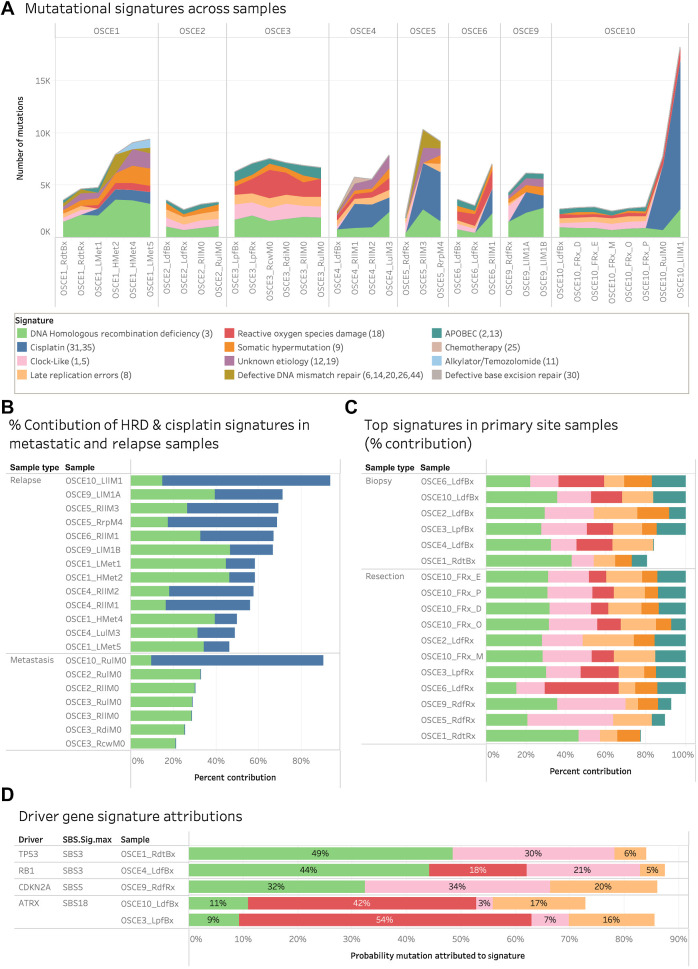
Multiple large-scale genomic profiling efforts have been undertaken in osteosarcoma to define the genomic drivers of tumorigenesis, therapeutic response, and disease recurrence. The spatial and temporal intratumor heterogeneity could also play a role in promoting tumor growth and treatment resistance. We conducted longitudinal whole-genome sequencing of 37 tumor samples from 8 patients with relapsed or refractory osteosarcoma. Each patient had at least one sample from a primary site and a metastatic or relapse site. Subclonal copy-number alterations were identified in all patients except one. In 5 patients, subclones from the primary tumor emerged and dominated at subsequent relapses. MYC gain/amplification was enriched in the treatment-resistant clones in 6 of 7 patients with multiple clones. Amplifications in other potential driver genes, such as CCNE1, RAD21, VEGFA, and IGF1R, were also observed in the resistant copy-number clones. A chromosomal duplication timing analysis revealed that complex genomic rearrangements typically occurred prior to diagnosis, supporting a macroevolutionary model of evolution, where a large number of genomic aberrations are acquired over a short period of time followed by clonal selection, as opposed to ongoing evolution. A mutational signature analysis of recurrent tumors revealed that homologous repair deficiency (HRD)-related SBS3 increases at each time point in patients with recurrent disease, suggesting that HRD continues to be an active mutagenic process after diagnosis. Overall, by examining the clonal relationships between temporally and spatially separated samples from patients with relapsed/refractory osteosarcoma, this study sheds light on the intratumor heterogeneity and potential drivers of treatment resistance in this disease.

Significance: The chemoresistant population in recurrent osteosarcoma is subclonal at diagnosis, emerges at the time of primary resection due to selective pressure from neoadjuvant chemotherapy, and is characterized by unique oncogenic amplifications.


Figures

None
Graphical abstract
Figure 1. Characteristics of the patients and samples included in the analysis cohort. A, Oncoprint of sample and patient-level details for each patient. Samples from the same patient are connected by dots and lines at bottom of figure and are in chronological order of time obtained (earliest on left). Bx, biopsy; Rx, resection; sample ending in 0, metastatic site present at diagnosis; sample ending in a number >0, number of relapses. L/R, laterality; d, distal; p, proximal; f, femur; t, tibia; cw, chest wall; H, heart; μL, upper lobe; ll, lower lobe; di, diaphragm; rp, retroperitoneal; l, lobe. B, Age and sex assigned at birth for each patient; patient is on the x-axis, age is on the y-axis, and sex assigned at birth is plotted on the chart as blue for male and pink for female. C, Percent necrosis at time of primary resection for each patient (note OSCE2/OSCE10 both have 45% necrosis). D, Summary of the number of samples per time point for each patient. Darker shades of blue represent higher number of samples at a respective time point. E, Patients are listed on the y-axis and are ordered from longest disease course at the top to shortest at the bottom of the figure. The light blue bars represent length of disease course in months. Events are marked as depicted in the legend with different shapes and colors and plotted along the disease course bar at the time in months that the event occurs. (C, Created with BioRender.com.)
Figure 1.
Characteristics of the patients and samples included in the analysis cohort. A, Oncoprint of sample and patient-level details for each patient. Samples from the same patient are connected by dots and lines at bottom of figure and are in chronological order of time obtained (earliest on left). Bx, biopsy; Rx, resection; sample ending in 0, metastatic site present at diagnosis; sample ending in a number >0, number of relapses. L/R, laterality; d, distal; p, proximal; f, femur; t, tibia; cw, chest wall; H, heart; μL, upper lobe; ll, lower lobe; di, diaphragm; rp, retroperitoneal; l, lobe. B, Age and sex assigned at birth for each patient; patient is on the x-axis, age is on the y-axis, and sex assigned at birth is plotted on the chart as blue for male and pink for female. C, Percent necrosis at time of primary resection for each patient (note OSCE2/OSCE10 both have 45% necrosis). D, Summary of the number of samples per time point for each patient. Darker shades of blue represent higher number of samples at a respective time point. E, Patients are listed on the y-axis and are ordered from longest disease course at the top to shortest at the bottom of the figure. The light blue bars represent length of disease course in months. Events are marked as depicted in the legend with different shapes and colors and plotted along the disease course bar at the time in months that the event occurs. (C, Created with BioRender.com.)
Figure 2. Subclonal copy-number clones emerge at relapse. A–F, For each patient there is a panel of three figures. The figure on the left is an oncoprint featuring clone-specific CNAs in recurrently altered genes of interest in osteosarcoma. The top figure is a plot of allele-specific CNAs for each clone, with significant events for each clone circled and highlighted (note y-axis scales are unique for each patient). Clone 1, magenta clone; clone 2, teal clone; clone 3 in OSCE10, gray clone. The major allele is plotted above 0 and the minor allele is plotted below 0. The bottom figure in each panel is a TimeScape plot of the prevalence of each clone at different time points throughout a patient's disease course. G, Combined genome-wide CNAs across all patients in the cohort, with recurrently altered genes highlighted.
Figure 2.
Subclonal copy-number clones emerge at relapse. A–F, For each patient there is a panel of three figures. The figure on the left is an oncoprint featuring clone-specific CNAs in recurrently altered genes of interest in osteosarcoma. The top figure is a plot of allele-specific CNAs for each clone, with significant events for each clone circled and highlighted (note y-axis scales are unique for each patient). Clone 1, magenta clone; clone 2, teal clone; clone 3 in OSCE10, gray clone. The major allele is plotted above 0 and the minor allele is plotted below 0. The bottom figure in each panel is a TimeScape plot of the prevalence of each clone at different time points throughout a patient's disease course. G, Combined genome-wide CNAs across all patients in the cohort, with recurrently altered genes highlighted.
Figure 3. Chromosomal duplication timing analysis reconstructs evolutionary past of genomic instability events. A, Plot of duplication and rearrangement events in molecular time. Left side of figure is plot of duplication events (blue) and LOH events (orange) for select primary site samples. The median duplication time is highlighted for each sample. The plot on the right side of the figure is complex amplicon events (teal) and complex rearrangement events (yellow). Y-axis for both plots is molecular time. The samples are in the same order for each plot. Each plotted event represents an affected chromosomal arm. B, Plot of tumor size (by volume) versus ploidy called by HATCHet. Median size (y-axis) and ploidy (x-axis) values are plotted with dark black lines, with the shaded gray areas representing the range between the lower and upper quartile for each metric. C, Chromosomal duplication timing of five primary site samples. WGD events as called by HATCHet appear to be a late event in our cohort. D–F, Ridgeline plots of the density of duplication events over molecular time for each sample for the selected patients. Notably the highest peak in duplications occurs before diagnosis.
Figure 3.
Chromosomal duplication timing analysis reconstructs evolutionary past of genomic instability events. A, Plot of duplication and rearrangement events in molecular time. Left side of figure is plot of duplication events (blue) and LOH events (orange) for select primary site samples. The median duplication time is highlighted for each sample. The plot on the right side of the figure is complex amplicon events (teal) and complex rearrangement events (yellow). Y-axis for both plots is molecular time. The samples are in the same order for each plot. Each plotted event represents an affected chromosomal arm. B, Plot of tumor size (by volume) versus ploidy called by HATCHet. Median size (y-axis) and ploidy (x-axis) values are plotted with dark black lines, with the shaded gray areas representing the range between the lower and upper quartile for each metric. C, Chromosomal duplication timing of five primary site samples. WGD events as called by HATCHet appear to be a late event in our cohort. D–F, Ridgeline plots of the density of duplication events over molecular time for each sample for the selected patients. Notably the highest peak in duplications occurs before diagnosis.
Figure 4. SNV-based phylogenies highlighting temporal evolution with clonal mutational signature composition. A–D, Top figure in each panel is a TimeScape plot of the inferred evolutionary phylogeny, highlighting clonal proportions over time. The prevalence of different clones is shown over time on the vertical axis, with the different clones represented by different colors. The horizontal axis represents the time points, which are represented by gray lines. The evolutionary relationships between the clones are shown on the phylogenetic tree and in the TimeScape layout. The bottom right of each panel is a stacked bar plot of the total number of mutations assigned to each clone. Colors represent total number of mutations attributed to each mutational signature, with color legend at bottom of figure. Patient-level metastatic seeding patterns are denoted by the brackets at the top of the page.
Figure 4.
SNV-based phylogenies highlighting temporal evolution with clonal mutational signature composition. A–D, Top figure in each panel is a TimeScape plot of the inferred evolutionary phylogeny, highlighting clonal proportions over time. The prevalence of different clones is shown over time on the vertical axis, with the different clones represented by different colors. The horizontal axis represents the time points, which are represented by gray lines. The evolutionary relationships between the clones are shown on the phylogenetic tree and in the TimeScape layout. The bottom right of each panel is a stacked bar plot of the total number of mutations assigned to each clone. Colors represent total number of mutations attributed to each mutational signature, with color legend at bottom of figure. Patient-level metastatic seeding patterns are denoted by the brackets at the top of the page.
Figure 5. SNV-based phylogenies highlighting spatial evolution and descriptions of metastatic seeding patterns at the sample and patient level. A–D, Spatially and in some cases temporally distinct samples are indicated on the anatomic sites from where the sample originated. The colors represent different clones, and the phylogenetic trees show the evolutionary relationships between these clones. The prevalence of each clone at a particular site is proportional to the colored area of the cellular aggregate representation. E, Sample and patient level dissemination patterns are characterized in these charts. Monoclonal dissemination: single subclone within the primary tumor seeds one or more metastatic lesions; polyclonal dissemination: multiple distinct subclones from the primary tumor seed one or more metastatic lesions; monophyletic origin: all metastatic clones are derived from a recent common ancestor; polyphyletic origin: metastasizing clones are more similar to other subclones within the primary tumor than they are to each other. These descriptions can be considered at the sample level, focused on the clonal make up of a single metastatic site compared with the primary tumor, or taken as a whole, evaluating all spatially or temporally separated samples and how they relate back to the primary tumor. F, Multiregion sequencing was performed on a primary resection sample from OSCE10. Regions D, E, M, O, P were sequenced from the specimen grid depicted. A table of Jaccard similarity indexes based on shared SNVs for these samples is shown in the top left inset. (A–D, Created with BioRender.com.)
Figure 5.
SNV-based phylogenies highlighting spatial evolution and descriptions of metastatic seeding patterns at the sample and patient level. A–D, Spatially and in some cases temporally distinct samples are indicated on the anatomic sites from where the sample originated. The colors represent different clones, and the phylogenetic trees show the evolutionary relationships between these clones. The prevalence of each clone at a particular site is proportional to the colored area of the cellular aggregate representation. E, Sample and patient level dissemination patterns are characterized in these charts. Monoclonal dissemination: single subclone within the primary tumor seeds one or more metastatic lesions; polyclonal dissemination: multiple distinct subclones from the primary tumor seed one or more metastatic lesions; monophyletic origin: all metastatic clones are derived from a recent common ancestor; polyphyletic origin: metastasizing clones are more similar to other subclones within the primary tumor than they are to each other. These descriptions can be considered at the sample level, focused on the clonal make up of a single metastatic site compared with the primary tumor, or taken as a whole, evaluating all spatially or temporally separated samples and how they relate back to the primary tumor. F, Multiregion sequencing was performed on a primary resection sample from OSCE10. Regions D, E, M, O, P were sequenced from the specimen grid depicted. A table of Jaccard similarity indexes based on shared SNVs for these samples is shown in the top left inset. (A–D, Created with BioRender.com.)
Figure 6. Mutational signature patterns across the cohort. A, Stacked line chart of mutational signature contribution by total number of mutations attributed to each signature. Colors represent the different signatures. B, Stacked bar chart of the relative contribution of HRD-related SBS3 (green) and cisplatin (blue) signature in metastatic and relapse samples. C, Stacked bar chart of the relative contribution of HRD (green), clock-like (pink), ROS damage (red), late replication errors (beige), somatic hypermutation (orange), and APOBEC (teal) in primary site samples. D, Stacked bar chart of the probability that driver gene SNVs were attributed to a mutational signature. Pretreatment samples from patients with driver SNVs were included and the primary resection sample from OSCE9 because no pretreatment sample was available. Colors represent the different signatures.
Figure 6.
Mutational signature patterns across the cohort. A, Stacked line chart of mutational signature contribution by total number of mutations attributed to each signature. Colors represent the different signatures. B, Stacked bar chart of the relative contribution of HRD-related SBS3 (green) and cisplatin (blue) signature in metastatic and relapse samples. C, Stacked bar chart of the relative contribution of HRD (green), clock-like (pink), ROS damage (red), late replication errors (beige), somatic hypermutation (orange), and APOBEC (teal) in primary site samples. D, Stacked bar chart of the probability that driver gene SNVs were attributed to a mutational signature. Pretreatment samples from patients with driver SNVs were included and the primary resection sample from OSCE9 because no pretreatment sample was available. Colors represent the different signatures.

Update of

References

    1. Kager L, Zoubek A, Pötschger U, Kastner U, Flege S, Kempf-Bielack B, et al. Primary metastatic osteosarcoma: presentation and outcome of patients treated on neoadjuvant cooperative osteosarcoma study group protocols. J Clin Oncol 2003;21:2011–8. - PubMed
    1. Kim MS, Cho WH, Song WS, Lee SY, Jeon DG. Time dependency of prognostic factors in patients with stage II osteosarcomas. Clin Orthop Relat Res 2007;463:157–65. - PubMed
    1. Bielack SS, Kempf-Bielack B, Delling G, Exner GU, Flege S, Helmke K, et al. Prognostic factors in high-grade osteosarcoma of the extremities or trunk: an analysis of 1,702 patients treated on neoadjuvant cooperative osteosarcoma study group protocols. J Clin Oncol 2002;20:776–90. - PubMed
    1. Sayles LC, Breese MR, Koehne AL, Leung SG, Lee AG, Liu H-Y, et al. Genome-informed targeted therapy for osteosarcoma. Cancer Discov 2019;9:46–63. - PMC - PubMed
    1. Perry JA, Kiezun A, Tonzi P, Van Allen EM, Carter SL, Baca SC, et al. Complementary genomic approaches highlight the PI3K/mTOR pathway as a common vulnerability in osteosarcoma. Proc Natl Acad Sci U S A 2014;111:E5564–73. - PMC - PubMed