. 2024 Mar 1;30(5):1022-1037.
doi: 10.1158/1078-0432.CCR-23-2187.

Surface and Global Proteome Analyses Identify ENPP1 and Other Surface Proteins as Actionable Immunotherapeutic Targets in Ewing Sarcoma

Affiliations

Surface and Global Proteome Analyses Identify ENPP1 and Other Surface Proteins as Actionable Immunotherapeutic Targets in Ewing Sarcoma

Brian Mooney et al. Clin Cancer Res. .

Abstract

Purpose: Ewing sarcoma is the second most common bone sarcoma in children, with 1 case per 1.5 million in the United States. Although the survival rate of patients diagnosed with localized disease is approximately 70%, this decreases to approximately 30% for patients with metastatic disease and only approximately 10% for treatment-refractory disease, which have not changed for decades. Therefore, new therapeutic strategies are urgently needed for metastatic and refractory Ewing sarcoma.

Experimental design: This study analyzed 19 unique Ewing sarcoma patient- or cell line-derived xenografts (from 14 primary and 5 metastatic specimens) using proteomics to identify surface proteins for potential immunotherapeutic targeting. Plasma membranes were enriched using density gradient ultracentrifugation and compared with a reference standard of 12 immortalized non-Ewing sarcoma cell lines prepared in a similar manner. In parallel, global proteome analysis was carried out on each model to complement the surfaceome data. All models were analyzed by Tandem Mass Tags-based mass spectrometry to quantify identified proteins.

Results: The surfaceome and global proteome analyses identified 1,131 and 1,030 annotated surface proteins, respectively. Among surface proteins identified, both approaches identified known Ewing sarcoma-associated proteins, including IL1RAP, CD99, STEAP1, and ADGRG2, and many new cell surface targets, including ENPP1 and CDH11. Robust staining of ENPP1 was demonstrated in Ewing sarcoma tumors compared with other childhood sarcomas and normal tissues.

Conclusions: Our comprehensive proteomic characterization of the Ewing sarcoma surfaceome provides a rich resource of surface-expressed proteins in Ewing sarcoma. This dataset provides the preclinical justification for exploration of targets such as ENPP1 for potential immunotherapeutic application in Ewing sarcoma. See related commentary by Bailey, p. 934.


Figures

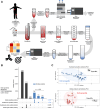
Figure 1. Surface enrichment methodology and Ewing sarcoma surfaceome and proteome metrics. A, Membranes were enriched from Ewing sarcoma models using a density gradient ultracentrifugation approach. Global proteome profiling was carried out in tandem according to the schematic. B, Upset plots depicting the number of proteins identified for the global proteome (Global) or surface surfaceome enrichment (Surfaceome). Proteins were classified as surface proteins using the SurfaceGenie dataset. Numbers listed on the right side are the total protein count for that particular group. C, Principal component analysis (PCA) plots of Ewing sarcoma samples, and SuperMix (SM) samples, in both the surfaceome (blue/gray dots) and the global proteome (red/gray dots) datasets.
Figure 1.
Surface enrichment methodology and Ewing sarcoma surfaceome and proteome metrics. A, Membranes were enriched from Ewing sarcoma models using a density gradient ultracentrifugation approach. Global proteome profiling was carried out in tandem according to the schematic. B, Upset plots depicting the number of proteins identified for the global proteome (Global) or surface surfaceome enrichment (Surfaceome). Proteins were classified as surface proteins using the SurfaceGenie dataset. Numbers listed on the right side are the total protein count for that particular group. C, Principal component analysis (PCA) plots of Ewing sarcoma samples, and SuperMix (SM) samples, in both the surfaceome (blue/gray dots) and the global proteome (red/gray dots) datasets.
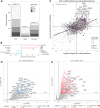
Figure 2. Surfaceome and Global proteome profiling provides a comprehensive depiction of the Ewing sarcoma surfaceome. A, Surface Protein Consensus (SPC) scores from the SurfaceGenie dataset of surface proteins found in both the Global and Surfaceome datasets, and in each dataset alone. B, Gene ontology (GO) analysis of the Ewing sarcoma surfaceome data versus the global proteome data. Over- and under-represented GO terms are shown. C, Log2 fold change (Ewing sarcoma vs. SM) of proteins common to surfaceome (x-axis) and global proteome (y-axis) datasets are well correlated (Pearson R = 0.52, P < 0.001). Highlighted are known Ewing sarcoma–associated surface proteins. D and E, Volcano plots (log2 fold change vs. –log10 adjusted P value) of all proteins enriched in Ewing sarcoma models in both the surfaceome (D) and global proteome (E) data. Bold labeled proteins are surface proteins with –Log10 adjusted P < 0.05 and log2FC > 0.5. Statistical analysis was performed using the DEqMS test. Limits were applied to the x and y axes in both D and E for visualization purposes (there are 10 significant, non-surface proteins not shown in E). Proteins enriched in the SM samples (left-hand side of the plots) were not displayed.
Figure 2.
Surfaceome and Global proteome profiling provides a comprehensive depiction of the Ewing sarcoma surfaceome. A, Surface Protein Consensus (SPC) scores from the SurfaceGenie dataset of surface proteins found in both the Global and Surfaceome datasets, and in each dataset alone. B, Gene ontology (GO) analysis of the Ewing sarcoma surfaceome data versus the global proteome data. Over- and under-represented GO terms are shown. C, Log2 fold change (Ewing sarcoma vs. SM) of proteins common to surfaceome (x-axis) and global proteome (y-axis) datasets are well correlated (Pearson R = 0.52, P < 0.001). Highlighted are known Ewing sarcoma–associated surface proteins. D and E, Volcano plots (log2 fold change vs. –log10 adjusted P value) of all proteins enriched in Ewing sarcoma models in both the surfaceome (D) and global proteome (E) data. Bold labeled proteins are surface proteins with –Log10 adjusted P < 0.05 and log2FC > 0.5. Statistical analysis was performed using the DEqMS test. Limits were applied to the x and y axes in both D and E for visualization purposes (there are 10 significant, non-surface proteins not shown in E). Proteins enriched in the SM samples (left-hand side of the plots) were not displayed.
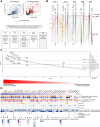
Figure 3. Prioritization of immunotherapy candidates from the Ewing sarcoma surfaceome and global proteome data. A, The union of the surfaceome and global proteome data provided 218 surface protein immunotherapy candidates containing a transmembrane domain and an FDR < 0.1. The workflow depicts the general scoring schema used to generate the ranked list of immunotherapy candidates. SFX, surfaceome; GLB, global proteome. B, An example of how the scoring system works, highlighting IL1RAP, ENPP1, and ENG in these data. C, Summed scores from B were converted to Z-scores and plotted against their respective ranks. Highlighted are known Ewing sarcoma surface candidates, or promising candidates from this study. D, All data are available for proteins in Group 1 (Z-score >1). Tracks used in the scoring schema, top to bottom: SFX and GLB, # Ewing sarcoma models enriched and average fold change versus SM; PPTC_FC, fold change of targets in Ewing sarcoma versus other pediatric cancers in the PPTC dataset; and GTEX_TPM track, TPM of targets across normal tissues in the GTEX data. Other tracks are SurfaceGenie, SPC score (1–4) of protein; EWS–FLI1 target (ChIP + mRNA regulation), depicting if targets displayed EWS–FLI1 binding at their promotor regions (ChIP) and a subsequent increase in mRNA expression from publicly available data; and N cell lines (Protein WT > EWSR1–ETS KD), number of WT Ewing sarcoma cell lines (19 total) where that protein is significantly higher in versus EWSR1–ETS fusion knockdown (KD) models, depicting surface proteins potentially regulated by EWSR1–ETS fusions.
Figure 3.
Prioritization of immunotherapy candidates from the Ewing sarcoma surfaceome and global proteome data. A, The union of the surfaceome and global proteome data provided 218 surface protein immunotherapy candidates containing a transmembrane domain and an FDR < 0.1. The workflow depicts the general scoring schema used to generate the ranked list of immunotherapy candidates. SFX, surfaceome; GLB, global proteome. B, An example of how the scoring system works, highlighting IL1RAP, ENPP1, and ENG in these data. C, Summed scores from B were converted to Z-scores and plotted against their respective ranks. Highlighted are known Ewing sarcoma surface candidates, or promising candidates from this study. D, All data are available for proteins in Group 1 (Z-score >1). Tracks used in the scoring schema, top to bottom: SFX and GLB, # Ewing sarcoma models enriched and average fold change versus SM; PPTC_FC, fold change of targets in Ewing sarcoma versus other pediatric cancers in the PPTC dataset; and GTEX_TPM track, TPM of targets across normal tissues in the GTEX data. Other tracks are SurfaceGenie, SPC score (1–4) of protein; EWS–FLI1 target (ChIP + mRNA regulation), depicting if targets displayed EWS–FLI1 binding at their promotor regions (ChIP) and a subsequent increase in mRNA expression from publicly available data; and N cell lines (Protein WT > EWSR1–ETS KD), number of WT Ewing sarcoma cell lines (19 total) where that protein is significantly higher in versus EWSR1–ETS fusion knockdown (KD) models, depicting surface proteins potentially regulated by EWSR1–ETS fusions.
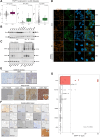
Figure 4. ENPP1 is a Ewing sarcoma surface protein with robust expression in Ewing sarcoma compared with other childhood sarcomas and normal pediatric tissues. A, ENPP1 is highly expressed in Ewing sarcoma models from publicly available sources. Points displayed on RNA graphs are limited to the 99th percentile to improve data visualization. P values are from the Wilcoxon signed rank test. B, Western blot analysis depicting elevated expression of ENPP1 in Ewing sarcoma cell lines versus negative control lines (MSC, mesenchymal stem cell; OS, osteosarcoma). Tubulin was used as a loading control. C, ENPP1 is highly expressed in the plasma membrane fractions of three Ewing sarcoma cell lines (A673, CHLA10, and TC32). SiHa, a uterine squamous cell carcinoma cell line, and U2OS, an osteosarcoma cell line, were used as negative controls. ATP1A1 was used as a plasma membrane marker expected to be expressed in all cell lines. Vinculin was used to demonstrate equal loading and successful depletion of the cytosolic fraction. D, Immunofluorescence demonstrating surface staining of ENPP1 in Ewing sarcoma cell lines, with limited expression displayed in non-Ewing sarcoma lines. Tubulin was used as a cytoskeleton marker for all lines. DAPI was used as a nuclear counterstain. E, Representative IHC staining of ENPP1 in a childhood sarcoma cohort, demonstrating variable Ewing sarcoma staining. ARMS, alveolar rhabdomyosarcoma; ERMS, embryonal rhabdomyosarcoma; OS, osteosarcoma; UDS, undifferentiated sarcoma. F, Representative IHC staining of ENPP1 in a tissue microarray (TMA) of 19 Ewing sarcoma tumors, 57 other pediatric cancers, and 21 normal pediatric tissues. G, Plotted are H-scores derived from multiplying the ENPP1 intensity value (0–3) by the percentage of coverage (0–100) in the childhood sarcoma and normal pediatric tissue cohorts. For samples where multiple cores were available, the average of these values was used. Samples are ranked on ascending average H-score. A P value was derived from ANOVA.
Figure 4.
ENPP1 is a Ewing sarcoma surface protein with robust expression in Ewing sarcoma compared with other childhood sarcomas and normal pediatric tissues. A, ENPP1 is highly expressed in Ewing sarcoma models from publicly available sources. Points displayed on RNA graphs are limited to the 99th percentile to improve data visualization. P values are from the Wilcoxon signed rank test. B, Western blot analysis depicting elevated expression of ENPP1 in Ewing sarcoma cell lines versus negative control lines (MSC, mesenchymal stem cell; OS, osteosarcoma). Tubulin was used as a loading control. C, ENPP1 is highly expressed in the plasma membrane fractions of three Ewing sarcoma cell lines (A673, CHLA10, and TC32). SiHa, a uterine squamous cell carcinoma cell line, and U2OS, an osteosarcoma cell line, were used as negative controls. ATP1A1 was used as a plasma membrane marker expected to be expressed in all cell lines. Vinculin was used to demonstrate equal loading and successful depletion of the cytosolic fraction. D, Immunofluorescence demonstrating surface staining of ENPP1 in Ewing sarcoma cell lines, with limited expression displayed in non-Ewing sarcoma lines. Tubulin was used as a cytoskeleton marker for all lines. DAPI was used as a nuclear counterstain. E, Representative IHC staining of ENPP1 in a childhood sarcoma cohort, demonstrating variable Ewing sarcoma staining. ARMS, alveolar rhabdomyosarcoma; ERMS, embryonal rhabdomyosarcoma; OS, osteosarcoma; UDS, undifferentiated sarcoma. F, Representative IHC staining of ENPP1 in a tissue microarray (TMA) of 19 Ewing sarcoma tumors, 57 other pediatric cancers, and 21 normal pediatric tissues. G, Plotted are H-scores derived from multiplying the ENPP1 intensity value (0–3) by the percentage of coverage (0–100) in the childhood sarcoma and normal pediatric tissue cohorts. For samples where multiple cores were available, the average of these values was used. Samples are ranked on ascending average H-score. A P value was derived from ANOVA.

Comment in

References

    1. Riggi N, Suvà ML, Stamenkovic I. Ewing's sarcoma. N Engl J Med 2021;384:154–64. - PubMed
    1. Delattre O, Zucman J, Plougastel B, Desmaze C, Melot T, Peter M, et al. . Gene fusion with an ETS DNA-binding domain caused by chromosome translocation in human tumours. Nature 1992;359:162–5. - PubMed
    1. Sorensen PH, Lessnick SL, Lopez-Terrada D, Liu XF, Triche TJ, Denny CT. A second Ewing's sarcoma translocation, t(21;22), fuses the EWS gene to another ETS-family transcription factor, ERG. Nat Genet 1994;6:146–51. - PubMed
    1. Grünewald TGP, Cidre-Aranaz F, Surdez D, Tomazou EM, de Álava E, Kovar H, et al. . Ewing sarcoma. Nat Rev Dis Primer 2018;4:5. - PubMed
    1. Finck A, Gill SI, June CH. Cancer immunotherapy comes of age and looks for maturity. Nat Commun 2020;11:3325. - PMC - PubMed

Publication types