. 2023 Oct 17;120(42):e2311983120.
doi: 10.1073/pnas.2311983120. Epub 2023 Oct 9.

Normal and Sjogren's syndrome models of the murine lacrimal gland studied at single-cell resolution

Affiliations

Normal and Sjogren's syndrome models of the murine lacrimal gland studied at single-cell resolution

Amir Rattner et al. Proc Natl Acad Sci U S A. .

Abstract

The lacrimal gland is of central interest in ophthalmology both as the source of the aqueous component of tear fluid and as the site of autoimmune pathology in the context of Sjogren's syndrome (SjS). To provide a foundational description of mouse lacrimal gland cell types and their patterns of gene expression, we have analyzed single-cell transcriptomes from wild-type (Balb/c) mice and from two genetically based SjS models, MRL/lpr and NOD (nonobese diabetic).H2b, and defined the localization of multiple cell-type-specific protein and mRNA markers. This analysis has uncovered a previously undescribed cell type, Car6+ cells, which are located at the junction of the acini and the connecting ducts. More than a dozen secreted polypeptides that are likely to be components of tear fluid are expressed by acinar cells and show pronounced sex differences in expression. Additional examples of gene expression heterogeneity within a single cell type were identified, including a gradient of Claudin4 along the length of the ductal system and cell-to-cell heterogeneity in transcription factor expression within acinar and myoepithelial cells. The patterns of expression of channels, transporters, and pumps in acinar, Car6+, and ductal cells make strong predictions regarding the mechanisms of water and electrolyte secretion. In MRL/lpr and NOD.H2b lacrimal glands, distinctive changes in parenchymal gene expression and in immune cell subsets reveal widespread interferon responses, a T cell-dominated infiltrate in the MRL/lpr model, and a mixed B cell and T cell infiltrate in the NOD.H2b model.

Keywords: autoimmunity; exocrine gland; lacrimal gland; ophthalmology; scRNAseq.


Conflict of interest statement

The authors declare no competing interest.

Figures

Fig. 1.
Fig. 1.
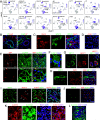
scRNAseq of WT adult mouse lacrimal glands. (A) UMAP plot of combined male and female lacrimal glands from 4-mo-old Balb/c mice. The principal cell clusters are differentially colored and labeled. (B) UMAP plots for 12 transcripts that are specifically expressed in only one or two cell clusters, as labeled. Ccl5, Csf3, and Cd3e expressing T cells localize to the right, left, and center, respectively, of the T cell cluster (red arrowheads in the lower right three panels). (C) Dot plot showing the abundances of 50 transcripts that discriminate among the major lacrimal gland cell clusters. Some highly abundant transcripts—e.g., Sval2, Obp1a, and Obplb—are present at high abundance in one cell type and appear to be present at reduced and uniform abundance in all other cell types. Where these transcripts have been visualized by ISH, they appear to be expressed only in the cell type with high abundance reads, implying that the smaller numbers of reads associated with all of the other cell types represent contaminating mRNA that originated from lysed cells during the cell dissociation procedure. In this and all other figures, lacrimal glands were harvested at ~4 mo of age. f, female; m, male.
Fig. 2.
Fig. 2.
Sex differences in acinar cell transcriptomes. (A) Scatter plot for whole lacrimal glands comparing male vs. female RNAseq read counts. (B) Immunostaining showing similar abundances of nuclear-localized transcription factor MIST1 in male and female acini, and male-specific expression of SLC27A2. (C) ISH showing sparse expression of Obp1a and Obp1b in partially overlapping subsets of male acinar cells, and variable, uncorrelated, and largely overlapping expression of Obp1a and Obp1b in female acinar cells. (D) Paired male and female UMAP plots showing seven transcripts, six of which are differentially expressed in male vs. female acinar and/or Car6+ cells. (Scale bars: 50 µm in B and C.)
Fig. 3.
Fig. 3.
Molecular markers for subsets of lacrimal gland cells. (A) UMAP plots showing ten transcripts corresponding to the markers used in (BL), with the expressing cell cluster(s) labeled. (B) ISH of luminal ductal marker Ltf and acinar and Car6+ cell marker Sval2, with fluorescent labels reversed in the two images. (C) ISH of a female lacrimal gland with luminal ductal marker Wfdc18 and acinar marker Obp1b. (D) ISH of a male lacrimal gland with plasma cell marker Jchain. (E) Immunostaining for myoepithelial marker SMA and acinar, luminal ductal, Car-6+, and myoepithelial cell marker CLDN10. Boxed regions are enlarged in the panels below and show the structure of a single acinus, with five acinar cells surrounding a central duct. (F) Spatially heterogeneous localization of CLDN10 in the surface membrane of an acinar cell. (G) Cross-section of three ducts showing luminal ductal cells visualized with NKCC1 immunostaining and basal ductal cells visualized with KRT17 immunostaining. (H) Longitudinal section through a duct showing basal ductal cells visualized with KRT17 immunostaining. SMA uniformly labels myoepithelial cells (white arrowhead) and pericytes surrounding a blood vessel (white arrow). KRT17 is present at variable abundance in myoepithelial cells. (I) Immunostaining for nuclear localized TFs MIST1 in acinar cells and Car6+ cells (arrowheads) and SOX10 in luminal ductal cells (arrows) and Car6+ cells (arrowheads). (J) Immunostaining for SMA and SOX10 in the cytoplasm and nucleus, respectively, in myoepithelial cells. (K) Variable abundance of MIST1 in different acinar cell nuclei (arrows). Nuclei occupy regions from which membrane-associated SLC27A2 is absent. Many acinar cells have two nuclei (pairs of arrows). (L) Immunostaining shows that SOX10 is excluded from acinar cells (marked by SLC27A2), is present in the vast majority of nuclei in ducts proximal to acini (white arrows), and is present in a far smaller fraction of nuclei in the larger distal ducts (arrowhead). [Scale bars: 50 µm in (BE) (Upper row), (HJ) and L; 25 µm in E (Lower row), F, G, and K.]
Fig. 4.
Fig. 4.
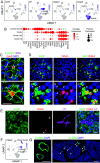
Molecular markers and spatial arrangement of Car6+ cells. (A) UMAP plots showing four transcripts corresponding to the markers used in (BE). (B) Dot plot showing the abundances of 21 transcripts that demonstrate the relationship among acinar cells, Car6+ cells, and luminal ductal cells. (C) Combined immunostaining for CLDN10 and SMA, and ISH for Car6. Car6-expressing cells are located at the central confluence of acinar cells within an acinus. (D) Partial overlap of Odam- and Car6-expressing cells. Odam transcripts are predominantly nuclear and Car6 transcripts are predominantly cytoplasmic. Arrows point to cells with Car6 transcripts that lack Odam transcripts. Boxed regions are enlarged in the panels below. (E) ISH shows nonoverlap of Car6+ cells expressing Odam and luminal ductal cells expressing Ltf. (F) UMAP plots showing Cldn4 transcripts in the basal ductal cell cluster and in a gradient within the luminal ductal cell cluster, with the highest expressing cells at the right side of the cluster. (G) CLDN4 immunostaining shows localization to ducts, with the most intense signal in large ducts (four arrows in the Right panel) and weaker signal in smaller ducts (four arrowheads in the Right panel). [Scale bars: 25 µm in (C and D), Lower row; 50 µm in (D), Upper row and (E); 50 µm in G, Left; and 200 µm in G, Right.]
Fig. 5.
Fig. 5.
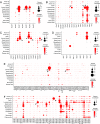
Dot plots showing the transcript abundances for transporters and channels in the major lacrimal gland cell types. For each plot, all family members with detectable expression in the scRNAseq data are shown. (A) Sodium–potassium ATPase subunits. Arrowheads, transcripts highly expressed in luminal ductal cells. (B) Chloride channels. Arrowheads, transcripts highly expressed in luminal ductal cells. (C) Claudins. Leftward arrowheads, the three most abundant Cldn transcripts in luminal ductal cells. Rightward arrowhead, Cldn10 transcripts in Car6+ cells. (D) Aquaporins. (E) Potassium channels. Arrowheads, Kcnn4 transcripts in Car6+ cells and luminal ductal cells and Kcnk1 transcripts in luminal ductal cells. (F) Slc transporters. Rightward arrowhead, Slc12a2 (Nkcc1) transcripts in luminal ductal cells. Leftward arrowhead, transcripts coding for Slc27a2, a long-chain fatty acid ligase, in male acinar cells (Fig. 2 B and D).
Fig. 6.
Fig. 6.
scRNAseq of female MRL/lpr and male NOD.H2b compared to female WT and male WT lacrimal glands from 4-mo-old mice. (A) UMAP comparison of combined male and female lacrimal glands (Left panel), female MRL/lpr (Center), and male NOD.H2b (Right). The principal cell clusters are differentially colored and labeled. (B) Pie charts showing the relative abundances of the major cell types in WT, MRL/lpr, and NOD.H2b lacrimal gland scRNAseq datasets. (C) UMAP plots showing the major immune cell populations (T cells, B cells, plasma cells, and monocytes) in WT female, WT male, female MRL/lpr, and male NOD.H2b lacrimal glands. (D and E) UMAP plots and dot plot validating the cluster assignments for the major immune cell types. (F) Relative abundances of the major immune cell types in the scRNAseq datasets.
Fig. 7.
Fig. 7.
Immune infiltrates in female MRL/lpr and male NOD.H2b lacrimal glands. (A) Lacrimal glands stained for acinar cells (CLDN10) and monocytes and monocyte-derived cells (PU.1; a nuclear marker). The four lower images show enlarged views of the indicated lacrimal glands stained for the same markers. The images labeled “a” and “b” correspond to the regions within the white rectangles in the two upper images. (B) Male NOD.H2b lacrimal gland stained for B cells and plasma cells (CD20) and T cells (CD3E). (C and D) Adjacent sections of a female MRL/lpr lacrimal gland immunostained in (C) as in panel (B) and immunostained in (D) for acinar cells (CLDN10), all immune cells (CD45), and CD4 T cells (CD4). (E) Female MRL/lpr lacrimal gland showing mutually exclusive expression of CD4 and CD8 among infiltrating T cells, and variable overlap of CD3E with both CD4 and CD8, with many cells that are CD3E positive and CD4 and CD8 negative. (Scale bars: 1 mm in the Upper two panels of (A), and in (BD); 100 µm in the Lower four panels in (A); and 50 µm in E.)
Fig. 8.
Fig. 8.
scRNAseq clustering and relative abundances of immune cell subtypes in WT and SjS model lacrimal glands. (A) UMAP plot showing combined scRNAseq data from 4-mo-old WT female, WT male, MRL/lpr female, and NOD.H2b male lacrimal gland immune cells. The principal cell clusters are differentially colored and labeled. DC, dendritic cells; pDC plasmacytoid DC; MC, monocytes; ILC, intrinsic lymphoid cells; MF, macrophages; NK, natural killer cells. Clusters labeled “8” and “16” are unidentified. (B) UMAP plots for eight transcripts that are specifically expressed in only one or two immune cell clusters. (C) Dot plot showing the abundances of 40 transcripts that discriminate among immune cell clusters. (D) Relative abundances of the immune cell subtypes in the scRNAseq datasets.

References

    1. Tsubota K., Tear dynamics and dry eye. Prog. Retin. Eye Res. 17, 565–596 (1998). - PubMed
    1. Tiffany J. M., The normal tear film. Dev. Ophthalmol. 41, 1–20 (2008). - PubMed
    1. Schechter J. E., Warren D. W., Mircheff A. K., A lacrimal gland is a lacrimal gland, but rodent’s and rabbit’s are not human. Ocul. Surf. 8, 111–134 (2010). - PubMed
    1. Pflugfelder S. C., Stern M. E., Biological functions of tear film. Exp. Eye Res. 197, 108115 (2020). - PMC - PubMed
    1. Garg A., Zhang X., Lacrimal gland development: From signaling interactions to regenerative medicine. Dev. Dyn. 246, 970–980 (2017). - PMC - PubMed

Publication types