. 2023 Oct 17;120(42):e2307972120.
doi: 10.1073/pnas.2307972120. Epub 2023 Oct 10.

Direct neuronal conversion of microglia/macrophages reinstates neurological function after stroke

Affiliations

Direct neuronal conversion of microglia/macrophages reinstates neurological function after stroke

Takashi Irie et al. Proc Natl Acad Sci U S A. .

Abstract

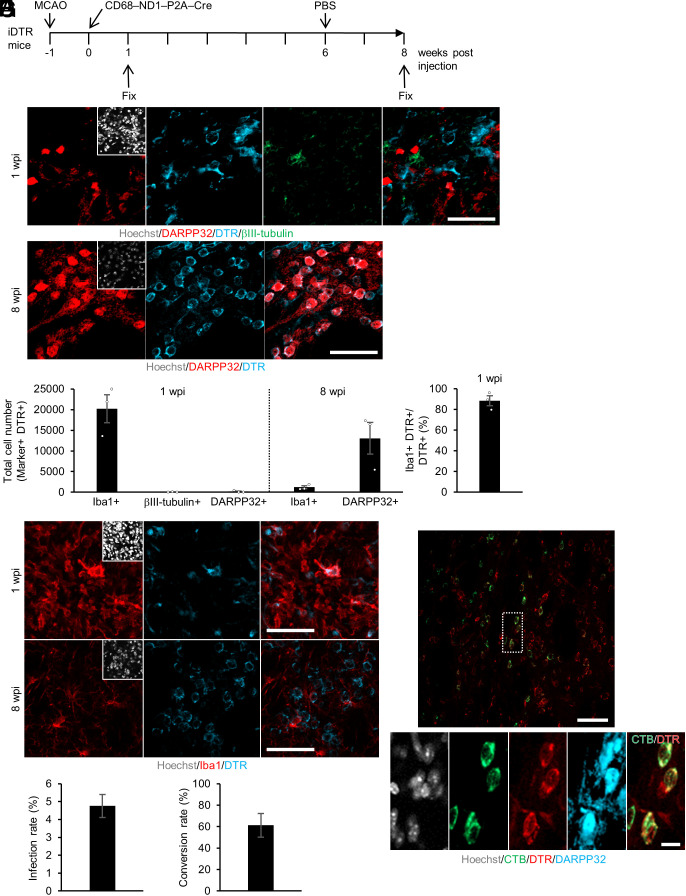
Although generating new neurons in the ischemic injured brain would be an ideal approach to replenish the lost neurons for repairing the damage, the adult mammalian brain retains only limited neurogenic capability. Here, we show that direct conversion of microglia/macrophages into neurons in the brain has great potential as a therapeutic strategy for ischemic brain injury. After transient middle cerebral artery occlusion in adult mice, microglia/macrophages converge at the lesion core of the striatum, where neuronal loss is prominent. Targeted expression of a neurogenic transcription factor, NeuroD1, in microglia/macrophages in the injured striatum enables their conversion into induced neuronal cells that functionally integrate into the existing neuronal circuits. Furthermore, NeuroD1-mediated induced neuronal cell generation significantly improves neurological function in the mouse stroke model, and ablation of these cells abolishes the gained functional recovery. Our findings thus demonstrate that neuronal conversion contributes directly to functional recovery after stroke.

Keywords: NeuroD1; direct reprogramming; microglia; stroke.


Conflict of interest statement

The authors declare no competing interest.

Figures

Fig. 1.
Fig. 1.
Microglia/macrophages accumulate in the ischemic core after tMCAO. (A) Representative images of staining for GFAP (yellow), DARPP32 (red), and Iba1 (cyan) in the ischemic striatum at 7 d after tMCAO. White dashed enclosure shows the peri-infarct area. Nuclei were stained with Hoechst (Scale bars, 500 μm). CC, corpus callosum. (B) Spatiotemporal distribution of microglia/macrophages after tMCAO. Representative images of staining for Tmem119 (red) and Iba1 (cyan) in the ischemic core of the striatum at 3, 7, 10, and 28 d after tMCAO. Nuclei were stained with Hoechst (Scale bar, 50 μm). (C) Quantification of indicated marker-positive cells in the ischemic core in (B) (n = 4 per group).
Fig. 2.
Fig. 2.
ND1 programs neuronal conversion from microglia/macrophages in the ischemic striatum. (A) Quantification of the indicated marker-positive cells in the striatum at 2 wpi (n = 4 per group). *P < 0.05, two-tailed Mann–Whitney U test. (B and C) Representative images of staining for EGFP (green)-, βIII-tubulin (red)-, and Map2ab (cyan)-positive cells in the ischemic area of control (B) and ND1 (C) virus-treated mice at 2 wpi (Scale bars, 50 μm). (D) Quantification of the indicated marker-positive cells in (B) and (C) (n = 4 per group). *P < 0.05, two-tailed Mann–Whitney U test. (E) Schematic representation of microglial depletion from the brain. (F) Representative images of staining for Tmem119 (red) in the striatum contralateral to the lesion in tMCAO mice treated with control or PLX diets at 2 wpi (Scale bar, 50 μm). (G) Representative images of staining for EGFP (green) and Map2ab (red) in the ischemic area of the striatum in tMCAO mice treated with control or PLX diets at 2 wpi (Scale bar, 50 μm). (H) Quantification of the indicated marker-positive cells in (G) (n = 4 per group). *P < 0.05, two-tailed Mann–Whitney U test.
Fig. 3.
Fig. 3.
ND1 converts microglia/macrophages into SPN-like cells in the ischemic striatum. (A) Representative images of staining for DARPP32 (red) and NeuN (cyan) in control and ND1 virus-treated ischemic hemispheres from bregma to 0.96 mm rostral at 8 wpi. White dashed enclosures show the DARPP32-negative area in the striatum (Scale bar, 1 mm). (B) Quantification of total DARPP32-negative area (Upper) in the striatum of the five slices in (A) (range from bregma to 0.96 mm rostral) (n = 8 mice per group), and soma area of DARPP32-positive cells in the periphery of the ischemic core (lower) within the same range (n = 100 cells per group). *P < 0.05, two-tailed Mann–Whitney U test. (C) Representative images of staining for EGFP (green), DARPP32 (red), and NeuN (cyan) in ND1 virus-injected striatum at 4 wpi (Scale bar, 10 μm). (D) Percentage of DARPP32-positive cells among EGFP-positive cells in control or ND1 virus-treated ischemic regions at 4 wpi (n = 4 per group). *P < 0.05, two-tailed Mann–Whitney U test. (E) Representative image of a recorded EGFP-positive iN cell labeled with biotin at 4 wk after ND1 transduction (Scale bar, 10 μm). (F) Representative traces of spontaneous firing activity of action potentials by the depolarizing current steps in an iN cell in the striatum under the current-clamp condition. The inset indicates the configuration of step-pulses elicited from the patch pipette (cumulative step stimulation from the resting potential with 10 pA for 500 ms duration). (G) Representative traces of spontaneous excitatory postsynaptic currents (sEPSCs) and spontaneous inhibitory postsynaptic currents (sIPSCs) recorded from iN cells, and bar graphs showing the frequency (Left) and amplitude (Right) of sEPSCs of control (n = 11 cells from 3 animals) and iN (n = 10 cells from 3 animals) cells and sIPSCs of control (n = 11 cells from 3 animals) and iN (n = 8 cells from 3 animals) cells in the striatum under the voltage-clamp condition.
Fig. 4.
Fig. 4.
iN cells survive in the injured region and project their axons into the globus pallidus. (A) Schematic representation of infected microglia/macrophages at 1 wpi and iN cells at 8 wpi in tMCAO mice injected with CD68–ND1–P2A–Cre lentivirus into the striatum. (B) Representative images of staining for DARPP32 (red), DTR (cyan), and βIII-tubulin (green) in the ischemic area of ND1–P2A–Cre virus-injected striatum at 1 wpi or staining for DARPP32 (red) and DTR (cyan) in the ischemic area of ND1–P2A–Cre virus-injected striatum at 8 wpi (Scale bars, 50 μm). (C) Quantification of the indicated marker-positive cells in the virus-injected area of the striatum (n = 3 per group). (D) Representative images of staining for Iba1 (red) and DTR (cyan) in the ischemic area of ND1–P2A–Cre virus-injected striatum at 1 or 8 wpi (Scale bars, 50 μm). (E) Infection rate of microglia/macrophages following virus injection into the striatum (n = 3 per group). (F) Neuronal conversion rate of microglia/macrophages in the striatum (n = 3 per group). (G) Representative images of staining for CTB (green), DTR (red), and DARPP32 (cyan) in the striatum of iDTR tMCAO model mice administered PBS. The mice were injected with CTB into the globus pallidus at 10 wk after CD68–ND1–P2A–Cre lentivirus injection. The Lower image group comprises magnified views of the white dashed box in the Upper panel [Scale bars, 50 μm (Upper), 10 μm (Lower)].
Fig. 5.
Fig. 5.
Microglia can be converted into iN cells. (A) Schematic representation of tamoxifen-triggered labeling of Hexb-expressing cells for fate mapping. Hexb–CreERT2::Stop–YFP mice were given tamoxifen intraperitoneally at P7 and P9, to permanently label Hexb-positive cells. (B) Representative images of staining for YFP (green) and Iba1 (magenta) in the contralateral striatum at 2 wpi (Scale bar, 50 μm). (C) Quantification of the indicated marker- and YFP-positive cells in the contralateral intact striatum (n = 3). (D and E) Representative images of staining for YFP (green) and βIII-tubulin (magenta) in the control or ND1 virus-injected ischemic area of the striatum at 2 wpi. The Right panels (E) are enlargements of the white dashed boxes in (D) (ischemic core and periphery) (Scale bars, 500 μm) (D), 50 μm (E). CC, corpus callosum. (F) Quantification of βIII-tubulin- and YFP-positive cells in the control or ND1 virus-injected ischemic area of the striatum (n = 3 per group). (G) Quantification of βIII-tubulin- and YFP-positive cells in ND1 virus-injected ischemic area of the striatum (n = 3 per group).
Fig. 6.
Fig. 6.
ND1-mediated microglia/macrophage-to-neuron conversion restores functional impairment after tMCAO. (A) Experimental timeline to investigate the functional recovery of tMCAO mice. (B) Time course of changes in scores in the elevated body swing test, cylinder test, corner test, and corner rotation test as indicated. Red lines, ND1 virus-treated tMCAO (tMCAO + ND1) group; blue lines, control virus-treated tMCAO (tMCAO + Control) group; gray lines, control virus-infected sham operation (Sham + Control) group (n = 8 per group). Dot plots display each value, with vertical lines representing mean ± SEM. ***P < 0.001, two-way repeated-measures ANOVA, post hoc Bonferroni’s multiple comparison test for tMCAO + ND1 vs. tMCAO + Control. #P < 0.05, ##P < 0.01, ###P < 0.001, two-way repeated-measures ANOVA, post hoc Bonferroni’s multiple comparison test for tMCAO + Control vs. Sham + Control. See also Movies S1–S6.
Fig. 7.
Fig. 7.
Ablation of iN cells abolishes gained functional recovery. (A) Schematic representation of the ablation of DTR-expressing cells after functional recovery was observed in tMCAO mice. (B) Representative images of staining for DARPP32 (red) and DTR (cyan) in the striatum of iDTR mice administered DT or PBS. Each rightmost panel is a magnified view of the white square in the panel to its left [Scale bars, 500 μm (Left), 50 μm (Right)]. CC, corpus callosum, LV, lateral ventricle. (C) Ablation rate of iN cells following DT administration in the virus-injected area of the striatum (n = 3 per group). (D) Time course of changes in scores in the indicated tests. iDTR tMCAO model mice were administered DT intraperitoneally at 6 wk after CD68–ND1–P2A–Cre (magenta line, ND1–Cre + DT at 6 wpi, n = 8) or CD68–ND1–P2A–EGFP (black line, ND1–EGFP + DT at 6 wpi, n = 8) lentiviral injection. Dot plots display each value, with vertical lines representing mean ± SEM. ***P < 0.001, two-way repeated-measures ANOVA and post hoc Bonferroni’s multiple comparison test.

References

    1. Niu W., et al. , In vivo reprogramming of astrocytes to neuroblasts in the adult brain. Nat. Cell Biol. 15, 1164–1175 (2013). - PMC - PubMed
    1. Torper O., et al. , Generation of induced neurons via direct conversion in vivo. Proc. Natl. Acad. Sci. U.S.A. 110, 7038–7043 (2013). - PMC - PubMed
    1. Guo Z., et al. , In vivo direct reprogramming of reactive glial cells into functional neurons after brain injury and in an Alzheimer’s disease model. Cell Stem Cell 14, 188–202 (2014). - PMC - PubMed
    1. Heinrich C., et al. , Sox2-mediated conversion of NG2 glia into induced neurons in the injured adult cerebral cortex. Stem Cell Rep. 3, 1000–1014 (2014). - PMC - PubMed
    1. Niu W., et al. , SOX2 reprograms resident astrocytes into neural progenitors in the adult brain. Stem Cell Rep. 4, 780–794 (2015). - PMC - PubMed

Publication types