. 2023 Oct 9;6(12):e202302312.
doi: 10.26508/lsa.202302312. Print 2023 Dec.

Fn14 promotes myoblast fusion during regenerative myogenesis

Affiliations

Fn14 promotes myoblast fusion during regenerative myogenesis

Meiricris Tomaz da Silva et al. Life Sci Alliance. .

Abstract

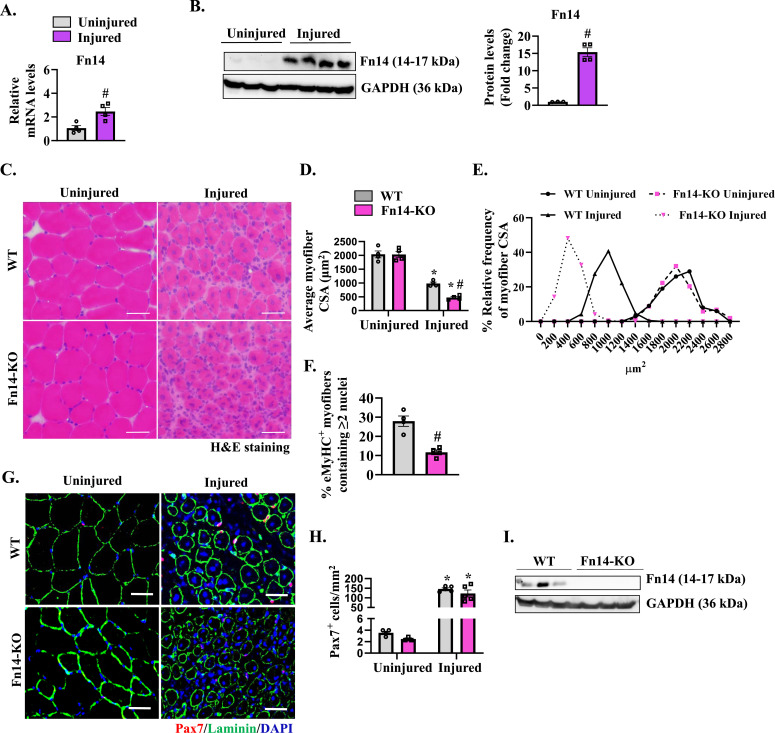
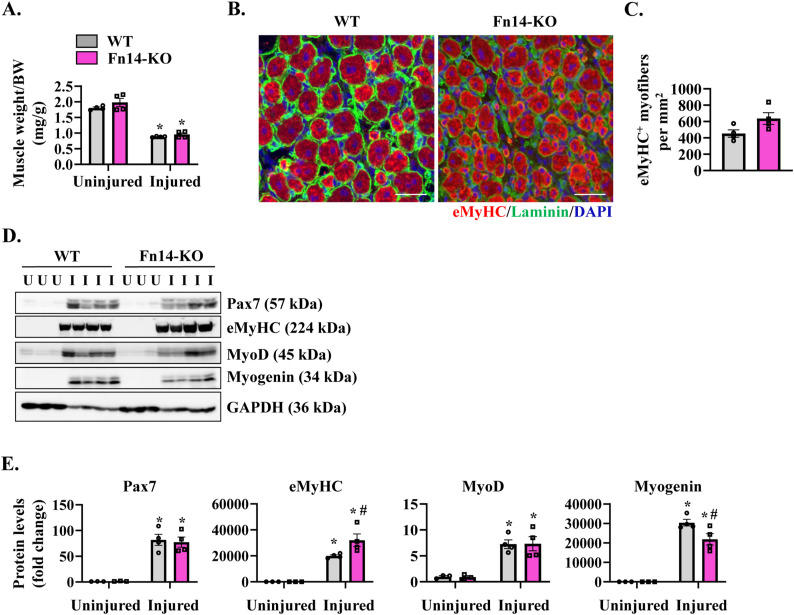
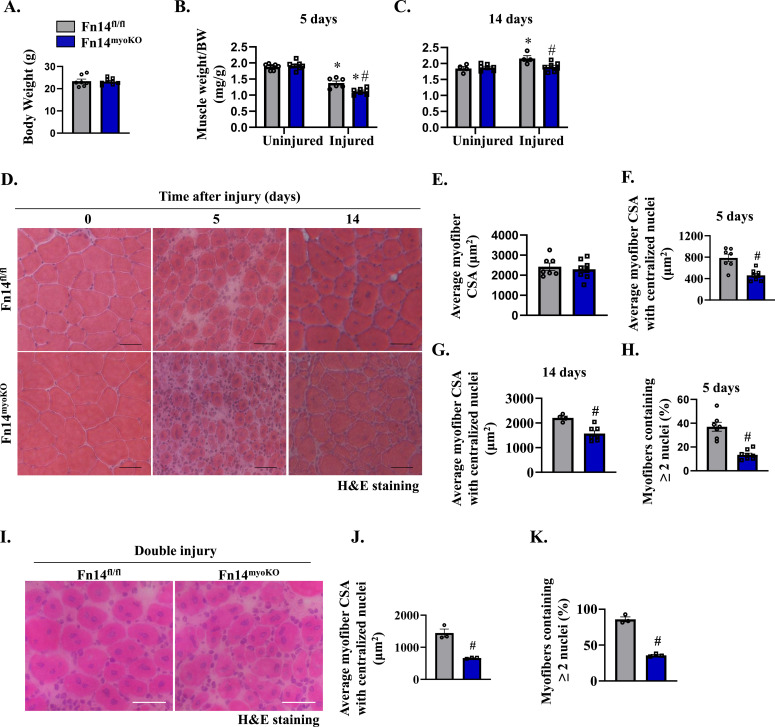
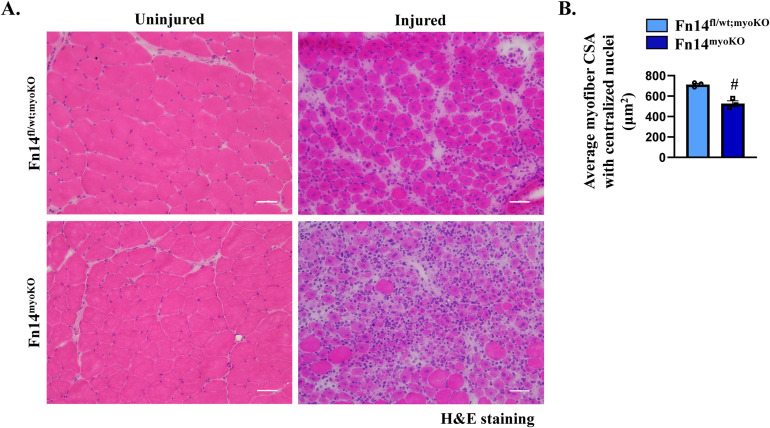
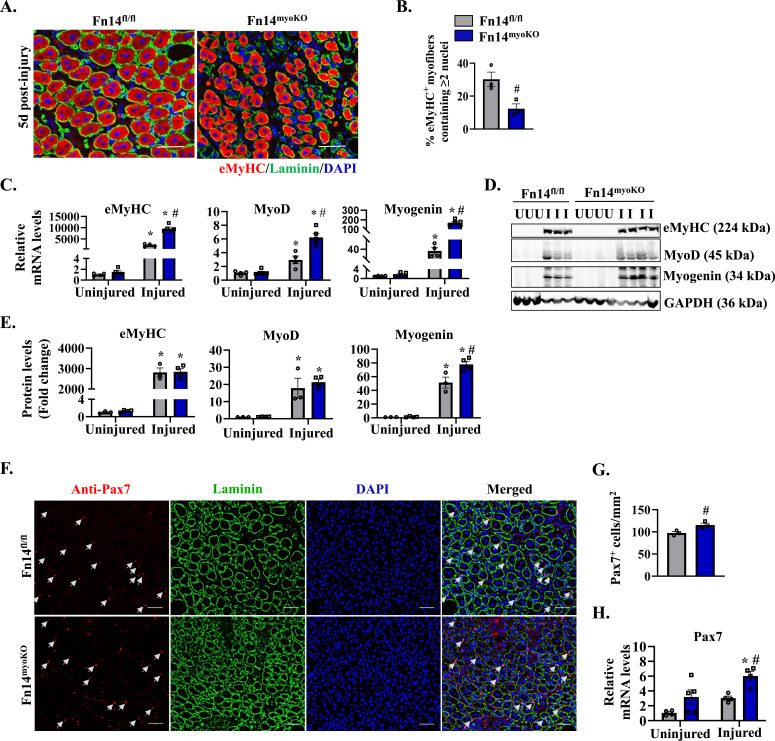
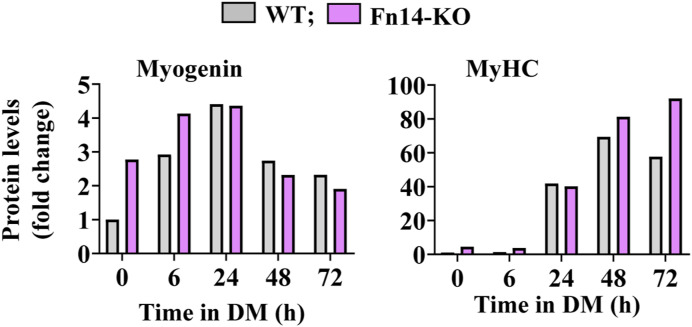
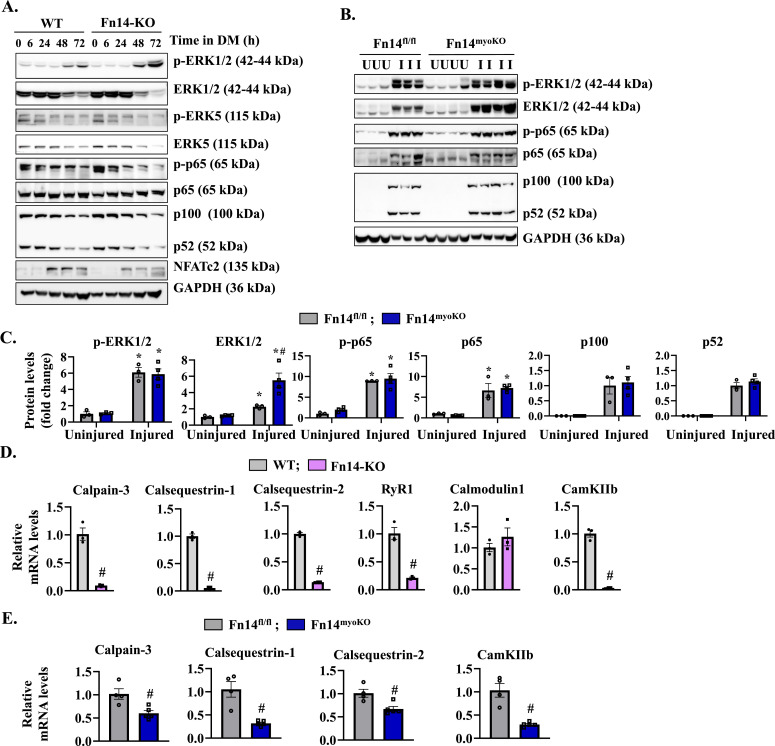
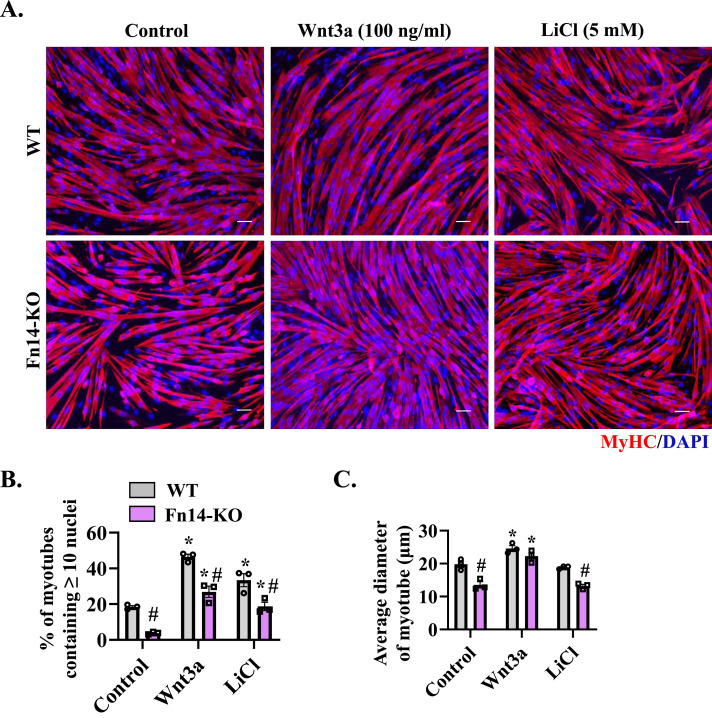
Skeletal muscle regeneration involves coordinated activation of an array of signaling pathways. Fibroblast growth factor-inducible 14 (Fn14) is a bona fide receptor for the TWEAK cytokine. Levels of Fn14 are increased in the skeletal muscle of mice after injury. However, the cell-autonomous role of Fn14 in muscle regeneration remains unknown. Here, we demonstrate that global deletion of the Fn14 receptor in mice attenuates muscle regeneration. Conditional ablation of Fn14 in myoblasts but not in differentiated myofibers of mice inhibits skeletal muscle regeneration. Fn14 promotes myoblast fusion without affecting the levels of myogenic regulatory factors in the regenerating muscle. Fn14 deletion in myoblasts hastens initial differentiation but impairs their fusion. The overexpression of Fn14 in myoblasts results in the formation of myotubes having an increased diameter after induction of differentiation. Ablation of Fn14 also reduces the levels of various components of canonical Wnt and calcium signaling both in vitro and in vivo. Forced activation of Wnt signaling rescues fusion defects in Fn14-deficient myoblast cultures. Collectively, our results demonstrate that Fn14-mediated signaling positively regulates myoblast fusion and skeletal muscle regeneration.


Conflict of interest statement

The authors declare that they have no conflict of interest.

Figures

Figure 1.
Figure 1.. Global ablation of Fn14 attenuates muscle regeneration in mice.
WT mice were given an intramuscular injection of saline alone or 1.2% BaCl2 solution in the TA muscle. After 5 d, the muscle was harvested and processed by qRT–PCR and Western blotting. (A) Relative mRNA levels of Fn14. n = 4. (B) Representative immunoblots and densitometry analysis showing the level of Fn14 protein in uninjured and injured TA muscles from WT mice. GAPDH was used as a loading control. n = 3. (C) Representative photomicrographs of uninjured and injured TA muscle transverse sections of WT and Fn14-KO mice after hematoxylin and eosin (H&E) staining. Scale bar: 50 μm. (D) Quantification of the average myofiber cross-sectional area with centralized nuclei. n = 4. (E) Relative frequency distribution of the myofiber cross-sectional area in uninjured and injured TA muscles of WT and Fn14-KO mice. (F) Percentage of eMyHC+ myofibers with two or more centrally located nuclei in 5d-injured TA muscle sections of WT and Fn14-KO mice. n = 4. (G) Representative photomicrographs of uninjured and 5d-injured TA muscle sections of WT and Fn14-KO mice after immunostaining for Pax7 (red) and laminin (green) proteins. Nuclei were identified by staining with DAPI. Scale bar: 50 μm. (H) Average number of Pax7+ cells per millimeter2. n = 3–5. (I) Representative Western blots showing Fn14 levels in the 5d-injured TA muscle of WT and Fn14-KO mice. GAPDH was used as a loading control. Data are presented as the mean ± SEM analyzed by an unpaired t test or by a two-way ANOVA followed by Tukey’s multiple-comparison test. *P ≤ 0.05, values significantly different from the corresponding uninjured muscle. #P ≤ 0.05, values significantly different from the corresponding muscle of WT mice. Source data are available for this figure.
Figure S1.
Figure S1.. Effect of global ablation of Fn14 on the markers of muscle regeneration.
(A) Wet weight of the TA muscle normalized by body weight in uninjured and injured muscles of WT and whole-body Fn14-KO mice. n = 4 per group. (B) Representative photomicrographs of 5d-injured TA muscle sections of WT and Fn14-KO mice after immunostaining for eMyHC (red) and laminin (green). Nuclei were counterstained with DAPI (blue). Scale bar: 50 μm. (C) Quantification of the number of eMyHC+ myofibers in the 5d-injured TA muscle of WT and Fn14-KO mice. (D, E) Representative immunoblots and (E) densitometry analysis of Pax7, eMyHC, MyoD, Myogenin, and MyHC proteins in uninjured and 5d-injured TA muscles of WT and Fn14-KO mice. GAPDH was used as a loading control. n = 3–4 per group. Data are presented as the mean ± SEM analyzed by a two-way ANOVA followed by Tukey’s multiple-comparison test. *P ≤ 0.05, values significantly different from the corresponding uninjured muscle. #P ≤ 0.05, values significantly different from the corresponding muscle of WT mice. U, uninjured; I, injured. Source data are available for this figure.
Figure S2.
Figure S2.. Myofiber-specific ablation of Fn14 does not affect regenerative myogenesis.
(A) Fn14fl/fl mice were crossed with muscle creatine kinase-Cre mice to generate muscle-specific Fn14-knockout (Fn14mKO) mice and littermate Fn14fl/fl mice. Adapted from “Generation of Cre-LoxP-mediated Conditional Knockout Mice,” by BioRender.com (2023). (B) Average body weight of 8-wk-old littermate Fn14fl/fl and Fn14mKO mice. n = 3 per group. (C) Wet weight of uninjured and 5d-injured TA muscles normalized by body weight in Fn14fl/fl and Fn14mKO mice. n = 3–6 per group. (D) Representative photomicrographs of hematoxylin-and-eosin (H&E)–stained sections of uninjured and 5d-injured TA muscles of Fn14fl/fl and Fn14mKO mice. Scale bar: 50 μm. (E) Quantification of the average myofiber cross-sectional area with centralized nuclei. n = 3–6 in each group. (F) Percentage of myofibers with two or more centrally located nuclei in 5d-injured TA muscle sections of Fn14fl/fl and Fn14mKO mice. n = 3–5 per group. (G) Representative photomicrographs of 5d-injured TA muscle sections of Fn14fl/fl and Fn14mKO mice after immunostaining for eMyHC (red) and laminin (green) proteins. Nuclei were counterstained with DAPI (blue). Scale bar: 50 μm. Data are presented as the mean ± SEM by an unpaired t test or by a two-way ANOVA followed by Tukey’s multiple-comparison test. *P ≤ 0.05, values significantly different from the corresponding uninjured muscle.
Figure 2.
Figure 2.. Myoblast-specific ablation of Fn14 inhibits muscle regeneration in mice.
(A) Average body weight of 8-wk-old littermate Fn14fl/fl and Fn14myoKO mice. (B, C) Wet weight of uninjured and injured TA muscles at (B) day 5 and (C) day 14 normalized by body weight of Fn14fl/fl and Fn14myoKO mice. n = 6–8 per group. (D) Representative photomicrographs of hematoxylin-and-eosin (H&E)–stained sections at days 0, 5, and 14 after intramuscular injection of BaCl2 in the TA muscle of Fn14fl/fl and Fn14myoKO mice. Scale bar: 50 μm. (E) Quantification of the average myofiber cross-sectional area (CSA) in the uninjured TA muscle of Fn14fl/fl and Fn14myoKO mice. (F, G) Average myofiber CSA with centralized nuclei (F) at day 5 post-injury (n = 7–8) and (G) at day 14 post-injury (n = 4–7). (H) Percentage of myofibers containing two or more centrally located nuclei in the 5d-injured TA muscle of Fn14fl/fl and Fn14myoKO mice. n = 7–8 per group. After 21 d of the first injury, the TA muscle of Fn14fl/fl and Fn14myoKO mice was again given an intramuscular injection of 50 μl of 1.2% BaCl2 solution, and the muscle was analyzed at day 5. (I, J, K) Representative photomicrograph of H&E-stained TA muscle sections, and quantification of (J) the average myofiber CSA and (K) the percentage of myofibers containing two or more centrally located nuclei. Scale bar: 50 μm. n = 3 per group. Data are presented as the mean ± SEM analyzed by an unpaired t test or by a two-way ANOVA followed by Tukey’s multiple-comparison test. *P ≤ 0.05, values significantly different from the corresponding uninjured muscle. #P ≤ 0.05, values significantly different from the corresponding muscle of Fn14fl/fl mice.
Figure S3.
Figure S3.. Homozygous deletion of Fn14 in myoblasts inhibits muscle regeneration.
(A) Representative photomicrographs of hematoxylin-and-eosin (H&E)–stained sections of uninjured and injured TA muscles of Fn14fl/wt; Myod1-Cre and Fn14myoKO mice. Scale bar: 50 μm. (B) Quantification of the average myofiber cross-sectional area with centralized nuclei. n = 3–6 per group. Data are presented as the mean ± SEM analyzed by an unpaired t test. #P ≤ 0.05, values significantly different from the corresponding injured TA muscle of Fn14fl/wt; Myod1-Cre mice.
Figure 3.
Figure 3.. Deletion of Fn14 in myoblasts reduces myofiber regeneration in adult mice.
(A) Representative photomicrographs of 5d-injured TA muscle sections of Fn14fl/fl and Fn14myoKO mice after immunostaining for eMyHC (red) and laminin (green). Nuclei were counterstained with DAPI (blue). Scale bar: 50 μm. (B) Percentage of eMyHC+ myofibers with two or more centrally located nuclei in 5d-injured TA muscle sections of Fn14fl/fl and Fn14myoKO mice. n = 3 per group. Data are presented as the mean ± SEM. #P ≤ 0.05, values significantly different from the corresponding injured TA muscle of Fn14fl/fl mice by an unpaired t test. (C) Relative mRNA levels of eMyHC, MyoD, and myogenin in uninjured and 5d-injured TA muscles of Fn14fl/fl and Fn14myoKO mice assayed by performing qRT–PCR. n = 4–5 per group. (D, E) Immunoblots and (E) densitometry analysis showing levels of eMyHC, MyoD, and myogenin proteins in uninjured and 5d-injured TA muscles from Fn14fl/fl and Fn14myoKO mice. GAPDH was used as a loading control. n = 3–4 per group. (F) Representative photomicrographs of uninjured and 5d-injured TA muscle sections of Fn14fl/fl and Fn14myoKO mice after immunostaining for Pax7 (red) and laminin (green). Nuclei were identified by staining with DAPI. Scale bar: 50 μm. (G) Average number of Pax7-positive cells per millimeter2. n = 3 per group. (H) Relative mRNA levels of Pax7 of uninjured and 5d-injured TA muscles of Fn14fl/fl and Fn14myoKO mice. n = 4–5 per group. Data are presented as the mean ± SEM analyzed by an unpaired t test or by a two-way ANOVA followed by Tukey’s multiple-comparison test. *P ≤ 0.05, values significantly different from the corresponding uninjured muscle. #P ≤ 0.05, values significantly different from the corresponding muscle of Fn14fl/fl mice. Source data are available for this figure.
Figure 4.
Figure 4.. Fn14 mediates myoblast fusion during skeletal muscle regeneration.
The TA muscle of 8-wk-old Fn14fl/fl and Fn14myoKO mice was injured by intramuscular injection of 50 μl of 1.2% BaCl2 solution. After 3 d, the mice were given an intraperitoneal injection of EdU. After 11 d, the TA muscle was collected and muscle sections prepared were stained to detect EdU, laminin, and nuclei. (A) Representative photomicrographs after EdU (green), laminin (red), and DAPI (blue) staining are presented here. Scale bar: 50 μm. (B) Quantification of the percentage of EdU+ nuclei per myofiber. n = 4–5 per group. (C) Percentage of myofibers containing two or more EDU+ centrally located nuclei in the TA muscle of Fn14fl/fl and Fn14myoKO mice. n = 4–5 per group. (D) Representative photomicrographs of 14d-injured TA muscle sections of Fn14fl/fl and Fn14myoKO mice after immunostaining for eMyHC (red) and laminin (green). Nuclei were counterstained with DAPI (blue). Scale bar: 50 μm. (E) Percentage of eMyHC+ myofibers with two or more centrally located nuclei in 14d-injured TA muscle sections of Fn14fl/fl and Fn14myoKO mice. n = 4 per group. (F) Relative mRNA levels of various profusion molecules assayed by performing qRT–PCR in the 5d-injured TA muscle of Fn14fl/fl and Fn14myoKO mice. n = 3–5 per group. Data are presented as the mean ± SEM analyzed by an unpaired t test. #P ≤ 0.05, values significantly different from the corresponding injured TA muscle of Fn14fl/fl mice.
Figure 5.
Figure 5.. Fn14 mediates myoblast fusion in vitro.
Primary myoblasts isolated from hindlimb muscles of WT and Fn14-KO mice were plated at equal densities and incubated in the growth medium or the differentiation medium for 48 h followed by RNA-Seq analysis. (A) Volcano plot from RNA-Seq analysis of myoblasts of Fn14-KO mice versus WT illustrating down-regulated (red dots) and up-regulated (blue dots) genes with a threshold of log2FC ≥ |0.5| and P-value ≤ 0.05. (B) Gene ontology (GO) biological processes associated with down-regulated and up-regulated genes. (C) Heatmap showing regulation of selected genes involved in myogenesis and myoblast fusion. (D) Primary myoblasts of WT and Fn14-KO mice were plated at equal densities and incubated in DM for 6, 24, or 48 h followed by staining for MyHC (red) and DAPI (blue). Photomicrographs are presented here. Scale bar: 50 μm. (E) Quantification of the number of mononucleated MyHC+ cells per unit area (∼1.75 mm2) in WT and Fn14-KO cultures after 6, 24, or 48 h of incubation in DM. n = 3 per group. (F) Quantification of the fusion index in WT and Fn14-KO cultures after 24 or 48 h of addition of DM. We measured the percentage of MyHC+ nuclei that were inside the myotubes containing between 2 and 4 nuclei (2–4), the percentage of MyHC+ nuclei that were inside the myotubes containing between 5 and 10 nuclei (5–10), and the percentage of MyHC+ nuclei that were inside the myotubes containing more than 10 nuclei (>10). n = 3 in each group. (G) Immunoblots showing protein levels of myogenin, MyHC, Fn14, and GAPDH in WT and Fn14-KO cultures at 0, 6, 24, 48, and 72 h after incubation in DM. (H) Primary myoblasts prepared from WT mice were transduced with the retrovirus expressing EGFP (control) or Fn14 and incubated in DM for 48 h followed by staining for MyHC protein. Nuclei were stained with DAPI. Scale bar: 50 μm. (I) Average diameter of myotubes in control and Fn14-overexpressing (OE) cultures after 48 h of addition of DM. n = 3 per group. Data are presented as the mean ± SEM analyzed by an unpaired t test. #P ≤ 0.05, values significantly different from the corresponding WT or control myotube by an unpaired t test. Source data are available for this figure.
Figure S4.
Figure S4.. Network of enriched terms derived from down-regulated and up-regulates genes in Fn14-KO myoblasts versus WT myoblasts using the Metascape gene annotation and analysis tool.
Figure S5.
Figure S5.. Densitometry analysis of levels of myogenin and MyHC proteins in cultured WT and Fn14-KO myoblasts at indicated time points after incubation in DM.
Figure S6.
Figure S6.. Effect of overexpression of Fn14 on protein levels of MRFs, p38, and Akt in cultured myoblasts.
(A, B) Representative immunoblots, and (B) densitometry analysis showing MyoD, Myogenin, MyHC, and Fn14 protein levels in control and Fn14-overexpressing (Fn14-OE) cultures at 0 and 48 h of addition of DM. GAPDH was used as a loading control. n = 3. (C) Immunoblots showing levels of phosphorylated and total p38, and phosphorylated and total Akt proteins in control and Fn14-OE cultures at 0 and 48 h of addition of DM. (D, E) Densitometry analysis of (D) phosphorylated and total p38 protein, and (E) phosphorylated and total Akt protein. n = 3 per group. Data are presented as the mean ± SEM analyzed by a two-way ANOVA followed by Tukey’s multiple-comparison test. *P ≤ 0.05, values significantly different from corresponding 0-h cultures. #P ≤ 0.05, values significantly different from corresponding control cultures. Source data are available for this figure.
Figure 6.
Figure 6.. Fn14 regulates components of calcium signaling.
(A) Primary myoblasts prepared from WT and Fn14-KO mice were incubated in DM, and samples were collected at indicated time points. Representative immunoblots showing levels of phosphorylated and total ERK1/2, phosphorylated and total ERK5, phosphorylated and total p65, and total p100, p52, NFATc2, and unrelated protein GAPDH in WT and Fn14-KO cultures. (B, C) Representative immunoblots, and (C) densitometry analysis showing levels of phosphorylated and total ERK1/2, phosphorylated and total p65, and total p100 and p52 protein levels in uninjured and 5d-injured TA muscles of Fn14fl/fl and Fn14myoKO mice. GAPDH was used as a loading control. n = 3–4 per group. Data are presented as the mean ± SEM analyzed by a two-way ANOVA followed by Tukey’s multiple-comparison test. (D) Relative mRNA levels of calpain-3, calsequestrin-1 and calsequestrin-2, RyR1, calmodulin1, and CamKIIb in WT and FN14-KO myoblast cultures. n = 3 per group. (E) Relative mRNA levels of calpain-3, calsequestrin-1 and calsequestrin-2, and CamKIIb in the 5d-injured TA muscle of Fn14fl/fl and Fn14myoKO mice. n = 3–5 per group. Data are presented as the mean ± SEM analyzed by an unpaired t test or by a two-way ANOVA followed by Tukey’s multiple-comparison test. *P ≤ 0.05, values significantly different from the corresponding uninjured muscle. #P ≤ 0.05, values significantly different from the corresponding WT myoblast or Fn14fl/fl mice. Source data are available for this figure.
Figure 7.
Figure 7.. Fn14 regulates Wnt signaling during myogenesis.
(A) Heatmap showing the expression of genes involved in Wnt signaling in WT and Fn14-KO mice incubated in the growth medium (GM) or the differentiation medium (DM) for 48 h. (B) Representative immunoblots showing levels of Wnt3a, phospho-GSK-3β, MyD88, and unrelated protein GAPDH in WT and Fn14-KO cultures at different time points after addition of DM. (C, D, E) Relative mRNA levels of (C) Wnt ligands: Wnt3, Wnt4, Wnt5A, Wnt7A, and Wnt11; (D) Wnt receptors: Fzd2, Fzd4, and Fzd6; and (E) Wnt target gene: Axin-2 in the 5d-injured TA muscle of Fn14fl/fl and Fn14myoKO mice. n = 3–5 per group. (F, G, H) Relative mRNA levels of (F) Wnt ligands: Wnt3, Wnt4, Wnt5A, Wnt7A, and Wnt11; (G) Wnt receptors: Fzd1, Fzd2, Fzd4, and Fzd6; and (H) Wnt target: Axin-2 in control and Fn14-OE cultured myoblasts. n = 3 per group. Data are presented as the mean ± SEM analyzed by an unpaired t test. #P ≤ 0.05, values significantly different from the corresponding injured TA muscle of Fn14fl/fl mice or control myoblast cultures. Source data are available for this figure.
Figure 8.
Figure 8.. Forced activation of Wnt signaling improves myoblast fusion in Fn14-KO myoblasts.
(A) WT and Fn14-KO primary myoblasts were plated at equal densities and incubated in DM with a vehicle alone or 100 ng/ml Wnt3a protein or 5 mM LiCl for 48 h. The cultures were fixed and stained for MyHC (red) and DAPI (blue). Representative photomicrographs are presented here. Scale bar: 50 μm. (B) Quantification of the percentage of myotubes containing ≥ 10 nuclei in control-, Wnt3a-, and LiCl-treated WT and Fn14-KO cultures. n = 3 per group. (C) Average diameter of myotubes in control-, Wnt3a-, and LiCl-treated WT and Fn14-KO cultures. n = 3 per group. Data are presented as the mean ± SEM analyzed by a two-way ANOVA followed by Tukey’s multiple-comparison test. *P ≤ 0.05, values significantly different from the corresponding control myotube. #P ≤ 0.05, values significantly different from corresponding WT myoblast cultures.

References

    1. Abmayr SM, Pavlath GK (2012) Myoblast fusion: Lessons from flies and mice. Development 139: 641–656. 10.1242/dev.068353 - DOI - PMC - PubMed
    1. Benjamini Y, Hochberg Y (1995) Controlling the false discovery rate: A practical and powerful approach to multiple testing. J R Stat Soc Ser B (Methodological) 57: 289–300. 10.1111/j.2517-6161.1995.tb02031.x - DOI
    1. Bi P, Ramirez-Martinez A, Li H, Cannavino J, McAnally JR, Shelton JM, Sanchez-Ortiz E, Bassel-Duby R, Olson EN (2017) Control of muscle formation by the fusogenic micropeptide myomixer. Science 356: 323–327. 10.1126/science.aam9361 - DOI - PMC - PubMed
    1. Bijlenga P, Liu JH, Espinos E, Haenggeli CA, Fischer-Lougheed J, Bader CR, Bernheim L (2000) T-type alpha 1H Ca2+ channels are involved in Ca2+ signaling during terminal differentiation (fusion) of human myoblasts. Proc Natl Acad Sci U S A 97: 7627–7632. 10.1073/pnas.97.13.7627 - DOI - PMC - PubMed
    1. Bowerman M, Salsac C, Coque E, Eiselt E, Deschaumes RG, Brodovitch A, Burkly LC, Scamps F, Raoul C (2015) Tweak regulates astrogliosis, microgliosis and skeletal muscle atrophy in a mouse model of amyotrophic lateral sclerosis. Hum Mol Genet 24: 3440–3456. 10.1093/hmg/ddv094 - DOI - PubMed

Publication types

LinkOut - more resources