. 2023 Oct 9;14(1):6295.
doi: 10.1038/s41467-023-41792-8.

Systematic identification of gene combinations to target in innate immune cells to enhance T cell activation

Affiliations

Systematic identification of gene combinations to target in innate immune cells to enhance T cell activation

Lei Xia et al. Nat Commun. .

Abstract

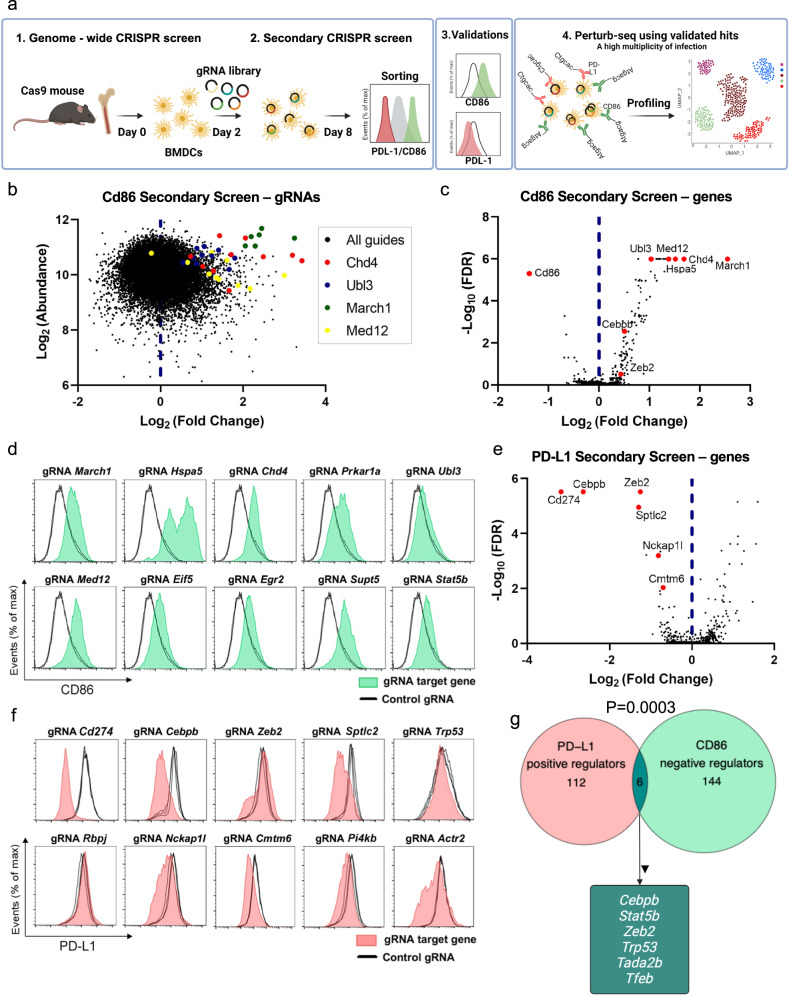
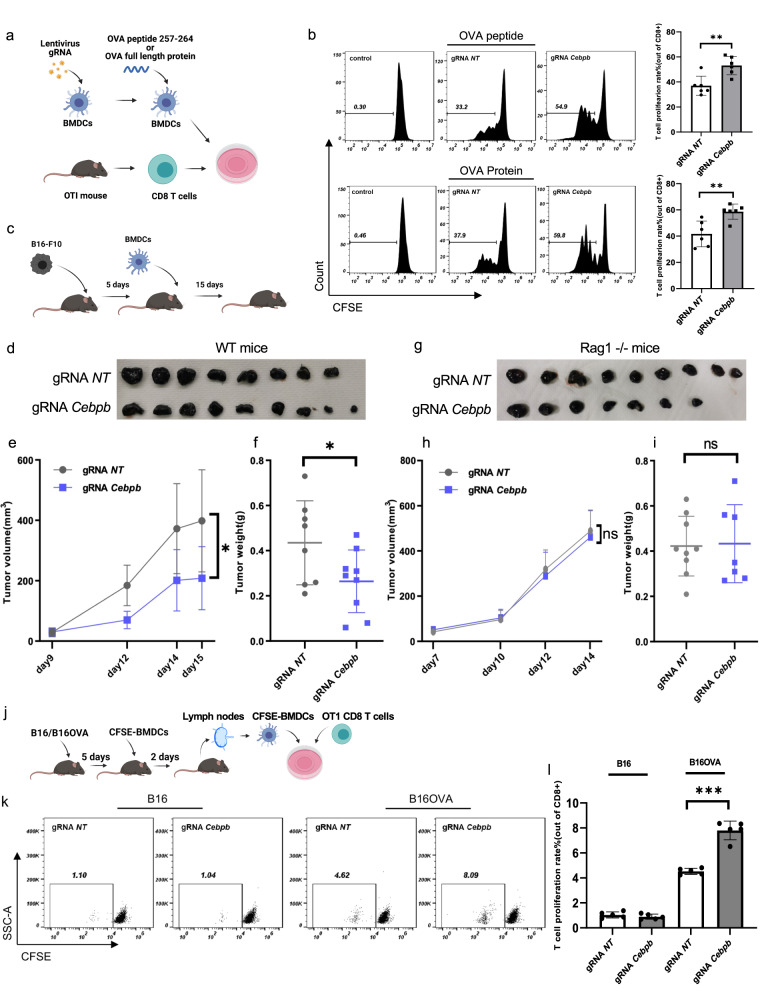
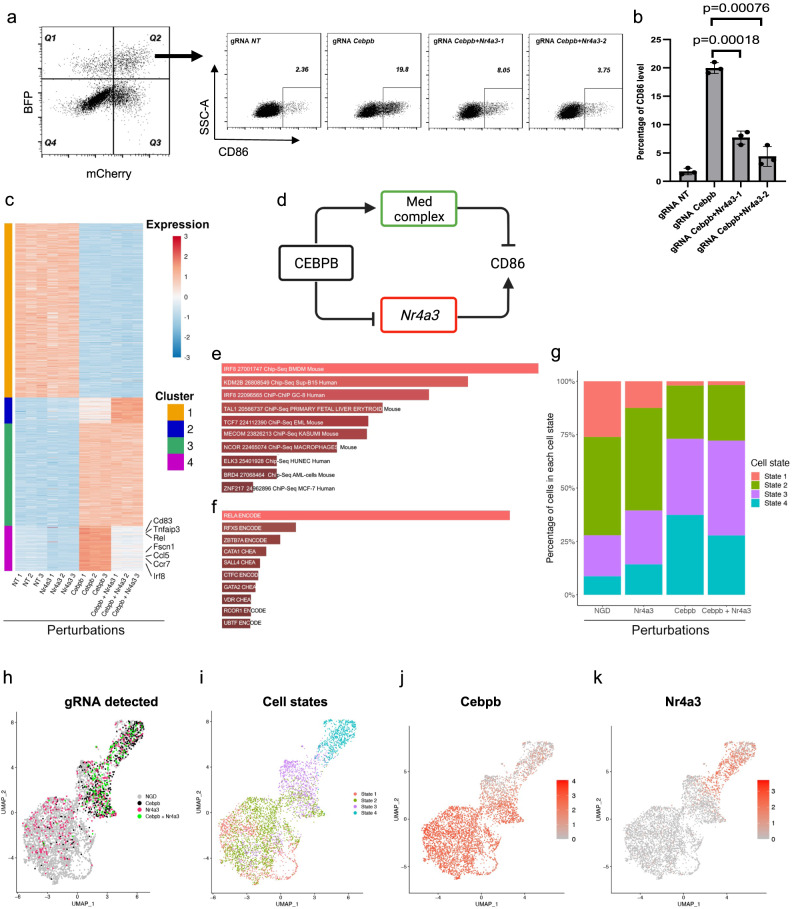
Genetic engineering of immune cells has opened new avenues for improving their functionality but it remains a challenge to pinpoint which genes or combination of genes are the most beneficial to target. Here, we conduct High Multiplicity of Perturbations and Cellular Indexing of Transcriptomes and Epitopes (HMPCITE-seq) to find combinations of genes whose joint targeting improves antigen-presenting cell activity and enhances their ability to activate T cells. Specifically, we perform two genome-wide CRISPR screens in bone marrow dendritic cells and identify negative regulators of CD86, that participate in the co-stimulation programs, including Chd4, Stat5b, Egr2, Med12, and positive regulators of PD-L1, that participate in the co-inhibitory programs, including Sptlc2, Nckap1l, and Pi4kb. To identify the genetic interactions between top-ranked genes and find superior combinations to target, we perform high-order Perturb-Seq experiments and we show that targeting both Cebpb and Med12 results in a better phenotype compared to the single perturbations or other combinations of perturbations.


Conflict of interest statement

The authors declare no competing interest.

Figures

Fig. 1
Fig. 1. CRISPR screens to identify regulators of CD86 and PD-L1.
a Workflow of High Multiplicity of Perturbations and Cellular Indexing of Transcriptomes and Epitopes by sequencing (HMPCITE-seq). b Enrichment of gRNAs in the secondary screen for regulators of CD86. Log2 fold change of gRNA normalized counts in CD86High sorted cells divided by CD86Low sorted cells (x axis). Average abundance of gRNAs normalized counts (y axis). c A volcano plot showing the results for each gene in the CD86 secondary screen. Log-transformed false discovery rate (FDR) was calculated based on the MAGeCK algorithm (y axis). d FACS analysis of the top ten negative regulators of CD86 according to the secondary screen. Plots are ordered according to the gene ranking. In each plot, CD86 levels of targeted genes are colored in green, and two non-targeting gRNAs in black. For each gene a representative graph of 3–6 experiments using two different gRNAs, is shown. e A volcano plot, similar to (c) showing the results for each gene in the PD-L1 secondary screen. f FACS analysis of the top ten positive regulators of PD-L1 according to the secondary screen. Plots are ordered according to the gene ranking. In each plot, PD-L1 levels of targeted genes are colored in red, and non-targeting gRNAs in black. For each gene a representative graph of a total of 3–6 different experiments using two different gRNAs, is shown. g Overlap of top-ranked genes in the CD86 and PD-L1 secondary screens (p value was calculated using a hypergeometric test). Source data are provided as a Source Data file.
Fig. 2
Fig. 2. Targeting Cebpb in BMDCs improves T-cell priming and reduces tumor growth.
a Workflow of the experimental setting. b FACS analysis of CFSE-positive cells showing T-cell proliferation. For the experiment in the upper panel OVA peptide (257–264) was added to the BMDCs, and in the lower panel OVA full-length protein was added to the BMDCs (p = 0.0039 in the upper and p = 0.0064 in the lower panel, two-tailed unpaired t-test, n = 6 independent samples). c Workflow of the experimental setting in vivo. d, g Photos of B16 tumors from C57BL/6J mice (d) or C57BL/6J Rag1−/− mice (g). e, h The graphs show tumor volume V = (W 2 × L)/2. C57BL/6J mice were used, in (e) (p = 0.0186, unpaired, two-tailed t-test, n = 9 mice), and C57BL/6J Rag1−/− mice in (h) (n = 9 mice). f, i Tumor weight was measured at the end of the experiment from the same mice that are shown in (e) and (h), respectively. In (f) p = 0.047, two-tailed unpaired t-test. j CFSE-labeled gRNA-NT or gRNA-Cebpb BMDCs were injected to the tumor site. Two days later, the CFSE-positive cells were sorted from the lymph node (LN) of tumor-bearing mice and co-cultured with CFSE-labeled OT-I CD8 T cells. k In the left two panels B16 cells were used and in the right two panels B16-OVA cells were used. n = 5 independent samples. l Quantification of the experiment that is shown in (k) (p = 0.0003, two-tailed unpaired t-test). Data are presented as mean values ± SD in all the graphs (***P < 0.001, **P value < 0.01, *P value < 0.05). Source data are provided as a Source Data file.
Fig. 3
Fig. 3. Genetic interactions between Cebpb and Nr4a3.
a The expression of CD86 in Cebpb and Cebpb Nr4a3 targeted cells. Cells were gated according to the expression of mCherry and BFP (left plot). Two different gRNAs were used to target Nr4a3. b Quantification of the experiment that is shown in (a). The y axis shows the percentage of CD86 positive cells (two-tailed unpaired t-test. n = 3 independent samples). Data are presented as mean values ± SD. Source data are provided as a Source Data file. c RNA-Seq experiment that included cells with different gRNAs. For each gRNA, n = 3 independent samples. Differentially expressed genes between cells that carry gRNAs-Cebpb and gRNAs-NT are shown in the heatmap. K-mean clustering (k = 4) was applied, and the expression value was Z-score standardized across different treatments. d Cartoon showing genetic interactions with Cebpb. e Enrichment analysis of genes that were assigned to cluster 3 of the heatmap that is shown in (c), source data are provided as Supplementary Data 8. f Enrichment analysis of genes that were assigned to cluster 4 of the heatmap that is shown in (c), source data are provided as Supplementary Data 8. g–k ScRNA-seq of cells that were infected with gRNA-Cebpb and gRNA-Nr4a3. 4740 cells are presented. g Percentages for each cell state are shown on the y axis. h Uniform manifold approximation and projection (UMAP) showing which gRNAs are expressed by each cell. NGD, no guide detected. i UMAP showing the distribution of cell states. j UMAP is colored according to the normalized expression of Cebpb mRNA in different cells. k UMAP is colored according to the normalized expression of Nr4a3 mRNA in different cells.
Fig. 4
Fig. 4. The effect of key regulators on the transcription program.
a Cells were infected with the pool of selected gRNAs at a high multiplicity of infection (MOI). CD11c-positive cells were sorted and stained with oligo-conjugated anti-CD86, anti-PDL1, and anti-MHC-I/CD45 hashing antibodies. Finally, cells were pooled together for single-cell RNA sequencing. 21,922 cells were included in the analysis. Source data are provided as Supplementary Data 16 and 17. b The expression of top variable genes. Each row represents a different gRNA, each column represents a gene. Only cells that express a single gRNA were included. Normalized UMIs were averaged for all the cells that expressed the same gRNA, and columns were Z-score standardized. Rows are hierarchically clustered, and columns are K-means (k = 5) clustered. c The distribution of cells with different gene perturbations across the four cell states. d Uniform manifold approximation and projection (UMAP). Cells are colored by the identified gRNA. Selected gRNAs are shown. e Different clusters that were identified based on RNA expression. Cluster numbers are shown. f The effect of each knockout on the expression of the selected genes. Rows represent the perturbed gene according to the gRNA that was detected, and columns represent the gene expression. Fold-changes relative to cells with non-targeting-gRNAs are shown. g Genetic interactions across targeted genes. h-j Gene perturbations enrichment in clusters. The standardized residual values of a chi-squared test are shown (y axis). (h) Cluster 3, (i) Cluster 9 (j) Cluster 2. k–m UMAPs showing the normalized expression of selected genes in clusters 3, 9 and 2. (k) Cxcl10, (l) Ccl22, (m) Il1f9.
Fig. 5
Fig. 5. Combinations of targeted genes alters the expression of co-stimulatory molecules and gene expression.
a A combined score of antibody-derived tags (ADTs) of CD86, PD-L1, and MHC-I/CD45. Protein score was calculated as the sum of CD86 and MHC-I/CD45 normalized UMIs minus PD-L1 normalized UMIs. For each perturbation, the median score across all cells is shown. The values are relative to the score of cells that express gRNA-NT. b Values of the combined protein score that is shown in (a), ranked in descending order. gRNA-Cebpb gRNA-Med12 targeted cells (green), gRNA-Cebpb or gRNA-Med12, (blue), gRNA-NT (red). c The expression score of a set of genes that regulate antigen presentation and T-cell co-stimulation. d Values of the score that is shown in (c), colored similarly to (b). e The expression of the CD86 protein, based on CD86 ADTs from the single-cell RNA-seq (scRNA-seq) data. Normalized UMI’s are scaled to gRNA. f FACS analysis showing the level of CD86 for CD11c-positive cells that were infected with lentivirus that encodes gRNAs as indicated. g-h ATAC-seq experiment in targeted BMDCs, technical repeats are shown. g Heatmap of genomic loci with significantly (abs(log2FC) > 1, false discovery rate (FDR) < 0.05) increased (red) or decreased (blue) chromatin accessibility. P values were calculated using two-tailed Wald test, and Benjamini-Hochberg was used to calculate the FDRs. h Differential accessibility (log2FC, x axis) and its significance (FDR, y axis) underlying significantly open or closed genomic regions in double knockout targeted cells. The dashed line corresponds to FDR = 0.00001. Each dot represents the peak with the lowest FDR for each gene. In purple genes with less accessible chromatin regions in targeted cells and in green genes with more accessible chromatin regions in targeted cells. Yellow dots mark significant genes with FDR > 0.00001. i Gene expression based on the high-order perturb-seq experiment. For each gene, UMIs were normalized to related expression in gRNA-NT cells.
Fig. 6
Fig. 6. Targeting Med12 and Cebpb in BMDCs enhances T-cell proliferation and cytokines secretion.
a Cartoon showing the experimental setting. Perturbed BMDCs were co-incubated with OT-II CD4 and OT-I CD8 T cells for three days and then stained with hashing antibodies before single-cell RNA sequencing. 8885 cells are shown. b The abundance and average expression of differentially expressed genes across CD8 T cells from different samples. Dots are scaled across genes. c Uniform manifold approximation and projection (UMAP) representation of single-cell transcriptomes after removal of myeloid cells from the analysis. CD4, CD8, and gamma-delta T cells are shown. d The distribution of T cells across different samples. The targeted genes in BMDCs are shown in the legend. e T cells that were incubated with BMDCs that express gRNA-Cebpb gRNA-Med12 are colored in the UMAP. f The distribution of Gzmb expression in OT-I CD8 T cells that were incubated with gRNA-Cebpb or gRNA-Cebpb gRNA-Med12 (LFC = 0.17, FDR = 0.016, Wilcoxon Rank-Sum test). g Measure of CD8 T-cell proliferation after co-incubation with perturbed BMDCs. Three experiments were performed (n = 3), and a representative experiment is shown. h, i Results of ELISA for granzyme B and interferon-gamma following incubation of perturbed BMDCs and OT-I CD8 T cells (two-tailed unpaired t-test. n = 3 biologically independent samples). Data are presented as mean values ± SD. Source data are provided as a Source Data file.

References

    1. Restifo NP, Dudley ME, Rosenberg SA. Adoptive immunotherapy for cancer: harnessing the T cell response. Nat. Rev. Immunol. 2012;12:269–281. - PMC - PubMed
    1. Seitter SJ, et al. Impact of prior treatment on the efficacy of adoptive transfer of tumor-infiltrating lymphocytes in patients with metastatic melanoma. Clin. Cancer Res. 2021;27:5289–5298. - PMC - PubMed
    1. Lu Y, et al. Safety and feasibility of CRISPR-edited T cells in patients with refractory non-small-cell lung cancer. Nat. Med. 2020;26:732–740. - PubMed
    1. parnas O, et al. A genome-wide CRISPR screen in primary immune cells to dissect regulatory networks. Cell. 2015;162:675–686. - PMC - PubMed
    1. Shalem O, et al. Genome-scale CRISPR-Cas9 knockout screening in human cells. Science. 2014;343:84–87. - PMC - PubMed

Publication types

Substances