. 2023 Oct 9;14(1):6314.
doi: 10.1038/s41467-023-41964-6.

Regulation of CTCF loop formation during pancreatic cell differentiation

Affiliations

Regulation of CTCF loop formation during pancreatic cell differentiation

Xiaowen Lyu et al. Nat Commun. .

Abstract

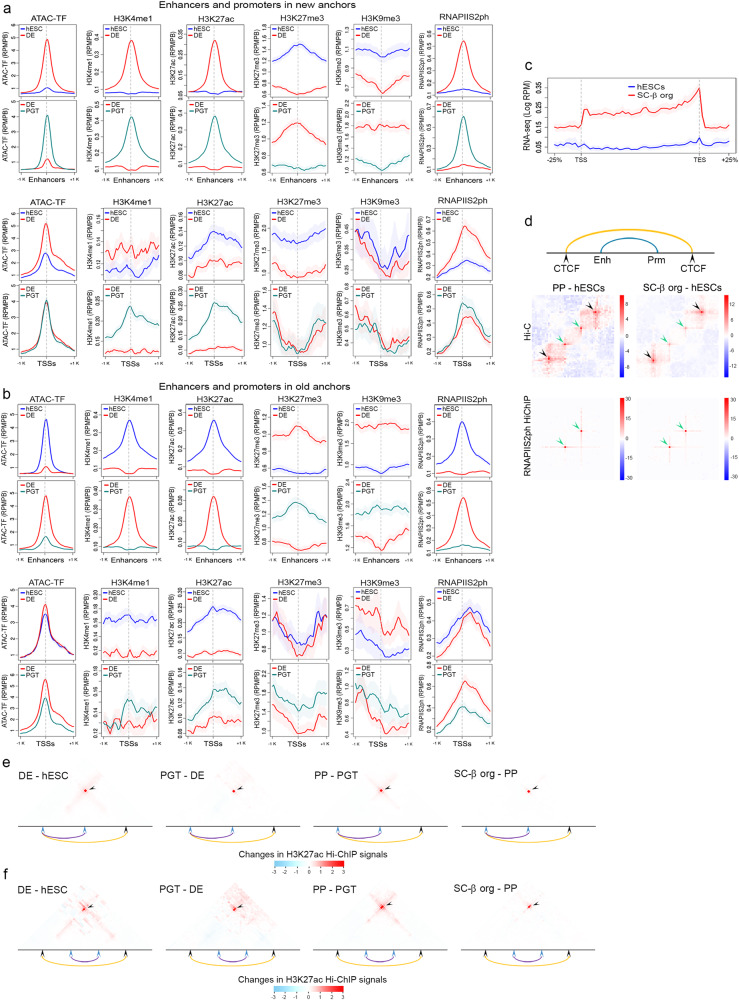
Transcription reprogramming during cell differentiation involves targeting enhancers to genes responsible for establishment of cell fates. To understand the contribution of CTCF-mediated chromatin organization to cell lineage commitment, we analyzed 3D chromatin architecture during the differentiation of human embryonic stem cells into pancreatic islet organoids. We find that CTCF loops are formed and disassembled at different stages of the differentiation process by either recruitment of CTCF to new anchor sites or use of pre-existing sites not previously involved in loop formation. Recruitment of CTCF to new sites in the genome involves demethylation of H3K9me3 to H3K9me2, demethylation of DNA, recruitment of pioneer factors, and positioning of nucleosomes flanking the new CTCF sites. Existing CTCF sites not involved in loop formation become functional loop anchors via the establishment of new cohesin loading sites containing NIPBL and YY1 at sites between the new anchors. In both cases, formation of new CTCF loops leads to strengthening of enhancer promoter interactions and increased transcription of genes adjacent to loop anchors. These results suggest an important role for CTCF and cohesin in controlling gene expression during cell differentiation.


Conflict of interest statement

The authors declare no competing interests.

Figures

Fig. 1
Fig. 1. Analysis of stage-specific CTCF loops during the differentiation of hESCs into pancreatic cells.
a Aggregate peak analysis (APA) of Hi-C data obtained in cells at different stages during the differentiation of H9 hESCs into SC-β organoids. Each circle represents the aggregate of the signal present in all corner dots corresponding to CTCF loops detected by SIP at each stage (see Methods). Each row shows CTCF loop APA values in cells at different stages for CTCF loops specific for each stage. For example, the top row shows APA values of DE-specific CTCF loops as well as the APA values of these CTCF loops at other stages of differentiation. The results suggest that cells at each differentiation stage form new CTCF loops that are not present in previous or subsequent stages. b Specific example of a region of chromosome 10 showing CTCF loops absent in hESCs, DE, and PGT; formed in PP and maintained in SC-β organoids (black arrowheads); or formed in PP but lost in SC-β organoids (blue arrowhead). c Heatmaps showing formation of stage specific CTCF loops. Loops have been divided into two groups, those containing low levels of H3K9me3 at the previous stage (top) and those containing high levels of H3K9me3 at the previous stage (bottom). These results show that 253 stage-specific CTCF loops contain H3K9me3 whereas 5033 lack this histone modification. The formation of CTCF loops at each specific stage correlates with increased levels of CTCF, although a subset of loops already contains CTCF before loop formation. Establishment of new loops correlates with increased RAD21 and ATAC-seq signal and decrease of CHD4, H3K9me3, and H3K27me3. d Analysis of the distribution of CTCF and RAD21 at CTCF loops. The diagram describes the fraction of loops containing CTCF or RAD21 at one, both or no loop anchors. e Heatmaps showing disassembly of stage specific CTCF loops. Loops are divided into two groups, those containing low (top) or high (bottom) levels of H3K9me3 at the stage when they are disassembled. Dismantling of CTCF loops at each specific stage correlates with decreased levels of CTCF, RAD21, and ATAC-seq signal, and increase of H3K9me3, H3K27me3, and CHD4. Abbreviations: human embryonic stem cells (hESCs), definitive endoderm (DE), primitive gut tube-like (PGT), pancreatic progenitors (PP), and stem cell-derived β-cell organoids (SC-β organoids).
Fig. 2
Fig. 2. Correlations between changes in CTCF loops and compartmental interactions.
a Compartmental interactions in a 20 Mb region of chromosome 1 in H9 hESCs. The top of the figure shows a Hi-C heatmap, the correlation between compartmental interaction signals and A/B compartment calls, and the presence of RNAPIISer2ph, H3K9me3, H3K9me2, and H3K27me3. Regions containing high levels of H3K9me3 (dotted black ellipse) or high levels of RNAPIISer2ph interact frequently whereas those containing H3K9me2 show low interaction frequencies. The bottom part of the figure shows a subset of interactions in the same region of the genome. Very frequent interactions mediated by H3K9me3 (dotted black ellipse) and rare interactions between regions containing H3K9me2 both map to the B compartment. The results are confirmed by H3K9me3 and RNAPIISer2ph HiChIP. b Compartmental interactions observed in Hi-C heatmaps (green circles) between regions containing H3K9me3 in H9 hESCs (blue arrowhead) are lost in DE cells when H3K9me3 is replaced for H3K9me2 in these cells. HiChIP experiments with H3K9me3 antibodies shown in the right panel confirm these results. c Example of changes in CTCF loops observed by Hi-C between H9 hESCs and PP cells in a region of chromosome 2. Three loops (black squares) present in PP cells are not observed in H9 hESCs. The two loops on the left form between two new PP CTCF sites and one CTCF site that is also present in H9 cells. The loop on the right forms between two new CTCF sites present in PP but absent in H9 cells. Formation of the loops correlates with the presence of RAD21 and changes in transcription of surrounding genes. Loop formation also correlates with decreased H3K9me3 and increased H3K9me2 at loop anchors. No changes in DNA methylation are observed at this resolution. Abbreviations: human embryonic stem cells (hESCs), definitive endoderm (DE), primitive gut tube-like (PGT), pancreatic progenitors (PP), and stem cell-derived β-cell organoids (SC-β organoids).
Fig. 3
Fig. 3. Changes in CTCF loops at different stages during the differentiation of H9 hESCs into pancreatic cells.
a Example showing changes in the distribution of CTCF in a region of chromosome 10 at different stages of differentiation. b Different processes by which CTCF loops change during differentiation by moving the location of one or both loop anchors. c Comparison of the number and size of stable versus new loops formed during pancreatic cell differentiation. d Example of CTCF loops present in SC-β organoids but not in H9 hESCs. New loops (black arrowheads) form by extension of one of the anchors of an existing loop (blue arrowhead). The new loop anchors in SC-β organoids also contain CTCF in H9 cells but fail to form loops. e A second example of CTCF loops present in SC-β organoids but not in H9 hESCs. New loops (black arrowheads) form by extension of one of the anchors of an existing loop (blue arrowheads). One of the new loops forms by recruitment of CTCF to a new genomic site whereas two other loop anchors already contain CTCF in H9 cells but fail to form loops. These anchors contain increased ATAC-seq signal when they form loops. Abbreviations: human embryonic stem cells (hESCs), definitive endoderm (DE), primitive gut tube-like (PGT), pancreatic progenitors (PP), and stem cell-derived β-cell organoids (SC-β organoids).
Fig. 4
Fig. 4. Changes in chromatin accessibility at new CTCF loop anchors during cell differentiation.
a Stage-specific loops in which the loops form by de novo recruitment of CTCF to one or both anchors. Each row represents one differentiation stage. The first column shows the levels of CTCF from ChIP-seq experiments at anchors of loops specific for each stage. Levels of CTCF are highest at the stage when the loop is detected by Hi-C. The ATAC-TF signal, corresponding to subnucleosomal reads in the 50–115 bp, represents bound TFs and varies following a similar pattern to CTCF. CTCF sites are flanked by positioned nucleosomes (ATAC-Nuc signal corresponding to ATAC-seq reads 180–247 bp long) at most stages and the level of DNA methylation decreases at each stage in a small region surrounding the CTCF site concomitant with the presence of this protein. Levels of FOXA2 increase at stage specific loop anchors for all stages except SC-β organoids; loop anchors for this stage contain FOXA2 starting at DE b Frequency of binding motifs for various transcription factors found at the summits of ATAC-TF peaks present within 10 kb regions containing anchors of CTCF loops showing increased interactions at different stages of pancreatic cell differentiation. c Distribution of FOXA2 motifs with respect to CTCF motifs present at stage specific loop anchors. Abbreviations: human embryonic stem cells (hESCs), definitive endoderm (DE), primitive gut tube-like (PGT), pancreatic progenitors (PP), and stem cell-derived β-cell organoids (SC-β organoids).
Fig. 5
Fig. 5. Chromatin changes at enhancers and TSSs adjacent to new and old CTCF loop anchors.
a Formation of CTCF loops by recruiting CTCF to new anchor sites correlates with an increase in ATAC-TF signal at adjacent enhancers and transcription start sites (TSSs). These enhancers also show increased H3K4me1, H3K27ac, and RNAPIIS2ph. Promoters show similar changes over broader regions. b Dissolution of CTCF loops by discarding previously used anchor sites. When this happens at a specific stage, enhancers and TSSs adjacent to discarded CTCF anchor sites lose ATAC-TF signal, H3K4me1, H3K27ac, and RNAPIIS2ph, suggesting that loss of CTCF anchors correlates with inactivation of adjacent enhancers and promoters. c Changes in transcription measured by RNA-seq at genes located inside stage-specific CTCF loops. d Metaplot analysis of interactions between CTCF loop anchors and between enhancers and promoters located within the loop anchors. The top diagram indicates the specific arrangement of CTCF loop anchors and enhancer-promoter interactions analyzed in this specific case. Changes in interactions between enhancer-promoter pairs in two differentiation stages are analyzed in the context of changes in CTCF loops in which the enhancer-promoter pairs are contained. Below the diagram, the top left panel shows a subtraction heatmap of Hi-C interactions in PP and H9 hESCs for PP-specific CTCF loops. Formation of these loops in PP cells (black arrowheads indicating increased interactions at the CTCF loop anchors) correlates with increased enhancer-promoter interactions inside the loops (green arrowheads). The right panel shows a similar analysis comparing CTCF loops present in SC-β organoids but absent in H9 hESCs. The bottom panels show a parallel analysis using RNAPIIS2ph HiChIP instead of Hi-C. Interactions at CTCF loop anchors cannot be detected (absence of black arrowheads) because CTCF anchors lack RNAPIIS2ph; however, enhancer-promoter interactions can be observed as increased signal in RNAPIIS2ph HiChIP data (green arrowheads) e Subtraction heatmaps of H3K27ac HiChIP between consecutive differentiation stages around new CTCF loop anchors formed by extension of one old anchor. f Subtraction heatmaps of H3K27ac HiChIP between consecutive differentiation stages around new CTCF loop anchors formed by extension of two old anchors. Abbreviations: human embryonic stem cells (hESCs), definitive endoderm (DE), primitive gut tube-like (PGT), pancreatic progenitors (PP), and stem cell-derived β-cell organoids (SC-β organoids).
Fig. 6
Fig. 6. Distribution of various proteins at CTCF loop anchors and cohesin loading sites.
a Distribution of NIPBL, RAD21, CTCF and WAPL at loop anchors and loading sites of CTCF loops identified from Hi-C data present in DE cells but not H9 hESCs. b Distribution of H3K4me1, H3K27ac, RNAPIIS2ph, and YY1 at loop anchors and loading sites of CTCF loops identified from Hi-C data present in DE cells but not H9 hESCs. c Example of a specific genomic region representative of the metaplots shown in (a, b). The top section shows the distribution of several proteins and histone modifications in this region of the genome in H9 hESCs. Green and red arrowheads indicate orientation of the CTCF motif at the site. Blue arrowheads show possible sites of cohesin loading to make the CTCF loops observed in Hi-C data. The middle section shows Hi-C heatmaps in H9 hESCs and SC-β organoids. Blue arrowheads show CTCF loops present in both cell types whereas black arrowheads show those found only in SC-β organoids. The bottom section shows the distribution of several proteins and histone modifications in the same genomic region in SC-β organoids. Pink and dark red arrowheads show the location of NIPBL/YY1 sites present in SC-β organoids but not in H9 hESCs. Abbreviations: human embryonic stem cells (hESCs), definitive endoderm (DE), primitive gut tube-like (PGT), pancreatic progenitors (PP), and stem cell-derived β-cell organoids (SC-β organoids).

References

    1. Carter B, Zhao K. The epigenetic basis of cellular heterogeneity. Nat. Rev. Genet. 2021;22:235–250. doi: 10.1038/s41576-020-00300-0. - DOI - PMC - PubMed
    1. Nuebler J, Fudenberg G, Imakaev M, Abdennur N, Mirny LA. Chromatin organization by an interplay of loop extrusion and compartmental segregation. Proc. Natl Acad. Sci. USA. 2018;115:E6697–E6706. doi: 10.1073/pnas.1717730115. - DOI - PMC - PubMed
    1. Rao SSP, et al. Cohesin loss eliminates all loop domains. Cell. 2017;171:305–320.e324. doi: 10.1016/j.cell.2017.09.026. - DOI - PMC - PubMed
    1. Rowley MJ, et al. Evolutionarily conserved principles predict 3D chromatin organization. Mol. Cell. 2017;67:837–852.e837. doi: 10.1016/j.molcel.2017.07.022. - DOI - PMC - PubMed
    1. Schoenfelder S, Fraser P. Long-range enhancer-promoter contacts in gene expression control. Nat. Rev. Genet. 2019;20:437–455. doi: 10.1038/s41576-019-0128-0. - DOI - PubMed

Publication types