. 2023 Oct 9;14(1):6304.
doi: 10.1038/s41467-023-42058-z.

Fibroblast growth factor 18 stimulates the proliferation of hepatic stellate cells, thereby inducing liver fibrosis

Affiliations

Fibroblast growth factor 18 stimulates the proliferation of hepatic stellate cells, thereby inducing liver fibrosis

Yuichi Tsuchiya et al. Nat Commun. .

Abstract

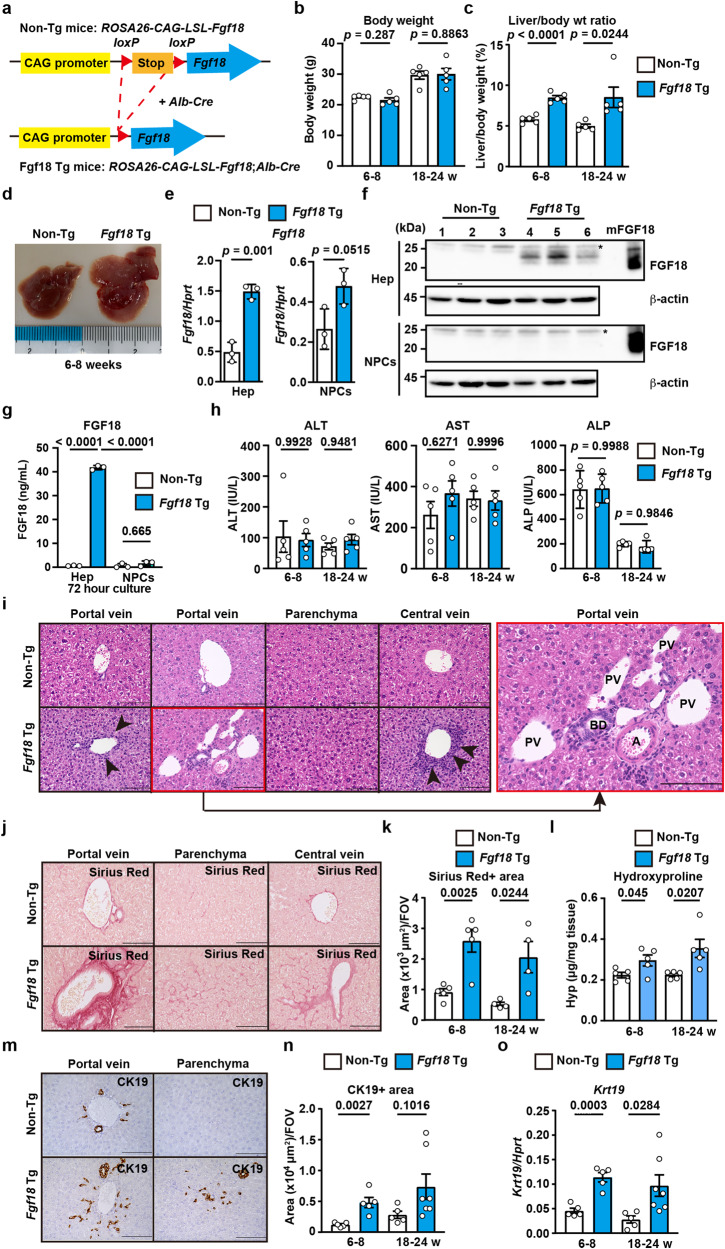
Liver fibrosis results from chronic liver injury triggered by factors such as viral infection, excess alcohol intake, and lipid accumulation. However, the mechanisms underlying liver fibrosis are not fully understood. Here, we demonstrate that the expression of fibroblast growth factor 18 (Fgf18) is elevated in mouse livers following the induction of chronic liver fibrosis models. Deletion of Fgf18 in hepatocytes attenuates liver fibrosis; conversely, overexpression of Fgf18 promotes liver fibrosis. Single-cell RNA sequencing reveals that overexpression of Fgf18 in hepatocytes results in an increase in the number of Lrat+ hepatic stellate cells (HSCs), thereby inducing fibrosis. Mechanistically, FGF18 stimulates the proliferation of HSCs by inducing the expression of Ccnd1. Moreover, the expression of FGF18 is correlated with the expression of profibrotic genes, such as COL1A1 and ACTA2, in human liver biopsy samples. Thus, FGF18 promotes liver fibrosis and could serve as a therapeutic target to treat liver fibrosis.


Conflict of interest statement

Y.T. and Hiroyasu N. are inventors on the patent application that includes the ELISA to detect human and murine FGF18 and the generation of transgenic mice that spontaneously developed liver fibrosis used in this study. The other authors declare no conflicts of interest.

Figures

Fig. 1
Fig. 1. CDE diet-induced liver injury is exacerbated in CflarLKO mice.
Eight-week-old female CflarFF and CflarLKO mice were fed the normal or CDE diet for 4 weeks. a Serum ALT concentrations were determined. Results are mean ± SE. n = 5 (normal diet) or n = 6 (CDE diet) mice. b Kinetics of relative body weight (%) changes. Results are mean ± SE. n = 5 (CflarFF and CflarLKO fed the normal diet), n = 8 (CflarFF fed the CDE diet), or n = 6 (CflarLKO fed the CDE diet) mice. cg, j Liver sections from mice with the indicated genotypes fed the normal diet or CDE diet for 4 weeks were stained with H&E, anti-CC3 antibody, TUNEL, Sirius Red, anti-desmin and anti-CK19 antibodies, and Nile Red (n = 5 mice) (c). Scale bar, 100 μm. Red arrowheads indicate CC3+ or TUNEL+ cells. The number of CC3+ (d) and TUNEL+ (e) cells were counted and expressed as numbers of the field of view (FOV). The Sirius Red+ (f), desmin+ (g), and CK19+ (j) areas were quantified and are expressed as areas of FOV. Results are mean ± SE (n = 5 mice). The hydroxyproline content of the livers were determined (h). Results are mean ± SE. n = 5 (CflarFF and CflarLKO fed the normal diet), n = 4 (CflarFF fed the CDE diet), or n = 6 (CflarLKO fed the CDE diet) mice. The expression of profibrotic genes (i) and Krt19 (CK19) (k) in the livers was determined by qPCR. Results are mean ± SE (n = 5). Pooled results from four independent experiments are shown. Significance was determined by two-way ANOVA with Tukey’s multiple comparison test (a, dk), two-tailed unpaired Student’s t test (b, left), or two-way ANOVA with Sidak’s multiple comparison test (b, right). Source data are provided as a Source Data file.
Fig. 2
Fig. 2. Fibroblast growth factor 18 is elevated in the livers of CflarLKO mice.
a, b Eight-week-old female CflarFF and CflarLKO mice were fed the CDE diet for 4 weeks, and gene expression in the whole liver was analyzed by RNA-seq. Gene Ontology (GO) enrichment analysis was performed using DAVID 6.8 (a). Statistical analysis was determined by one-sided Fisher’s exact test. Heatmap showing the Z score scaled expression levels of representative genes in the indicated categories (n = 3 mice) (b). c Kinetics of the expression of the indicated genes in the livers of 8-week-old female mice before (–) and after CDE diet feeding for 4 weeks. Results are means ± SE (n = 5 mice). Pooled results from four independent experiments are shown. d, e Expression of Fgf18 in the liver by HTVi results in the proliferation of hepatocytes. Eight-week-old female wild-type (WT) mice were injected with the indicated expression vectors by the HTVi method. Liver sections were stained with anti-CK19, anti-desmin, or anti-Ki67 antibodies (d) (n = 4 mice). Scale bar, 100 μm. The CK19+, desmin+, or Ki67+ areas were calculated and are expressed as positive areas per FOV (e). Results are means ± SE (n = 4 mice) and represent two independent experiments. f, g Mice were treated as in (a), and the expression of Fgf18, Hnf4a, and Lrat was determined by RNAscope (n = 3 mice) (f). Red puncta indicate Hnf4a (upper panels) and Lrat (lower panels). White arrowheads indicate Fgf18 mRNA+ puncta (green). Nuclei were stained with DAPI (blue). White dotted lines outline the margins of hepatocytes. Scale bar, 100 μm. The total Fgf18 mRNA+ areas and numbers of Fgf18 mRNA+ puncta in Hnf4a+ hepatocytes and Lrat+ HSCs were calculated (g). Results are mean ± SE (n = 3 mice). Statistical significance was determined by the two-way ANOVA with Tukey’s multiple comparison test (c), one-way ANOVA with Dunnett’s multiple comparison test (e), or two-tailed unpaired Student’s t test (g). Source data are provided as a Source Data file.
Fig. 3
Fig. 3. Hepatocyte-specific deletion of Fgf18 attenuates fibrosis in the livers of CflarLKO mice fed the CDE diet.
ac Hepatocytes and NPCs were isolated from 6- to 8-week-old female CflarFF;Fgf18FF, CflarLKO;Fgf18LKO, CflarFF, and CflarLKO mice, and the expression of Fgf18 and Cflar was determined by qPCR (a, b). Results are mean ± SE (n = 3 mice). The expression of cFLIP was determined by Western blotting with anti-cFLIP antibody (n = 3 mice) (c). Numbers indicate an individual mouse. Results are representative of two independent experiments. dl, Eight-week-old female Fgf18FF, Fgf18LKO, CflarFF, CflarLKO, CflarFF;Fgf18FF, and CflarLKO;Fgf18LKO mice were fed the CDE diet for 4 weeks, and the serum ALT, AST, and ALP concentrations were determined (d). Results are mean ± SE (n = 5 mice). The expression of Fgf18 in the livers was determined by qPCR (e). Results are mean ± SE. n = 5 (Fgf18FF, Fgf18LKO, CflarFF, CflarLKO, and CflarFF;Fgf18FF) or n = 6 (CflarLKO;Fgf18LKO) mice. Liver sections were stained with H&E, Sirius Red, anti-desmin, or anti-CK19 antibodies (n = 5 mice) (f). Scale bars, 100 μm. The Sirius Red+ (g) and desmin+ (h) areas were quantified and expressed as in Fig. 1f. Results are mean ± SE (n = 5 mice). The hydroxyproline content of the liver was determined (i). Results are mean ± SE (n = 5 mice). Expression of the indicated genes in the liver was determined by qPCR (j, l). Results are mean ± SE (n = 5 mice). The CK19+ areas (k) were quantified and expressed as in Fig. 1f. Results are mean ± SE. n = 6 (CflarFF and CflarLKO,) or n = 5 (Fgf18FF, Fgf18LKO, CflarFF;Fgf18FF, and CflarLKO;Fgf18LKO) mice. Pooled results from six independent experiments are shown (d, e, gl). Statistical significance was determined by the two-tailed unpaired Student’s t test (a, b) or one-way ANOVA with Tukey’s multiple comparisons (d, e, gl). Source data are provided as a Source Data file.
Fig. 4
Fig. 4. Overexpression of Fgf18 in hepatocytes promotes liver fibrosis.
a Strategy for liver-specific expression of Fgf18. Deletion of the stop codon by albumin-Cre recombinase results in the expression of Fgf18 in hepatocytes. bn Non-Tg and Fgf18 Tg mice were analyzed at the indicated times after birth. Body weight (b) and calculated liver/body weight ratios (%) of mice (c) are shown. Results are mean ± SE (n = 5 mice). Representative photos of the macroscopic appearance of the livers of 6- to 8-week-old mice (n = 10 mice) are shown (d). Hepatocytes and NPCs were isolated from 4-week-old non-Tg and Fgf18 Tg mice, and the expression of Fgf18 at both the mRNA (e) and protein levels (f) was analyzed by qPCR and Western blotting, respectively. Results are mean ± SE (n = 3 mice) (e). Each number indicates an individual mouse. mFGF18 indicates recombinant murine FGF18. Hepatocytes and NPCs were isolated as in (e) and cultured for 72 h (g). The concentrations of FGF18 were determined by the in-house ELISA. Results are mean ± SD of triplicate samples. Results are representative of two or three independent experiments (eg). The ALT, AST, and ALP concentrations in the sera of mice (h). Results are mean ± SE (n = 5 mice). Liver sections were stained with H&E (n = 5 mice) (i). The right panel is an enlarged image of the left red box. A, artery; BD, bile duct; PV, portal vein. Liver sections were stained with Sirius Red (j), and the Sirius Red+ areas were quantified and expressed as in Fig. 1f (k). Results are mean ± SE. n = 5 (6–8 weeks) or n = 4 (18–24 weeks) mice. The hydroxyproline content was determined (l). Results are mean ± SE (n = 5 mice). Liver sections were stained with anti-CK19 (m) antibody, and the CK19+ areas were quantified and expressed as in Fig. 1f (n). The expression of Krt19 was determined by qPCR (o). Results are mean ± SE. n = 5 (non-Tg and Fgf18 Tg at 6–8 weeks and non-Tg at 18–24 weeks) or n = 7 (Fgf18 Tg at 18–24 weeks) mice for m, n, o. Pooled results from two to three independent experiments (b, c, h, k, l, n, o). Statistical significance was determined by the two-tailed unpaired Student’s t test (b, c, e, h, k, l, n, o) or two-way ANOVA with Tukey’s multiple comparison (g). Source data are provided as a Source Data file.
Fig. 5
Fig. 5. FGF18 increases the number of CD31CD34+ stromal cells.
a GO enrichment analysis of the RNA-seq results of the whole livers of 8-week-old non-Tg and Fgf18 Tg mice (n = 3 mice). b Heatmap showing Z score scaled expression levels of representative genes in the indicated categories. c, d Genes upregulated more than 2-fold in the livers of CflarLKO mice vs. CflarFF mice fed the CDE diet for 4 weeks and Fgf18 Tg mice vs. non-Tg mice were extracted and analyzed by the COUNTIF function. A Venn diagram of the upregulated genes in the livers of mice and representative overlapping genes (c). GO enrichment analysis of overlapping genes upregulated in both groups is shown (d). eh Characterization of CD31-CD34+ cells. Liver nonparenchymal cells were prepared and analyzed by flow cytometry gated on CD45- cells as in Supplementary Fig. 7g (e, left panel) and the percentage of each cell population among CD45- cells was calculated (f). Results are mean ± SE (n = 4 mice). The expression (e, right panel) and the percentages (g) of each cell population among CD31CD34+ cells were calculated and are shown. Results are mean ± SE (n = 3 mice). Gene expression in CD31CD34+ cells vs. CD31+ cells (h). CD31+ and CD31CD34+ cells were sorted as in Supplementary Fig. 8a. Expression of the indicated genes in the sorted cells was analyzed by qPCR. Results are mean ± SE (n = 3 mice). il Lrat+ and desmin+ cells are increased in the livers of Fgf18 Tg mice. Liver tissue sections from 8-week-old non-Tg and Fgf18 Tg mice were analyzed by RNAscope (i, j) or IHC (k, l). Scale bar, 100 μm. The Lrat+ or desmin+ areas were calculated and are expressed as Lrat+ or desmin+ areas per FOV. Results are mean ± SE (j, n = 3 mice; l, n = 5 mice). Statistical significance was determined by one-sided Fisher’s exact test (a, d), or the two-tailed unpaired Student’s t test. Representative results of four (e, left panel), three (e, right panel), and two (h) independent experiments. Source data are provided as a Source Data file.
Fig. 6
Fig. 6. Characterization of CD31-CD34+ stromal cells and cell‒cell communication analyzed by scRNA-seq.
a UMAP plot showing the 22 clusters of nonparenchymal liver cells from 6-week-old non-Tg and Fgf18 Tg mice (n = 3 mice per genotype). Each number indicates each cell cluster. b Relative percentages of each cluster from non-Tg and Fgf18 Tg mice are shown. Clusters containing HSC, portal fibroblast, and myofibroblast are indicated by the white boxes. c Violin plot showing the expression levels of the indicated genes in HSCs, portal fibroblasts, and myofibroblasts pooled from non-Tg and Fgf18 Tg mice. d Circle plot showing the expression levels and percentages of cells expressing the indicated genes from non-Tg and Fgf18 Tg mice. Color intensities and circle sizes indicate expression levels and percentages of cells expressing the indicated genes, respectively. e Communication networks between HSCs/fibroblasts and other cells as analyzed by CellChat. Notably, FGF18 signals appeared to originate from various types of cells; this may be caused by read-through transcripts of Fgf18 expressed in multiple tissues. All significant ligand‒receptor pairs that contribute to sending signals from HSC and fibroblast to other cells are shown. The edge width represents the communication probability. scRNA-seq data for endothelial cell and cholangiocyte were not included in the present data. M-FIB myofibroblasts, P-FIB portal fibroblast, HSC hepatic stellate cell, Hep hepatocyte, DC dendritic cell, Mo monocyte, Neu neutrophil.
Fig. 7
Fig. 7. FGF18 stimulates the proliferation of HSCs but inhibits TGFβ-induced upregulation of profibrotic genes.
HSCs (af, h, i, k) and hepatocytes (e, g, j, k) were isolated from wild-type mice as described in the Methods. a TGFβ1, but not FGF18, upregulates the expression of profibrotic genes. HSCs were untreated or stimulated with TGFβ1 (1 ng/mL) or FGF18 (100 ng/mL) for 24 h. The expression of the indicated genes was analyzed by qPCR. Results are mean ± SD of triplicate samples. b FGF18 stimulates the proliferation of HSCs. HSCs were left untreated or stimulated as in (a) for the indicated times. Cell proliferation was analyzed by the WST assays. c, FGF18 upregulates the expression of Ccnd1. HSCs were stimulated and analyzed as in (a). d MEK and Akt inhibitors completely and moderately abolish the FGF18-induced upregulation of Ccnd1, respectively. HSCs were stimulated as in (a) in the absence or presence of U0126 (10 μM) or LY294002 (10 μM) for 24 h and were analyzed as in (a). e Expression of Fgfr1-4 in HSCs and hepatocytes. The expression of Fgfr1-4 was determined by qPCR. Results are mean ± SEM (n = 3 mice). f, g TGFβ1 induces upregulation of Fgf18 in HSCs (f) and hepatocytes (g). HSCs and hepatocytes were stimulated and analyzed as in (a). h FGF18 suppresses the TGFβ1-induced upregulation of profibrotic genes. HSCs were untreated or stimulated with TGFβ1 (1 ng/mL), FGF18 (100 ng/mL), or both and were analyzed as in (a). i FGF18 suppresses the expression of Tgfb1-3. HSCs were stimulated and analyzed as in (a). j Hepatocytes were stimulated and analyzed as in (a). k Hepatocytes and HSCs were untreated or stimulated individually with FGF18 (100 ng/mL) as in (a). Statistical significance was determined by the one-way ANOVA with Dunnett’s multiple comparison test (a, b, c, f, j) or one-way ANOVA with Tukey’s multiple comparison test (d, h), two-tailed unpaired Student’s t test (e, g, i), or two-way ANOVA with Tukey’s multiple comparison test (k). All results are representative of two to three independent experiments. Source data are provided as a Source Data file.
Fig. 8
Fig. 8. Expression of FGF18 is correlated with the expression of COL1A1 and ACTA2 in human liver biopsy samples.
a RNA was extracted from liver biopsy samples, and the expression of the indicated genes was analyzed by qPCR (n = 23). The correlation between FGF18 and COL1A1 or ACTA2 was determined by Pearson correlation coefficient analysis. P values were calculated two-sided test. Source data are provided as a Source Data file. b A model for FGF18-induced liver fibrosis. In response to various injuries, TGFβ is released from different types of cells, such as macrophages engulfing apoptotic hepatocytes. Then, TGFβ induces the production of FGF18 in HSCs and hepatocytes. FGF18 then stimulates the proliferation of HSCs. Proliferating HSCs further respond to stimuli derived from scar-associated macrophages and produce collagens and extracellular matrix, culminating in the development of  liver fibrosis. aHSCs, activated HSCs; PDGF, platelet-derived growth factor; qHSCs, quiescent HSCs; SAMacs, scar-associated macrophages.

References

    1. Kisseleva T, Brenner D. Molecular and cellular mechanisms of liver fibrosis and its regression. Nat. Rev. Gastroenterol. Hepatol. 2021;18:151–166. - PubMed
    1. Schwabe RF, Tabas I, Pajvani UB. Mechanisms of fibrosis development in nonalcoholic steatohepatitis. Gastroenterology. 2020;158:1913–1928. - PMC - PubMed
    1. Angulo P, et al. Liver fibrosis, but no other histologic features, is associated with long-term outcomes of patients with nonalcoholic fatty liver disease. Gastroenterology. 2015;149:389–397.e310. - PMC - PubMed
    1. Vilar-Gomez E, et al. Fibrosis severity as a determinant of cause-specific mortality in patients with advanced nonalcoholic fatty liver disease: a multi-national cohort study. Gastroenterology. 2018;155:443–457.e417. - PubMed
    1. Rinella ME, et al. A multi-society Delphi consensus statement on new fatty liver disease nomenclature. J. Hepatol. 2023;S0168–8278:00418–X. - PubMed

Publication types

Substances