. 2023 Oct 9;13(1):16994.
doi: 10.1038/s41598-023-43435-w.

Fully automated sequential immunofluorescence (seqIF) for hyperplex spatial proteomics

Affiliations

Fully automated sequential immunofluorescence (seqIF) for hyperplex spatial proteomics

François Rivest et al. Sci Rep. .

Abstract

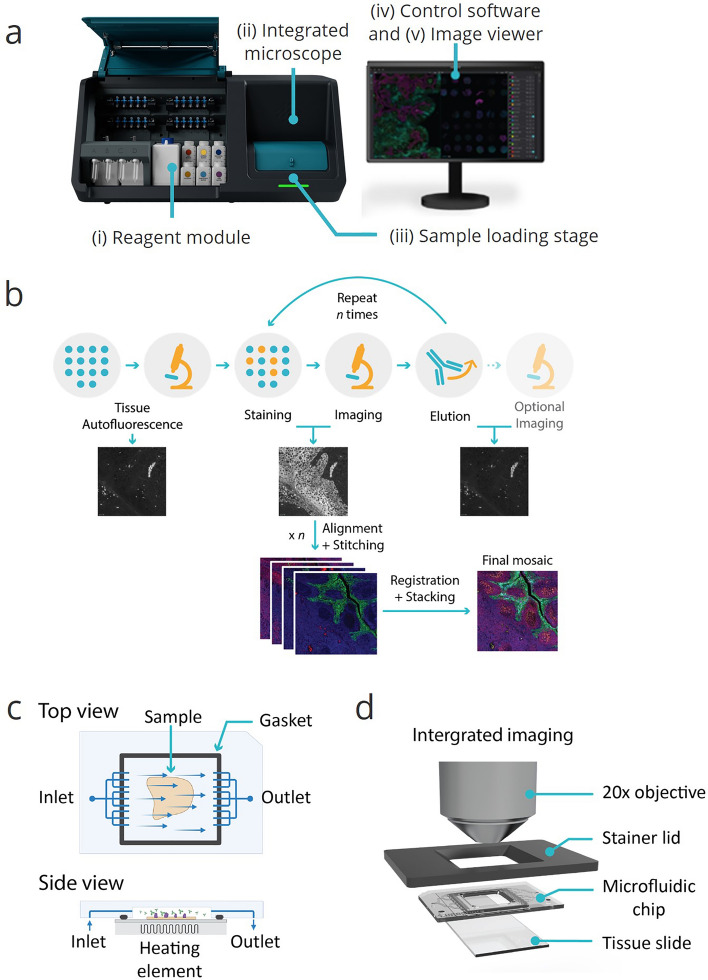
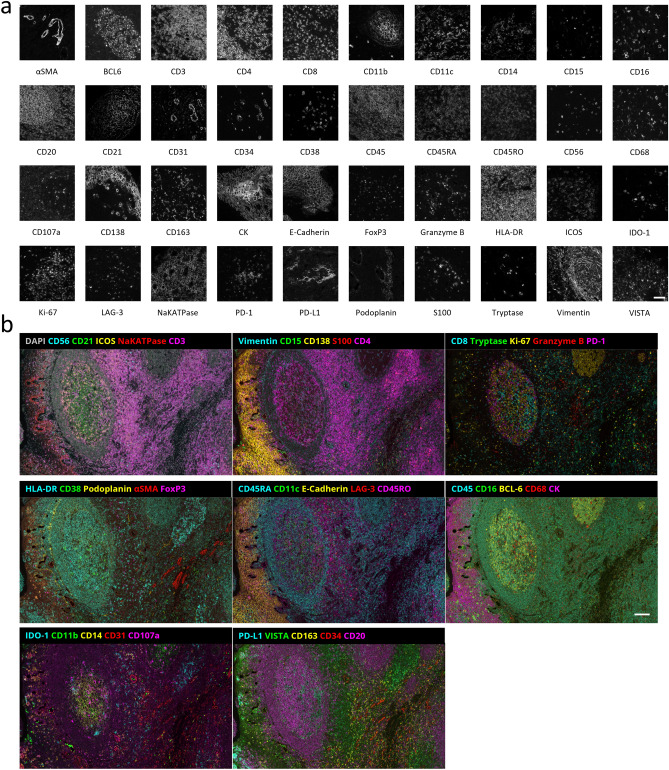
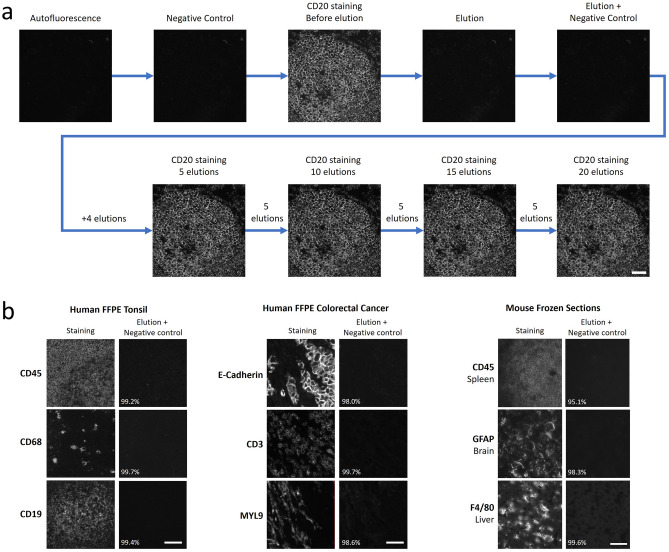
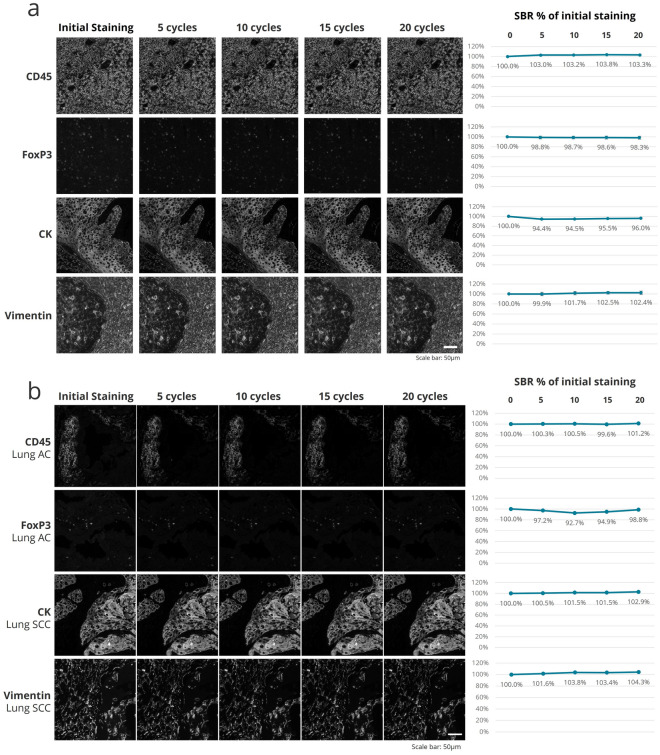
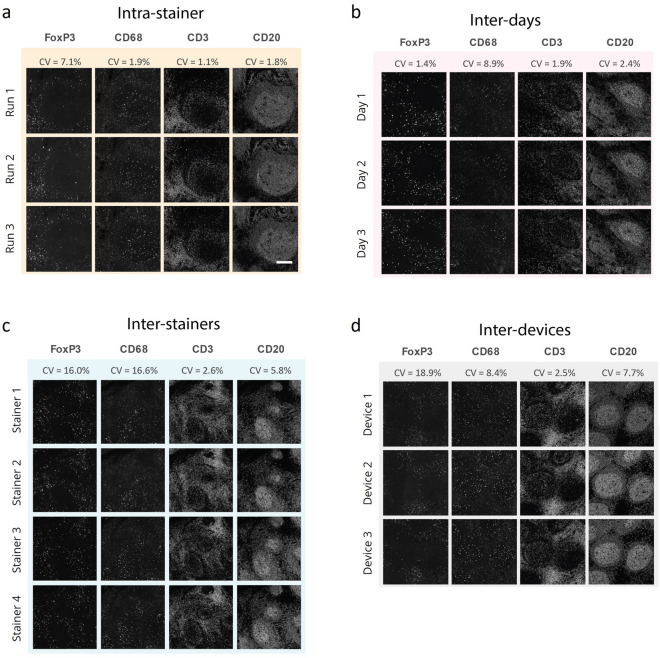
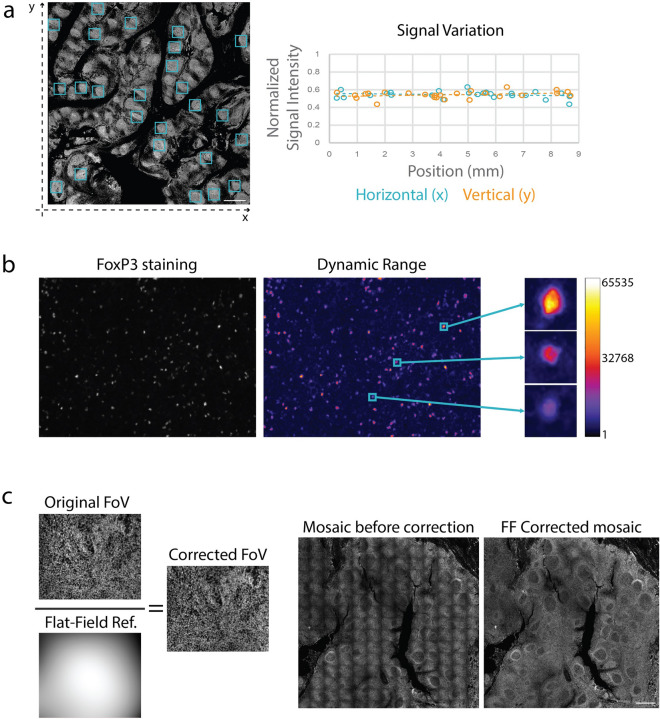
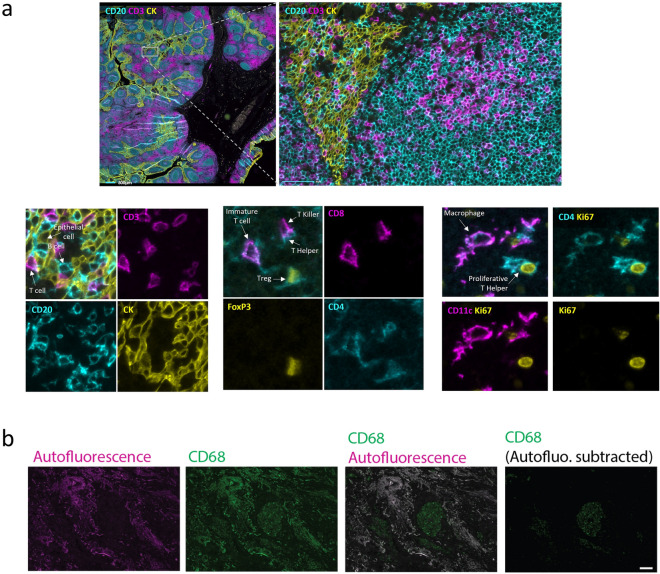
Tissues are complex environments where different cell types are in constant interaction with each other and with non-cellular components. Preserving the spatial context during proteomics analyses of tissue samples has become an important objective for different applications, one of the most important being the investigation of the tumor microenvironment. Here, we describe a multiplexed protein biomarker detection method on the COMET instrument, coined sequential ImmunoFluorescence (seqIF). The fully automated method uses successive applications of antibody incubation and elution, and in-situ imaging enabled by an integrated microscope and a microfluidic chip that provides optimized optical access to the sample. We show seqIF data on different sample types such as tumor and healthy tissue, including 40-plex on a single tissue section that is obtained in less than 24 h, using off-the-shelf antibodies. We also present extensive characterization of the developed method, including elution efficiency, epitope stability, repeatability and reproducibility, signal uniformity, and dynamic range, in addition to marker and panel optimization strategies. The streamlined workflow using off-the-shelf antibodies, data quality enabling downstream analysis, and ease of reaching hyperplex levels make seqIF suitable for immune-oncology research and other disciplines requiring spatial analysis, paving the way for its adoption in clinical settings.


Conflict of interest statement

All authors of this manuscript are current or former employees of Lunaphore, which is working on commercializing an automated platform to implement seqIF on standard tissue samples.

Figures

Figure 1
Figure 1
Overviews of COMET™ platform and seqIF method, enabling full automation and walk-away execution of multiplex immunofluorescence assays. (a) COMET™ platform overview. (i) A reagent module composed of 20 small volume reservoirs for reagents, typically used for primary antibodies, 4 mid-size reservoirs, typically used for detection reagents, and 7 large volume reservoirs for ancillary buffers; (ii) an integrated epifluorescence microscope acquiring automated mosaic scans of stained samples, (iii) a sample loading/unloading interface with a rotary stage that accommodates 4 automated stainers, (iv) a control software for protocol preparation and execution; and (v) an imaging viewer for rapid visualization of multiplexed immunofluorescence results. (b) Sequential immunofluorescence method (seqIF). Tissue autofluorescence is automatically acquired as a baseline for downstream background removal. Samples are automatically stained and imaged for DAPI and 2 markers of interest. Elution—signal removal by chemical removal of antibodies. Staining, imaging, and elution are repeated n times (n: number of multiplexed staining steps). Images are automatically stitched, aligned, and stacked on a final OME-TIFF file. (c) Top and side views of the microfluidic imaging chip consisting of inlet, outlet and a fluidic network that enable uniform exposure of reagents over the tissue sample. A gasket at the edges of the staining area ensures a hermetic sealing. A heating element underneath is used to control the temperature of each step in the seqIF protocol. (d) Integrated imaging assembly. The microfluidic chip contains an imaging window that allows the integration of in-situ fluorescence microscopy and permits the direct imaging of the sample.
Figure 2
Figure 2
40-marker multiplex staining performed using the seqIF method. (a) Snapshots of individual markers from a 40-plex panel staining from human tonsil FFPE samples performed with seqIF on COMET™. Scale bar: 50 μm. (b) Multiple composite images of a 40-plex staining showing the same region of interest (ROI) of a human tonsil FFPE sample. Autofluorescence subtracted and brightness adjusted for visualization. Scale bar: 100 µm.
Figure 3
Figure 3
Elution efficiency assessment of seqIF. (a) Elution efficiency and epitope stability of CD20 staining on a human tonsil FFPE sample across 20 elution cycles. Scale bar: 50 μm. (b) Example of elution followed by negative controls on different tissue samples, with elution efficiency indicated as a percentage. The first panel shows the elution efficiency of the markers CD45, CD68, and CD19 on a human FFPE tonsil sample. The second panel shows the elution efficiency of the markers E-Cadherin, CD3, and MYL9 on a human FFPE colorectal cancer sample. The third panel displays the elution efficiency of CD45, GFAP, and F4/80 on different mouse frozen section tissues (spleen, brain, and liver). Scale bars: 50 μm.
Figure 4
Figure 4
Staining intensity evaluation over 20 iterations of seqIF protocol. (a) Epitope stability of four markers targeting different cell types and cellular localization (CD45, FoxP3, CK, and Vimentin) quantified after 5 cycles, 10 cycles, 15 cycles and 20 cycles of elution compared to the initial staining. All staining and elution steps were performed on the same tissue sample (human tonsil FFPE). The signal-to-background ratios (SBR) as a % of the initial staining are displayed on the right. Scale bar: 50 μm. n = 1. (b) Epitope stability of four markers targeting different cell types and cellular localization (CD45, FoxP3, CK, and Vimentin) quantified after 5 cycles, 10 cycles, 15 cycles and 20 cycles of elution compared to the initial staining. All staining and elution steps were performed on human lung adenocarcinoma (AC) and squamous cell carcinoma (SCC) FFPE samples. The SBR as a % of the initial staining are displayed on the right. Scale bar: 50 μm. n = 1.
Figure 5
Figure 5
seqIF repeatability and reproducibility studies run for 4 markers on human FFPE tonsil tissue. (a) Intra-stainer repeatability was assessed by 3 subsequent runs performed on the same staining unit during the same day and resulted in CVs below 8%. Scale bar: 50 μm. (b) Reproducibility of the assay was assessed by the same protocol being executed on the same staining unit of the same device on independent days and resulted in CVs below 10%. (c) Repeatability between independent staining units was assessed by executing the same protocol on all stainers of the same COMET™ device and resulted with CVs below 17%. (d) Reproducibility of the assay between different devices was assessed by executing the same protocol on different platforms on the same day and resulted in CVs below 20%. CV stands for coefficient of variation of SBR between different images in the dataset. n = 1.
Figure 6
Figure 6
Demonstration of aspects that ensure image quality with seqIF. (a) Quantification of the horizontal and vertical signal variation of a staining for CD20 on human tonsil FFPE performed and imaged on COMET™. The normalized signal intensities of 25 regions of interest (left, blue squares) were plotted according to their horizontal (right graph, blue) or vertical position (right graph, orange). Overall signal variation for both axes was determined to be below 6%. Both X and Y values are represented in millimeters. Scale bar: 1 mm. (b) Example of the dynamic range of a FoxP3 seqIF staining (left) and pseudo coloring with a Fire look up table (right) highlighting low, mid, and high expressing cells. The scale represents grey values of the 16-bit images (1 to 65,535). (c) Automated flat-field correction provides uniform seqIF images. The result is a seamless mosaic of the whole image without aberrations (right) compared to an image without correction and visible aberrations (left).
Figure 7
Figure 7
seqIF images on COMET provide subcellular resolution for single cell analysis. (a) Upper panel: Border of a human tonsil, germinal center FFPE sample, with a subset of a 10-plex panel staining (CD20: cyan, CD3: magenta, CK: yellow). Scale bars: 1 mm (left) and 100 µm (right). Lower panels: Three zoomed-in regions where multiple cell subtypes are identified, including epithelial cells, B cells, T cells (bottom left); macrophage cells and proliferating T helper cells (bottom right); immature T cells, T helper cells, T killer cells and T regulatory cells (bottom center). (b) Endogenous tissue autofluorescence (magenta) and CD68 staining (green) of a human lung adenocarcinoma FFPE sample. Scale bar: 100 µm.

References

    1. Couzin-Frankel J. Breakthrough of the year 2013. Cancer immunotherapy. Science. 2013;342:1432–1433. doi: 10.1126/science.342.6165.1432. - DOI - PubMed
    1. Havel JJ, Chowell D, Chan TA. The evolving landscape of biomarkers for checkpoint inhibitor immunotherapy. Nat. Rev. Cancer. 2019;19:133–150. doi: 10.1038/s41568-019-0116-x. - DOI - PMC - PubMed
    1. Galon J, et al. Type, density, and location of immune cells within human colorectal tumors predict clinical outcome. Science. 2006;313:1960–1964. doi: 10.1126/science.1129139. - DOI - PubMed
    1. Bruni D, Angell HK, Galon J. The immune contexture and Immunoscore in cancer prognosis and therapeutic efficacy. Nat. Rev. Cancer. 2020;20:662–680. doi: 10.1038/s41568-020-0285-7. - DOI - PubMed
    1. Galon J, et al. Cancer classification using the Immunoscore: A worldwide task force. J. Transl. Med. 2012;10:205. doi: 10.1186/1479-5876-10-205. - DOI - PMC - PubMed