. 2024 Feb;19(2):237-245.
doi: 10.1038/s41565-023-01507-y. Epub 2023 Oct 9.

Multivalent insulin receptor activation using insulin-DNA origami nanostructures

Affiliations

Multivalent insulin receptor activation using insulin-DNA origami nanostructures

Joel Spratt et al. Nat Nanotechnol. 2024 Feb.

Abstract

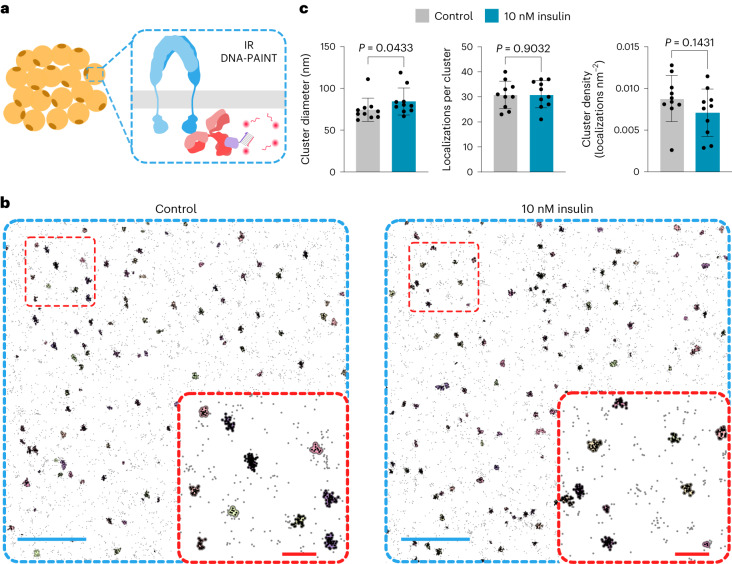
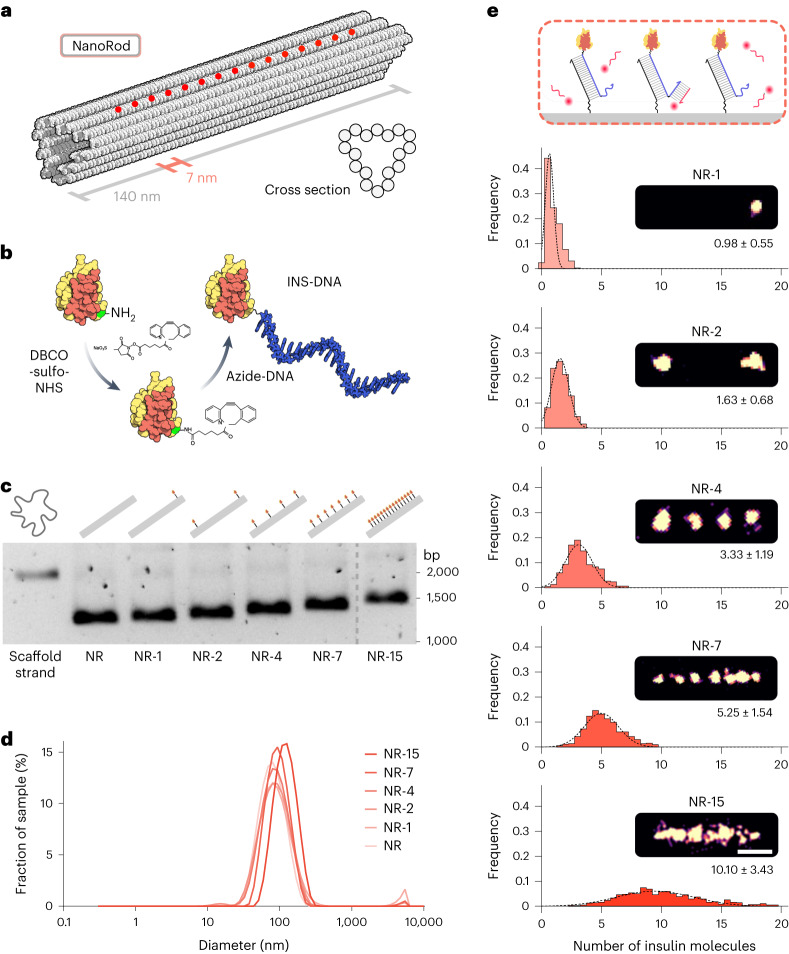
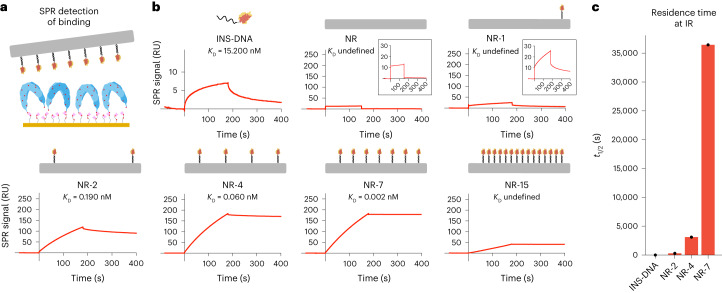
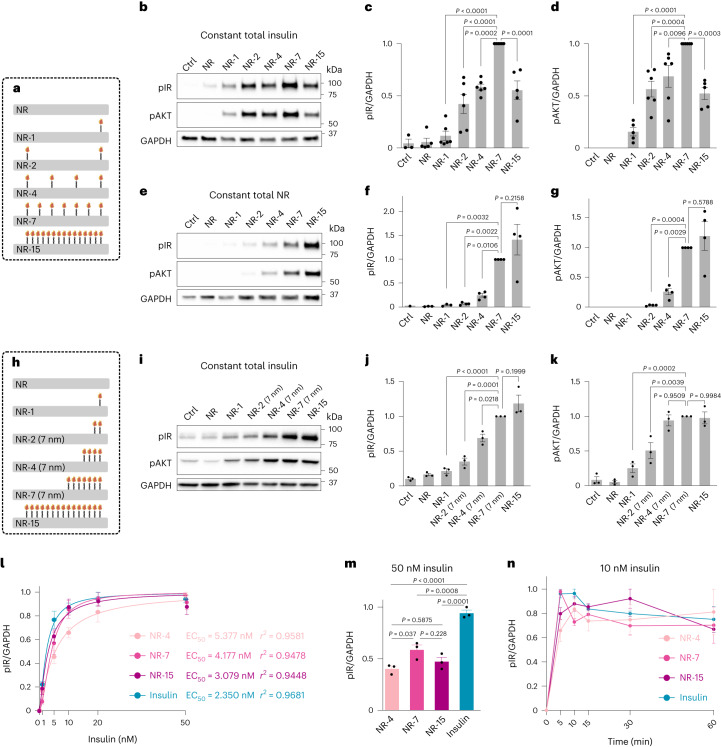
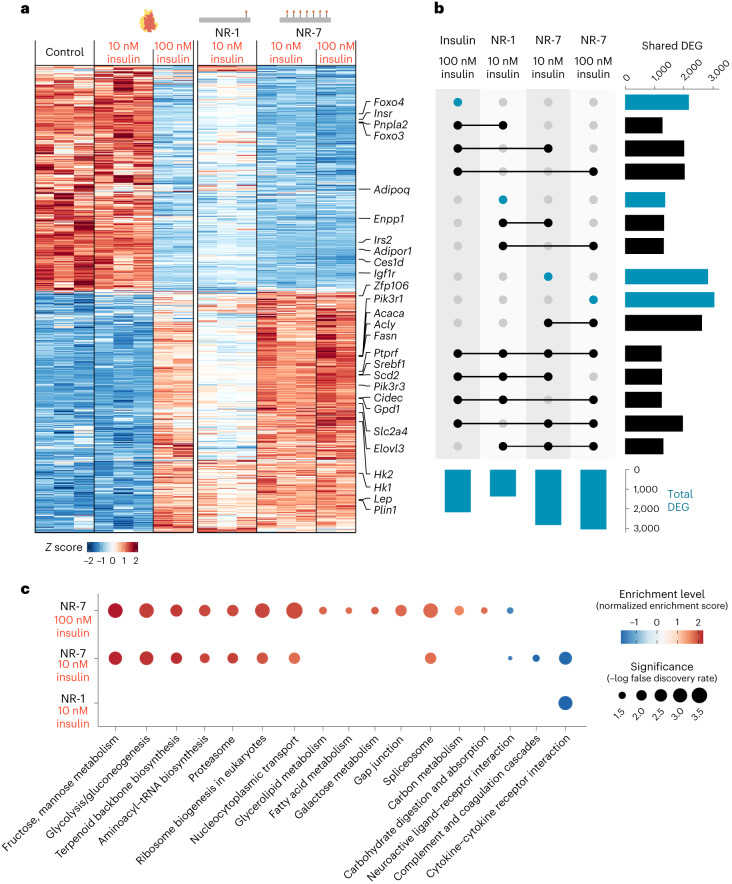
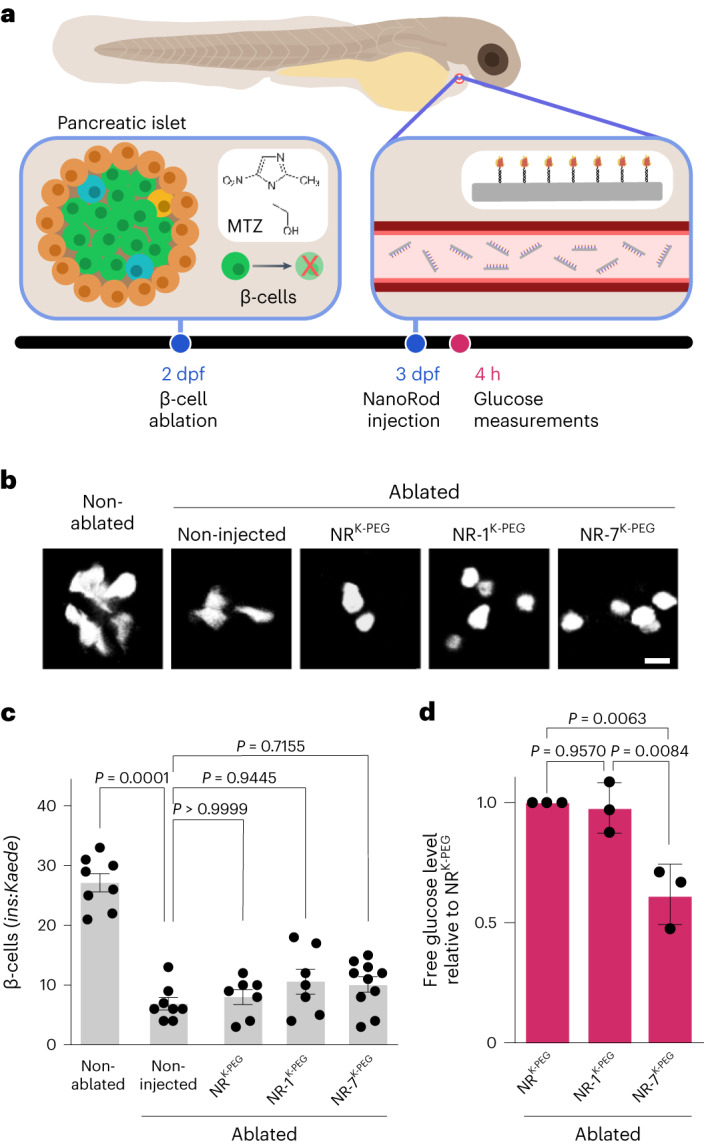
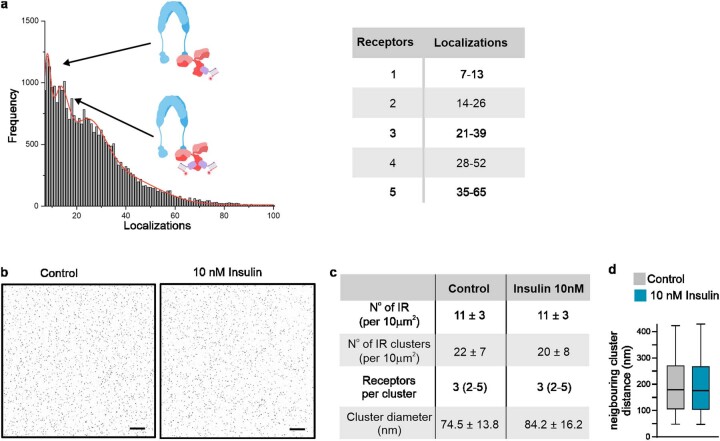
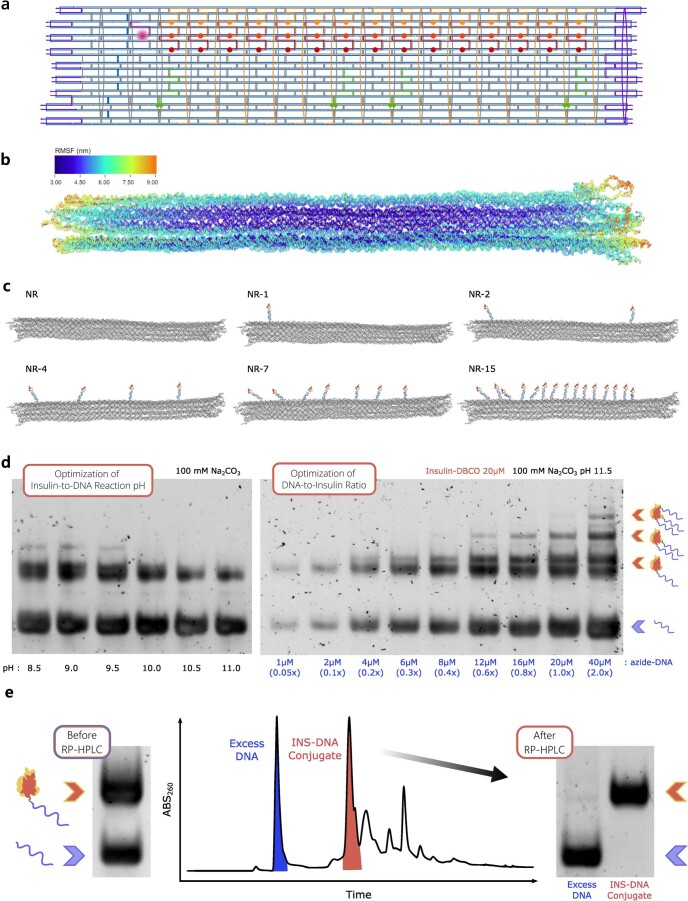
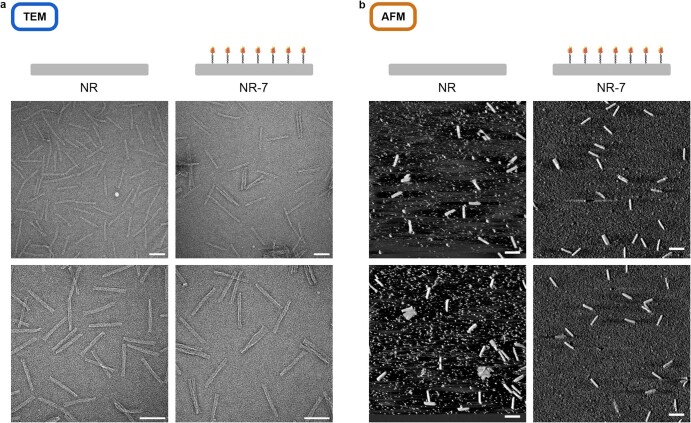
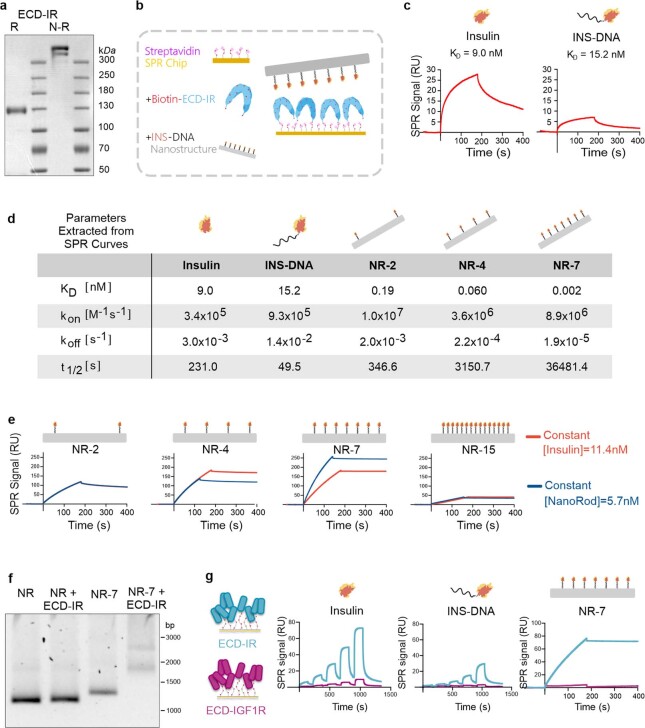
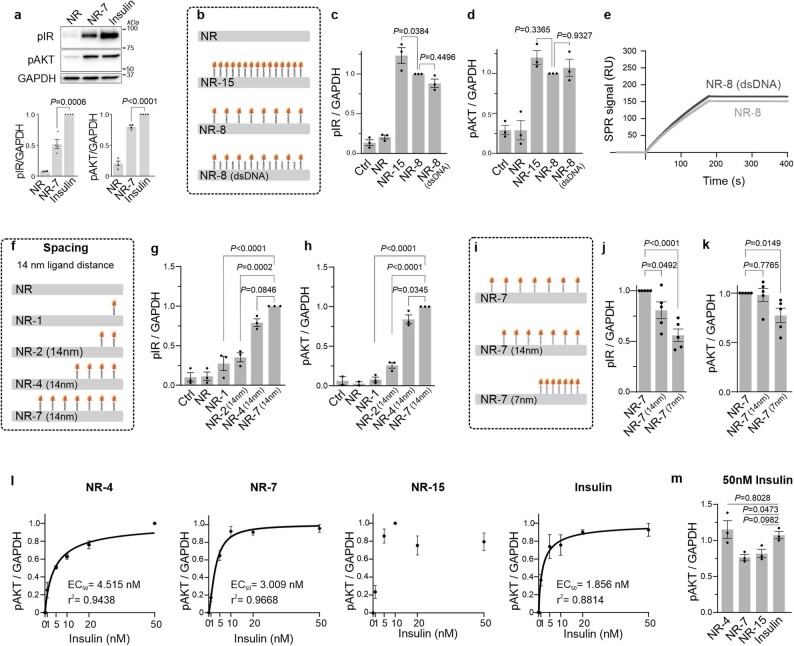
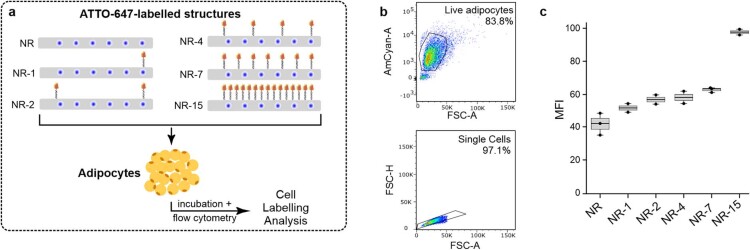
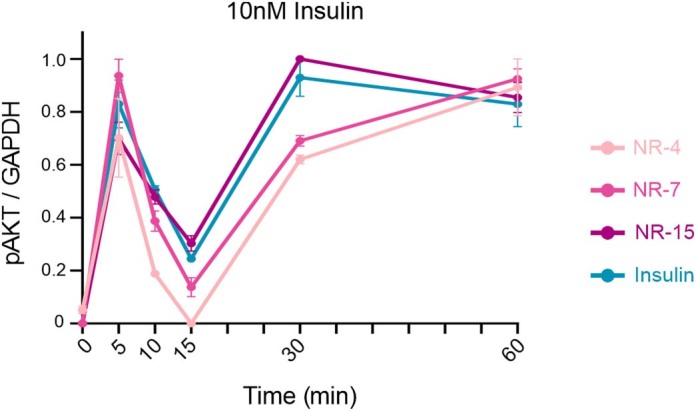
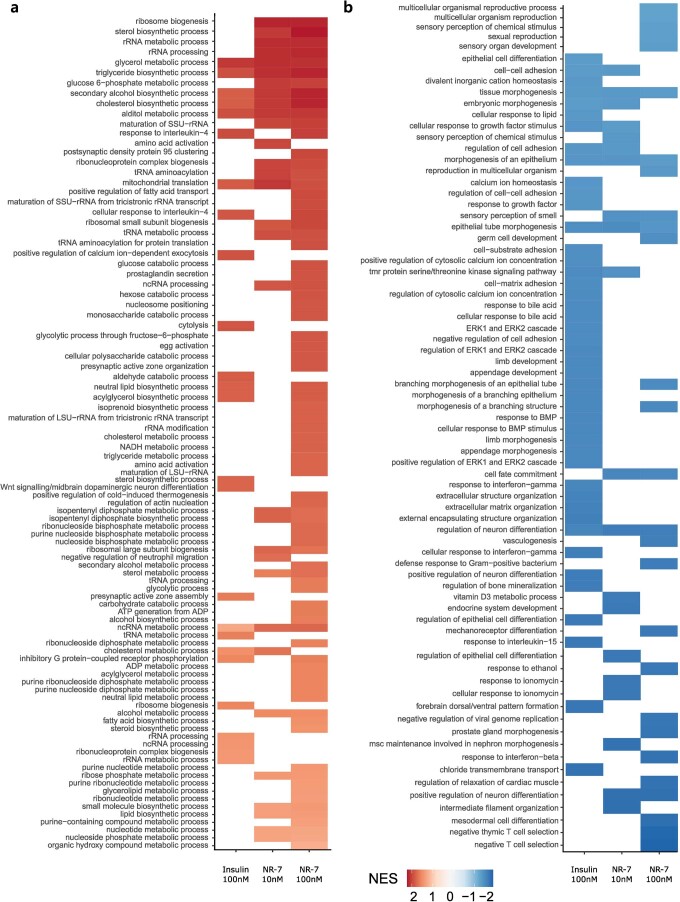
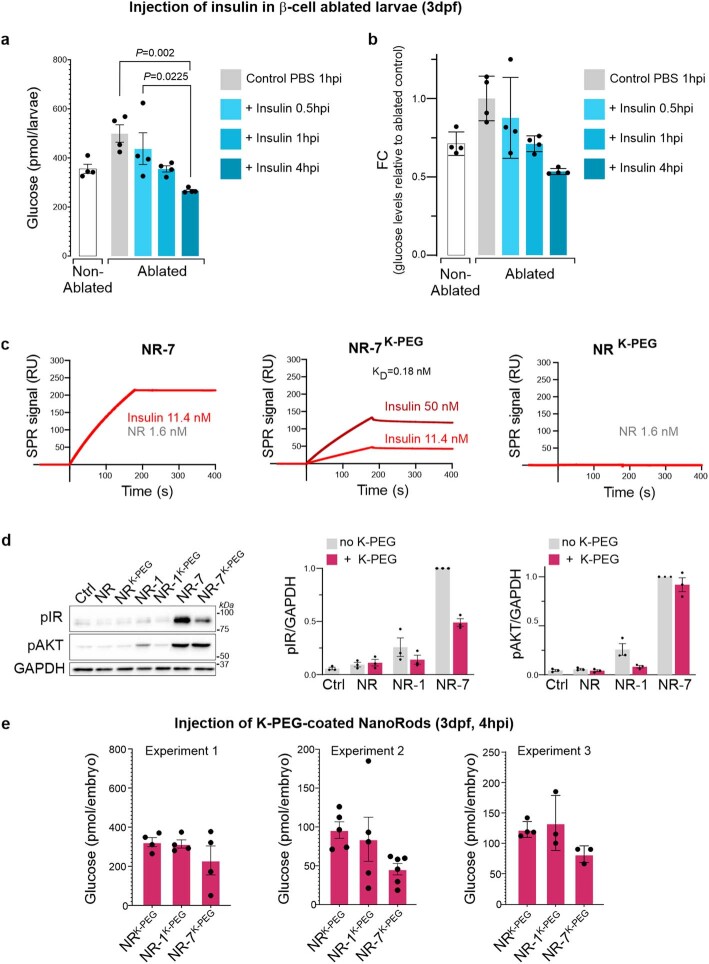
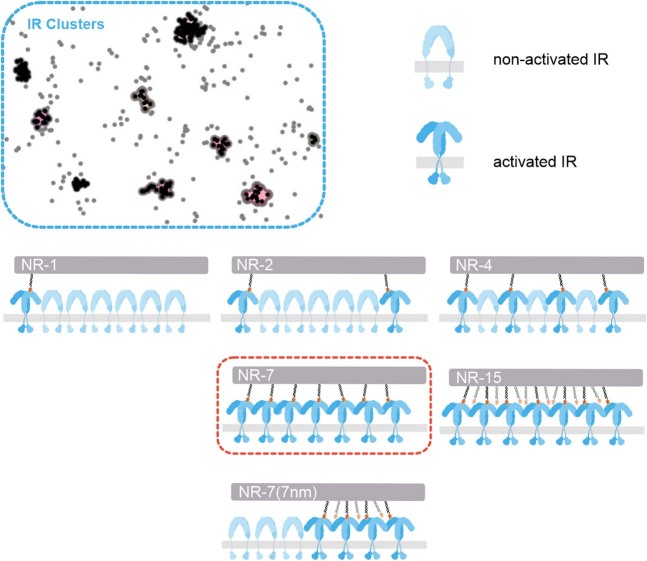
Insulin binds the insulin receptor (IR) and regulates anabolic processes in target tissues. Impaired IR signalling is associated with multiple diseases, including diabetes, cancer and neurodegenerative disorders. IRs have been reported to form nanoclusters at the cell membrane in several cell types, even in the absence of insulin binding. Here we exploit the nanoscale spatial organization of the IR to achieve controlled multivalent receptor activation. To control insulin nanoscale spatial organization and valency, we developed rod-like insulin-DNA origami nanostructures carrying different numbers of insulin molecules with defined spacings. Increasing the insulin valency per nanostructure markedly extended the residence time of insulin-DNA origami nanostructures at the receptors. Both insulin valency and spacing affected the levels of IR activation in adipocytes. Moreover, the multivalent insulin design associated with the highest levels of IR activation also induced insulin-mediated transcriptional responses more effectively than the corresponding monovalent insulin nanostructures. In an in vivo zebrafish model of diabetes, treatment with multivalent-but not monovalent-insulin nanostructures elicited a reduction in glucose levels. Our results show that the control of insulin multivalency and spatial organization with nanoscale precision modulates the IR responses, independent of the insulin concentration. Therefore, we propose insulin nanoscale organization as a design parameter in developing new insulin therapies.


Conflict of interest statement

The authors declare no competing interests.

Figures

Fig. 1
Fig. 1. IRs are organized in nanoclusters at the cell membrane.
a, Schematic of DNA-PAINT used to image IRs (blue) using antibodies (red) targeting the intracellular kinase domain in adipocyte cultures. b, Cluster outlines derived from DNA-PAINT of IRs at the cell membrane of adipocytes treated with PBS (control) or with 10 nM of insulin for 10 min. The insets show the magnified regions highlighting the identified clusters. Scale bars, 1 µm (blue); 200 nm (red, inset). c, Characterization of IR clusters in control and insulin-treated adipocytes. Data are presented as mean ± standard deviation (s.d.), n = 10 cells per condition. The P values are determined by a two-tailed Mann–Whitney test. Source data
Fig. 2
Fig. 2. Insulin NanoRods with programmable insulin configurations.
a, Representation of the DNA origami NanoRod. The red circles correspond to the positions of protruding DNA strands at programmable positions along one of its faces used for hybridization to INS-DNA. b, Overview of the method used to conjugate a single azide-modified ssDNA oligonucleotide to the B29 lysine of insulin (green) using a DBCO-sulfo-NHS crosslinker (not drawn to scale). c, Agarose gel electrophoresis of the scaffold strand and of insulin NanoRods with 0 (NR), 1 (NR-1), 2 (NR-2), 4 (NR-4), 7 (NR-7) and 15 (NR-15) insulin molecules. The image is representative of three independent experiments. d, Analysis of the indicated insulin NanoRods by dynamic light scattering. e, Schematic of DNA-PAINT used to image INS-DNA bound to the NanoRods. Distribution of the occupancy of insulin on the indicated insulin NanoRods. The values presented under the images correspond to mean ± s.d. Scale bar, 50 nm. Source data
Fig. 3
Fig. 3. Valency of insulin on NanoRods determines the residence time of IR binding.
a, Schematic of the SPR assay: biotinylated ECD-IR was immobilized onto a streptavidin-coated SPR surface followed by incubation with INS-DNA or insulin NanoRods. b, SPR traces showing the binding of INS-DNA and of the indicated insulin NanoRods to the ECD-IR. KD was calculated from the curves obtained from INS-DNA, NR-2, NR-4 and NR-7. RU, resonance units. c, Residence time (t1/2) of the insulin NanoRods and INS-DNA on ECD-IR, calculated from the SPR binding curves. The values shown are from one representative experiment out of two independent experiments. Source data
Fig. 4
Fig. 4. Valency and spacing of insulin on NanoRods determine IR pathway activation.
a, Schematic of the NanoRods used in experiments (bg and ln). bd, Western blot analysis (b) and the quantification of phosphorylated IR (pIR) (c) and phosphorylated AKT (pAKT) (d) levels in adipocytes treated with medium as controls (Ctrl) or with the indicated insulin NanoRods for 10 min. The total insulin concentration was kept constant at 10 nM. The values are presented as mean ± standard error of the mean (s.e.m.); n = 5 (NR-15) or n = 6 (remaining conditions) biologically independent samples. eg, Western blot analysis (e) and the quantification of pIR (f) and pAKT (g) levels of adipocytes treated with medium (Ctrl) or with the indicated insulin NanoRods for 10 min. The total concentration of NanoRods was kept constant at 1 nM. The values are presented as mean ± s.e.m.; n = 4 biologically independent samples. h, Schematic of the NanoRods used in experiments (ik). ik, Western blot analysis (i) and the quantification of pIR (j) and pAKT (k) levels of adipocytes treated with medium (Ctrl) or with the indicated insulin NanoRods for 10 min. The total insulin concentration was kept constant at 10 nM. The values are presented as mean ± s.e.m.; n = 3 biologically independent samples. c,d,f,g,j,k, P values determined by one-way ANOVA followed by Dunnett’s multiple comparisons test. l, Quantification of pIR levels in adipocytes treated with increasing total insulin concentrations of NR-4, NR-7, NR-15 and unmodified insulin for 10 min. Data are plotted as normalized intensities relative to their highest and lowest values, for each condition. m, Quantification of pIR levels in adipocytes treated with 50 nM total insulin of NR-4, NR-7, NR-15 and unmodified insulin for 10 min. P values determined by one-way ANOVA followed by Dunnett’s multiple comparisons test. n, Quantification of pIR levels in adipocytes treated with 10 nM total insulin of NR-4, NR-7, NR-15 and unmodified insulin for 5, 10, 15, 30 and 60 min. Data are plotted as normalized intensities relative to their highest and lowest values, for each condition. The values in ln are presented as mean ± s.e.m. for n = 3 biologically independent samples. The unmodified insulin used was purified similar to the NanoRods. Source data
Fig. 5
Fig. 5. Valency of insulin on NanoRods modulates transcriptional responses.
a, Heat map of DEG (P ≤ 0.001; log2fold change, ±0.58) in adipocyte cultures treated with medium (Control), insulin at 10 or 100 nM, NR-1 at 10 nM of insulin and NR-7 at 10 nM or 100 nM of insulin for 4 h. b, UpSet plot visualizing the total number (blue bars) and shared (black bars) DEG across all the conditions for which DEG were detected. c, GSEA with false-discovery rate adjustment for KEGG pathways enriched (P ≤ 0.05) in cells treated with NR-1 at 10 nM insulin or NR-7 at 10 and 100 nM insulin. The highlighted categories indicate pathways associated with insulin metabolism. INS denotes insulin. Source data
Fig. 6
Fig. 6. Valency of insulin on NanoRods determines their capacity to lower free glucose in β-cell-ablated zebrafish larvae.
a, Schematic of the zebrafish model, which expresses the enzyme nitroreductase (NTR) under the control of the insulin promoter and converts the MTZ compound into a toxic byproduct that ablates β-cells. Larvae were treated with MTZ at 2 dpf for 24 h. Double-transgenic larvae, Tg(ins:CFP-NTR);Tg(ins:Kaede), were used to visualize β-cells with the fluorescent protein Kaede. NRK-PEG, NR-1K-PEG or NR-7K-PEG was intravenously injected into larvae at 3 dpf and the measurements of free glucose levels were taken 4 hpi. b, Confocal microscopy imaging of the Kaede fluorescent protein expressed in pancreatic β-cells in the indicated conditions. Scale bar, 10 µm. c, Bar plots of the quantifications of Kaede+ β-cells. Two independent experiments were performed; one representative experiment is shown where each dot corresponds to a larva. The values are presented as mean ± s.e.m. n = 8 (non-ablated, ablated non-injected), n = 7 (NRK-PEG, NR-1K-PEG), n = 10 (NR-7K-PEG). The P values are determined by a Kruskal–Wallis test with Dunn’s multiple comparisons test. d, Bar plots of free glucose levels in NR-1K-PEG- and NR-7K-PEG-treated larvae relative to NRK-PEG-treated larvae. The values are presented as mean ± s.d. n = 3 independent experiments (Extended Data Fig. 9e). The P values are determined by one-way ANOVA with Tukey’s multiple comparisons test. Source data
Extended Data Fig. 1
Extended Data Fig. 1. Characterization of insulin receptors at the adipocyte cell membrane.
a, Histogram of the number of localizations per cluster. Red line represents the Gaussian fit showing multiple peaks representing one, two, three, etc., docking sites. Peaks at 7 ± 0.14 and 13 ± 0.61 both correspond to signal from a single receptor since each primary antibody can be bound by one or two nanobodies conjugated to one DNA-PAINT docking site. The table shows the range of localizations that define the number of receptors. b, Insulin receptor cluster outlines in adipocytes treated with 10 nM insulin for 10 mins and corresponding control. Image representative of 3 independent experiments. Scale bar, 2 µm. c, Table showing the number of IR and IR clusters per 10 µm2 region (mean ± SD), number of receptors per cluster (median and interquartile range), and cluster diameter (mean ± SD) plotted in Fig. 1c, in control and insulin-treated adipocyte cells. d, Characterization of the distance between the edges of neighboring IR clusters in Control (median=178.9 nm, 95% CI = 176.1-181.4 nm) and insulin treated (median=175.7 nm, 95% CI = 173.2-178.3 nm) adipocytes. Boxplot data: center line defines median, whiskers indicate 5-95 percentile. n = 16897 (control) and n = 16374 (10 nM Insulin) pairs of clusters examined over 10 cells for each condition. Data points outside whisker limits are omitted from plot. Source data
Extended Data Fig. 2
Extended Data Fig. 2. Characterization of insulin-DNA conjugates and insulin NanoRods.
a, The 18-helix tube DNA origami design (referred to as NanoRod) showing staple positions, as visualized with caDNAno software. Colour coding was as follows: green = biotin staples, orange/red = possible insulin-DNA attachment sites, purple = staples at end of rod. b, Rigidity analysis of the NanoRod structure using the oxDNA coarse-grained modelling software (available at https://oxDNA.org) and visualized via the browser-based online tool oxView. Rigidity analysis showed some fluctuations at the ends of the rod but a stable solid core. RMSF: root mean square fluctuations. c, Snapshots from the oxDNA simulations for the indicated insulin NanoRods. Insulin peptides were not possible to included in the DNA-only simulations but insulin peptides (red) were drawn in afterwards to illustrate their scale. d, Optimization of conjugation conditions of insulin to DNA. Images of native polyacrylamide gels stained with SYBR Gold to visualize azide-DNA and insulin-DNA conjugates. The pH of the reaction and the ratio of DBCO-modified insulin to azide-DNA were optimized in order to obtain a single DNA strand conjugated to the insulin. In these experiments DBCO-modified insulin (insulin-DBCO) was kept at a constant concentration of 20 µM and the azide-DNA was used in a 1:1 ratio for the pH optimization experiments or used in a range of 1-40 µM in the optimization experiments of insulin-DBCO/azide-DNA ratio. Optimizations were performed once. Gels were acquired with different exposures. Values in brackets indicate azide-DNA: insulin-DBCO ratio. e, The insulin-DNA conjugation protocol resulted in an excess of unconjugated azide-DNA (bottom band, left gel, blue peak in HPLC trace) which required purification via RP-HPLC for separation from the insulin-DNA (INS-DNA) conjugate (top band, left gel, red peak HPLC trace). HPLC purification was able to entirely remove free azide-DNA (right gel). Analysis of purified conjugates was carried for every production batch. Source data
Extended Data Fig. 3
Extended Data Fig. 3. TEM and AFM imaging of NanoRods and insulin NanoRods.
a, Representative TEM images of NR and NR-7 nanostructures. Scale bars 100 nm. b, Representative AFM phase images of NR and NR-7 nanostructures. Scale bars 200 nm. Images representative of 2 independent experiments.
Extended Data Fig. 4
Extended Data Fig. 4. Characterization of insulin and insulin NanoRod binding to IR by SPR and gel shift assays.
a, Coomasie gel of recombinant extracellular domain of human IR (ECD-IR) in non-reducing (N-R) or reducing (R) conditions. In reducing conditions ECD-IR runs at approximately the molecular weight predicted for the monomeric protein. In non-reducing conditions proteins run at a higher molecular weight, indicating that the ECD-IR proteins in our assays are present as dimeric protein complexes. b, Schematic of the components of the SPR set-up. c, SPR traces of unmodified insulin (INS) and INS-DNA conjugates (the latter also shown in Fig. 3b). d, Parameters extracted from SPR curves in Fig. 3, for structures where values could be determined, and from the SPR curve in panel (c) for unmodified insulin. We were not able to determine parameters for the NR, NR-1, and NR-15 because the SPR sensorgrams, both in association and dissociation phase, could not be fitted by the available models. e, SPR experiments were done both at constant insulin concentration (11.4 nM, red curves also shown in Fig. 3b), or at constant NanoRod concentration (5.7 nM, blue curves). Similar overall trends were observed in the two sets of data. f, Agarose gel stained for DNA of gel shift binding assays showing that NR-7, but not NR, bind to ECD-IR. a,f, Images representative of 2 independent experiments. g, SPR sensorgrams of insulin, INS-DNA and NR-7 binding to sensor chips with immobilized ECD-IR (blue curve) or ECD-IGF1R (magenta curve). Binding of insulin and INS-DNA was tested using a range of insulin concentrations (6.2, 18.5, 55.6, 166.7, and 500 nM). Binding of NR-7 was tested at a single concentration of the nanostructure (11.4 nM insulin). Source data
Extended Data Fig. 5
Extended Data Fig. 5. Characterization of the effects of insulin spacing and valency on IR-pathway activation.
a, Western blot analysis and quantification of pIR and pAKT levels of differentiated adipocytes treated with NR, NR-7 and insulin for 10 min at 10 nM of total insulin concentration. Values presented as mean ± SEM; n = 4 biologically independent samples. P values, unpaired two-tailed t test. b, Schematic representation of structures used in (c-e). c,d, Western blot quantifications of pIR (c) and pAKT (d) levels of differentiated adipocytes treated with medium as controls (Ctrl) or with indicated insulin NanoRods for 10 min. The total concentration of NanoRods was kept constant at 10 nM. Values presented as mean ± SEM; n = 3 biologically independent samples. P values, one-way ANOVA followed by Dunnet’s multiple comparisons test. e, SPR sensorgrams of the binding of NR-8 and NR-8(dsDNA) structures to the ECD-IR on the SPR chip. RU, resonance units. f, Schematic representation of structures used in (g,h) g,h, Western blot quantifications of pIR (g) and pAKT (h) levels of differentiated adipocytes treated with medium (Ctrl) or with indicated insulin NanoRods for 10 min. The total insulin concentration was kept constant at 10 nM. Values presented as mean ± SEM; n = 3 biologically independent samples. P values, one-way ANOVA followed by Dunnet’s multiple comparisons test. i, Schematic representation of structures used in (j,k). j,k, Western blot quantifications of pIR (j) and pAKT (k) levels of differentiated adipocytes treated with indicated insulin NanoRods for 10 min. The total insulin concentration was kept constant at 10 nM. Values presented as mean ± SEM; n = 5 biologically independent samples. P values, unpaired two-tailed t test. l,m, Quantification of pAKT levels in adipocytes treated with NR-4, NR-7, NR-15, and unmodified insulin for 10 min at increasing concentrations of total insulin. Unmodified insulin used in these experiments was purified similarly to the insulin NanoRods. Data plotted as normalized intensities relative to their highest and lowest values, for each of the conditions (l). Values presented as mean ± SEM, n = 3 biologically independent samples. P values, one-way ANOVA followed by Dunnet’s multiple comparisons test. Source data
Extended Data Fig. 6
Extended Data Fig. 6. Characterization of cell labelling by insulin NanoRods.
a, Schematic summary of the flow cytometry assay. NanoRod structures were labelled with six ATTO-647 fluorophores. Dissociated adipocytes were incubated for 10 min with 10 nM NanoRod structures before flow cytometry analysis. b, Dot plot graphs from flow cytometry analysis representing gates for live and single cell adipocytes. c, Box plots of mean fluorescent intensity (MFI) for adipocytes treated with indicated structures. Data was normalized to untreated cells. Boxplot data: the center line defines median, the box indicates 95% CI, and the whiskers indicate SD. n = 3 (NR and NR-7 conditions) or n = 2 (remaining conditions) biologically independent samples. Source data
Extended Data Fig. 7
Extended Data Fig. 7. Characterization of IR-pathway activation over time.
Quantification of pAKT levels in adipocytes treated with 10 nM total insulin of NR-4, NR-7, NR-15, and unmodified insulin for 5, 10, 15, 30 and 60 min. Data plotted as normalized intensities relative to their highest and lowest values, for each of the conditions. Values presented as mean ± SEM, n = 3 biologically independent samples. Source data
Extended Data Fig. 8
Extended Data Fig. 8. Gene set enrichment analysis (GSEA) of GO-Terms.
GSEA was generated from a ranked list of DE genes from INS (100 nM), NR-7 (10 nM and 100 nM) treated adipocytes, and the degree of enrichment is indicated by the normalized enrichment score (NES) with positive (a) or negative (b) enrichment scores. The GO-Terms were considered significantly enriched with an FDR adjusted p-value cutoff at 0.1. No GO-Terms were significantly enriched for NR-1 (10 nM) treated adipocytes.
Extended Data Fig. 9
Extended Data Fig. 9. Analysis of free glucose levels in β-cell-ablated zebrafish larvae and characterization of oligolysine-PEG coated insulin NanoRods.
a, Measurement of free glucose levels in β-cell ablated zebrafish larvae at various time points post-injection of 2 nl of 100 nM insulin. Non-ablated larvae and β-cell-ablated larvae injected with PBS were used as controls. Data presented as mean ± SD. n = 4 biologically independent samples. Each dot corresponds to measurements from a pool of 3-6 larvae. P values, one-way ANOVA with Turkey´s multiple comparison test. hpi, hours post-injection. b, Replotting of free glucose levels data from panel (a) relative to ablated (control) condition. Values presented as mean ± SD. n = 4 biologically independent samples. c, SPR traces showing the binding of indicated insulin NanoRods to the ECD-IR on the SPR chip. KD for oligolysine-PEG-coated NR-7 (NR-7K-PEG) was obtained from sensorgrams using 50 nM concentration of total insulin. No binding was detected for oligolysine-PEG-coated NR (NRK-PEG) structures, which were used as a control indicating that coating does not result in non-specific binding. RU, resonance units. d, Western blot analysis and quantification of pIR and pAKT levels of adipocytes treated with uncoated (NR, NR-1, NR-7) or coated (NRK-PEG, NR-1K-PEG, NR-7K-PEG) structures. Values in bar plots presented as mean ± SEM; n = 3 biologically independent samples. e, Measurement of free glucose levels in β-cell ablated zebrafish larvae 4 hours post injection of NR K-PEG, NR-1K-PEG, and NR-7K-PEG. Data presented as mean ± SEM. For Experiment 1, n = 4; Experiment 2, n = 5 (NR K-PEG, NR-1K-PEG) and n = 6 (NR-7K-PEG); Experiment 3, n = 4 (NR K-PEG) and n = 3 (NR-1K-PEG, NR-7K-PEG) biologically independent samples. Data corresponds to measurements from three separate experiments conducted on three separate occasions and was used to generate data presented in Fig. 6d. Each dot corresponds to a measurement from a pool of 3-6 larvae. Source data
Extended Data Fig. 10
Extended Data Fig. 10. Insulin receptor clustering at the cell membrane enables avidity effects between insulin receptor and insulin NanoRods.
DNA-PAINT super-resolution imaging revealed the presence of IR clustering at the cell membrane. NR-7 presents insulin molecules with a nominal average spacing of 17 nm and IR dimers are approximately 12 nm wide. Therefore, these nanostructures may offer the closest match between the distribution of insulin ligands in the nanostructures and IRs at the cell membrane. Further, increasing the number of insulin molecules per nanostructure, and therefore decreasing their spacing, as in NR-15, may result in “unused” insulin molecules.

References

    1. Sims EK, Carr ALJ, Oram RA, DiMeglio LA, Evans-Molina C. 100 years of insulin: celebrating the past, present and future of diabetes therapy. Nat. Med. 2021;27:1154–1164. - PMC - PubMed
    1. James DE, Stöckli J, Birnbaum MJ. The aetiology and molecular landscape of insulin resistance. Nat. Rev. Mol. Cell Biol. 2021;22:751–771. - PubMed
    1. Li J, et al. Synergistic activation of the insulin receptor via two distinct sites. Nat. Struct. Mol. Biol. 2022;29:357–368. - PMC - PubMed
    1. Menting JG, et al. How insulin engages its primary binding site on the insulin receptor. Nature. 2013;493:241–245. - PMC - PubMed
    1. Scapin G, et al. Structure of the insulin receptor-insulin complex by single-particle cryo-EM analysis. Nature. 2018;556:122–125. - PMC - PubMed

LinkOut - more resources