. 2024 Mar;8(3):214-232.
doi: 10.1038/s41551-023-01093-3. Epub 2023 Oct 9.

Rapid discovery of high-affinity antibodies via massively parallel sequencing, ribosome display and affinity screening

Affiliations

Rapid discovery of high-affinity antibodies via massively parallel sequencing, ribosome display and affinity screening

Benjamin T Porebski et al. Nat Biomed Eng. 2024 Mar.

Abstract

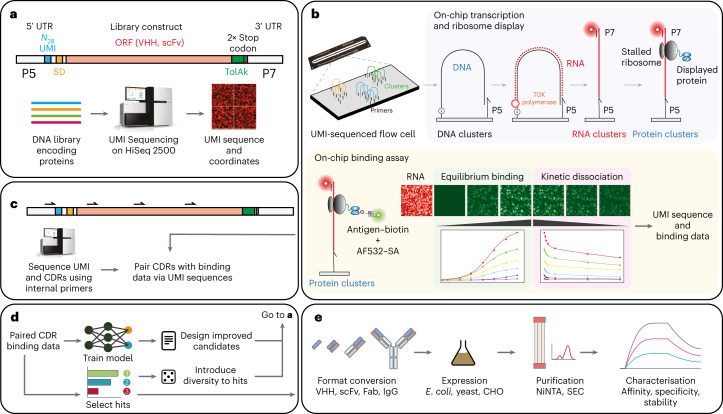
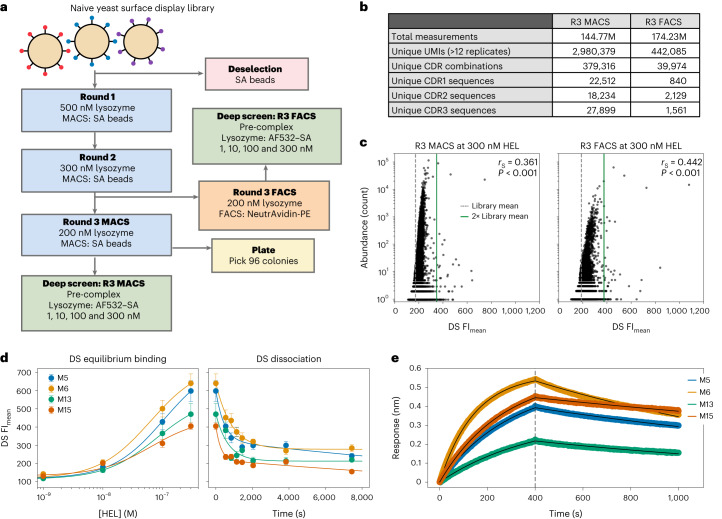
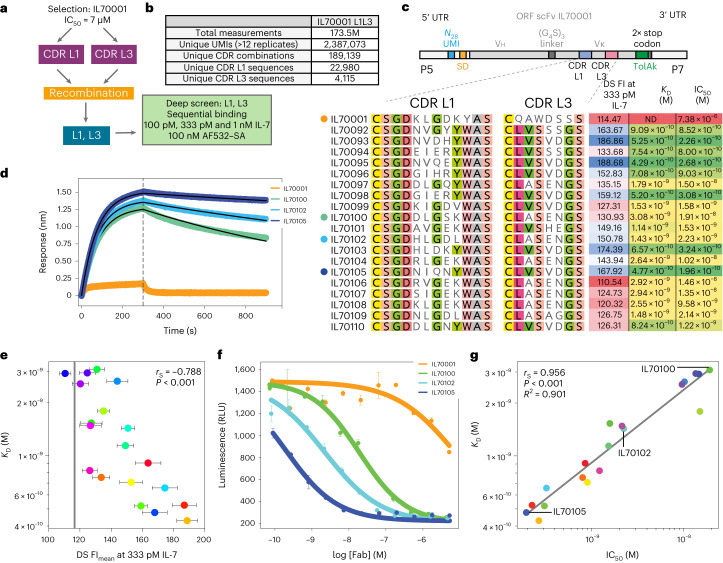
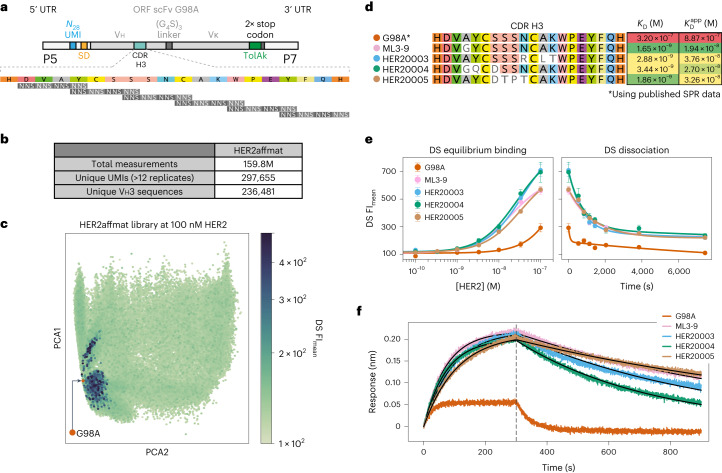
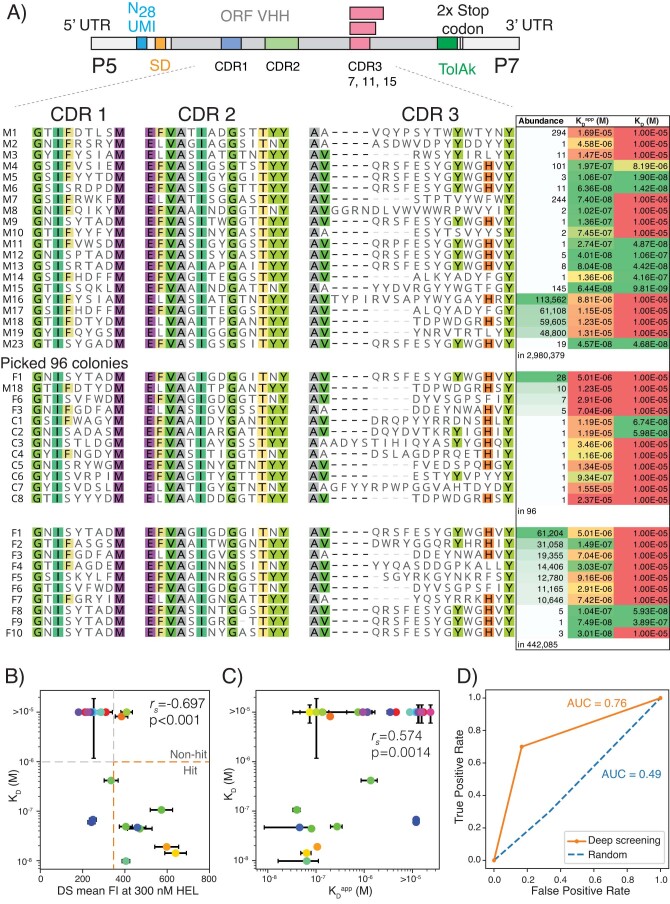
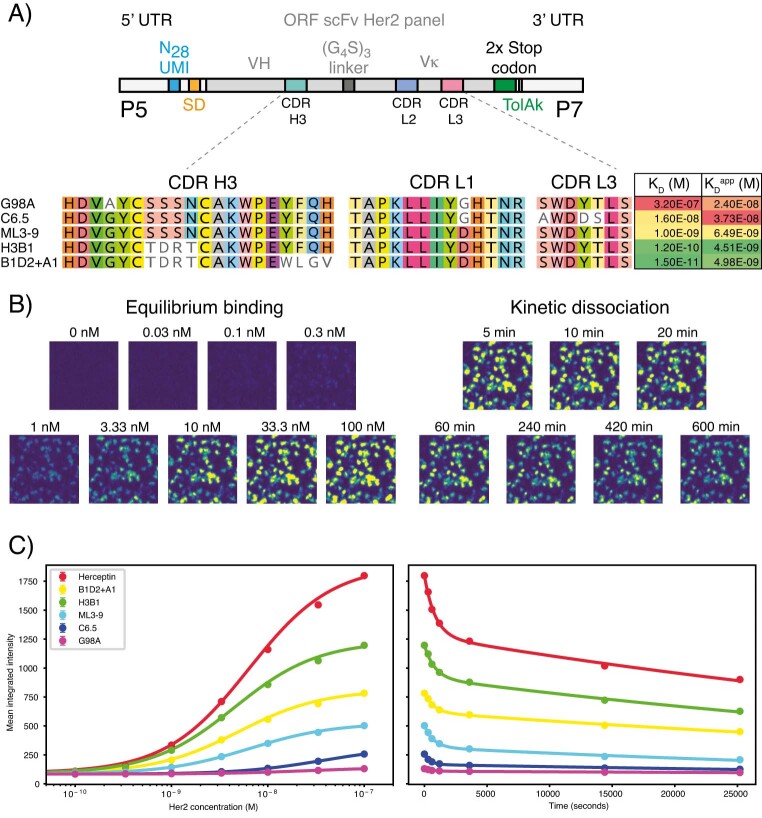
Developing therapeutic antibodies is laborious and costly. Here we report a method for antibody discovery that leverages the Illumina HiSeq platform to, within 3 days, screen in the order of 108 antibody-antigen interactions. The method, which we named 'deep screening', involves the clustering and sequencing of antibody libraries, the conversion of the DNA clusters into complementary RNA clusters covalently linked to the instrument's flow-cell surface on the same location, the in situ translation of the clusters into antibodies tethered via ribosome display, and their screening via fluorescently labelled antigens. By using deep screening, we discovered low-nanomolar nanobodies to a model antigen using 4 × 10⁶ unique variants from yeast-display-enriched libraries, and high-picomolar single-chain antibody fragment leads for human interleukin-7 directly from unselected synthetic repertoires. We also leveraged deep screening of a library of 2.4 × 10⁵ sequences of the third complementarity-determining region of the heavy chain of an anti-human epidermal growth factor receptor 2 (HER2) antibody as input for a large language model that generated new single-chain antibody fragment sequences with higher affinity for HER2 than those in the original library.


Conflict of interest statement

The MRC-LMB has filed a patent application on the methodologies described in this article, with B.T.P. and P.H. named as inventors. A.B., G.B. and A.R. are current employees of AstraZeneca. M.B. is a current employee of UCB Pharma. R.M. is a current employee of Alchemab Therapeutics. The other authors declare no competing interests.

Figures

Fig. 1
Fig. 1. Deep-screening workflow.
a, Antibody library preparation involves the addition of 5′ and 3′ untranslated regions (UTRs) that flank the library protein-coding region. The assembled library is then clustered and the N28 UMI sequenced on a HiSeq 2500, which reports the UMI sequence and its physical x–y coordinates on the flow cell. b, In deep screening, DNA clusters are converted into RNA clusters using engineered polymerase TGK and the DNA template is removed. The RNA clusters are labelled with a complementary Atto 647N-labelled oligonucleotide before IVT into protein (antibody) clusters. Cluster binding is determined by equilibrium binding of an increasing concentration of biotinylated antigen and AF532-labelled Streptavidin (SA), followed by kinetic dissociation from the highest antigen concentration. c, If the binding assay reports hits within the library, a second sequencing experiment is performed to determine the UMI and CDRs with internal sequencing primers. CDRs are then paired with binding data using the common UMIs between the two experiments. d,e, Paired CDR–binding data is analysed for hits and/or a ML model is trained to predict hits, which can be used to generate libraries for subsequent rounds of deep screening (d) or short-list hit candidates for characterization via conversion into an appropriate antibody format, expression, purification (using methods like nickel-nitrilotriacetic acid (NiNTA) resin and size exclusion chromatography (SEC)) (e).
Fig. 2
Fig. 2. Deep screening of a yeast-display-pre-selected VHH library.
a, Workflow of VHH yeast display selections. b, Library statistics, showing the total number of clusters or reads, the number of barcodes or UMIs with 12 replicates and number of unique CDR combinations in the protein space. c, Abundance versus deep-screening (DS) FImean of unique CDRs at 300 nM HEL from the R3 MACS and R3 FACS libraries. The library mean intensity is shown as a grey dashed line, and a solid green line shows the hit threshold of 2× the library background. rS values of 0.361 and 0.442, respectively, show a poor correlation between abundance and deep-screening binding intensities. d, Deep-screening equilibrium-binding and kinetic dissociation curves for clones M5, M6, M14 and M15. Error bars are s.e.m. and n ≥ 12 technical replicates of a given UMI. e, BLI kinetics at 50 nM of the same 4 clones against a HEL–biotin-loaded SA tip. The grey dashed line is denoting the separation of the association (left) and dissociation (right) phases collected during BLI kinetics measurements. Source data
Fig. 3
Fig. 3. Deep screening of an unselected scFv library.
a, Overview of the direct affinity maturation experiment from an unselected CDR L1, L3 affinity maturation library. b, Library statistics of the unselected L1L3 library from deep screening. c, IL70001 and the top-19 clones, showing CDR L1 and CDR L3 sequences, raw deep-screening intensities at 333 pM huIL-7, BLI-fitted KDs and IL-7R IC50s. d, BLI kinetics at 50 nM of IL70001, IL70100, IL70102 and IL70105 Fabs against a huIL-7-loaded SA tip. The grey dashed line is denoting the separation of the association (left) and dissociation (right) phases collected during BLI kinetics measurements. e, Deep-screening FImeans of the top-19 clones at 333 pM huIL-7 plotted against fitted BLI KDs. Error bars are s.e.m. and n ≥ 12 technical replicates of a given UMI. The grey vertical line shows the mean library intensity at 333 pM huIL-7. f, TF-1 STAT5 IL-7Rα and IL-7Rγ luciferase inhibition assay, showing mean signal from IL70001, IL70100, IL70102 and IL70105 as a representative range of the assay. All inhibition assay curves are shown in Supplementary Fig. 7. Error bars are the minimum and maximum observations, n = 2 technical replicates. g, Plotting BLI-fitted KDs against IC50 reveals a strong, linear correlation between affinity and inhibition (rS = 0.956, R2 = 0.901). As IL70001’s KD is probably considerably larger than 50 nM, the maximum response measured and speed of the on and off rates was insufficient for an accurate fit of the KD. ND, not determined. Source data
Fig. 4
Fig. 4. Affinity maturation of the anti-HER2 scFv G98A.
a, Construct schematic of G98A, showing its CDR H3 sequence and a depiction of how the six scanning-window NNS sub-libraries were structured. b, Experiment statistics from the deep-screening component. c, PCA plot showing all 236,000 CDR H3 protein sequences projected into two dimensions and coloured by FImean at 100 nM of HER2. A red dot shows the position of G98A wild type relative to the library. d, CDR H3 sequences of G98A, ML3-9 and three of the top-scoring clones identified by deep screening. As we were unable to obtain a 1:1 model fit to the BLI data of clone G98A at 20 nM of Fab, we opted to use the published surface plasmon resonance (SPR) KD value. Next to the sequences are binding KDs identified via BLI, and the deep-screening-fitted equilibrium-binding KDapps. e, Deep-screening equilibrium-binding and kinetic dissociation curves showing G98A, ML3-9 and three of the top-scoring clones. Error bars are s.e.m. and n ≥ 12 technical replicates of a given UMI. f, BLI kinetics of G98A, ML3-9 and three of the top-scoring clones at 20 nM of each clone in the Fab format on a HER2-loaded tip. The grey dashed line denotes the separation of the association (left) and dissociation (right) phases collected during BLI kinetics measurements. Source data
Fig. 5
Fig. 5. ML-augmented antibody-affinity maturation.
a, An overview of the workflow used to pre-train the BERT-DS model on 20 million Vh sequences from OAS on an MLM objective and to fine-tune the same model for classification of anti-HER2 binding. In the HER2affmat 5 min wash condition, a violin plot shows the data distribution in dark green, and an enlarged version of the same data is shown in light blue to better reveal the distribution. The red line shown in the violin plot indicates the FImean value measured for clone G98A, with lighter grey lines indicating FImean values 1.3× above and below. These lines were used to draw the hit thresholds for BERT-DS classification. b, The workflow used for in silico mutagenesis of three anti-HER2 seed sequences and selection of 13,121 random mutations and 11,916 ML-guided mutations before a second round of deep screening. c, Evaluation of the selected ML and random mutations at the 5 minute wash condition, which shows a substantial, 5-fold shift in the binding distribution of the ML-selected mutants (green) relative to making random mutations. In the box-and-whisker plots, the box extends from the lower to the upper quartile values with a red line to denote the median, and the whiskers extend to 1.5× the interquartile range. Outliers to the data are shown as a small open circle. d, CDR H3 sequences and BLI-derived KDs of G98A, HER20003, HER20004, HER20005 HER20006, HER20013 and HER20025. e, BLI-derived binding kinetics of a HER2-loaded tip and the top-scoring clones from each library (as purified Fabs) at a concentration of 20 nM. The grey dashed line denotes the separation of the association (left) and dissociation (right) phases collected during BLI kinetics measurements. Source data
Extended Data Fig. 1
Extended Data Fig. 1. Characterization of anti-HEL nanobodies.
a) Anti-HEL nanobody hit candidates selected for characterisation, showing the library construct structure (top) and clone ID, where M1-23 are derived from the R3 MACS library, C1-8 were identified by colony picking from the R3 MACS output and F1-10 were derived from the R3 FACS library. The abundance, CDR sequences, a deep screening derived equilibrium binding constant (KDapp), and BLI derived kinetic KDs are also shown. b) BLI KDs plotted against deep screening FI at 300 nM HEL for all characterised clones, revealing a Spearman’s rank correlation constant (rs) of -0.697 and a p-value (determined by two-tailed test) <0.001. Error bars are the errors from fitting respective binding constants. Hit thresholds are shown as dashed orange and grey lines. c) BLI KDs plotted against deep screening KDapps for all characterised clones revealing a Spearman’s rank correlation constant (rs) of 0.574 and p-value of 0.0014. Error bars are the errors from fitting respective binding constants. d) Receiver Operating Characteristic (ROC) curve showing the performance of deep screening at picking hits versus non-hits in a binary classification scheme, and how this compares to random. This curve uses the following hit thresholds: a mean FI at 300 nM HEL of 347.58 and a BLI KD of 10−6M. Area under the curve (AUC) values are indicative of performance, with deep screening having an AUC of 0.76, while random is 0.49. Source data
Extended Data Fig. 2
Extended Data Fig. 2. Display of an anti-HER2 scFv affinity panel.
a) Construct design showing CDR sequences (VH3, VL1 and VL3) and binding affinities of clones G98A, C6.5, ML3-9, H3B1 and B1D2 + A1. b) Flow cell images of the ribosome displayed anti-HER2 scFv affinity panel during equilibrium binding and kinetic dissociation. Images are set to the same min/max threshold of 100/1000. c) Curve fits to equilibrium binding and kinetic dissociation data, showing clones from A) and the addition of Herceptin (trastuzumab).
Extended Data Fig. 3
Extended Data Fig. 3. Rank and correlation plots from deep screening for the HER2 ML vs. Random library.
a) Rank plots of 199k anti-HER2 scFv clones from the equilibrium binding assay, showing their mean fluorescent intensities at 0 nM, 0.1 nM, 0.3 nM, 1 nM, 3.3 nM, 10 nM, 33.3 nM and 100 nM Her2. Clones were selected for a variety of reasons (see Extended Data 1) for subsequent conversion to Fab, expression, purification, and characterisation. b) PCA plot from the ‘HER2Affmat’ library, showing all 236k CDR H3 protein sequences projected into two dimensions and coloured by mean fluorescent intensity at 100 nM of HER2. A red dot shows the position of G98A wild-type relative to the library. c) PCA plot from the HER2 ML vs. Random library, showing all 199k CDR H3 protein sequences projected into two dimensions and coloured by mean fluorescent intensity at 100 nM of HER2. d) Correlation between BLI characterised binding affinities (KD) and deep screening mean FI at 0 nM, 0.1 nM, 0.3 nM, 1 nM, 3.3 nM, 10 nM, 33.3 nM, 100 nM HER2 and the 5 minute wash condition. Error bars are s.e.m. and n ≥ 12. The grey vertical line is showing the mean library intensity at each respective concentration. Correlations are shown as Spearman’s rank correlation constant (rs) and p-values were determined by a two-tailed test. e) Zoomed correlation between BLI characterised binding affinities (KD) and deep screening mean FI at 3.3 nM and 10 nM HER2. Error bars are s.e.m. and n ≥ 12. f) Correlation between BLI characterised binding affinities (KD) and deep screening determined equilibrium binding constants (KDapp). Correlations are shown as Spearman’s rank correlation constant (rs) and p-values were determined by a two-tailed test. Linear regression was used to show a line of best fit. Source data
Extended Data Fig. 4
Extended Data Fig. 4. Architecture of BERT-DS.
Architecture of the BERT-DS model, showing the input embedding layer, 12 self-attention transformer blocks, the masked language modelling (MLM) output (dashed orange line) and classification output (dashed blue line) heads.
Extended Data Fig. 5
Extended Data Fig. 5. Ablation study of BERT-DS.
Ablation study F1 scores on predicting non-hits, low-hits, and high-hits from the ‘HER2Affmat’ dataset for BERT-DS (with and without pretraining on OAS), BERT-DS ablation models, a multi-layered perceptron (MLP) neural network, an MLP trained on a soft binary classification target, logistic regression, linear support vector machine and random forest models. We report F1 scores on the a) train and b) test set splits. Numerical values for F1, precision and recall for each model and train/test set can be found in Supplementary Tables 5–14.

References

    1. Winter G. Harnessing evolution to make medicines (Nobel lecture) Angew. Chem. Int. Edit. 2019;58:14438–14445. - PubMed
    1. Arnold FH. Innovation by evolution: bringing new chemistry to life (Nobel lecture) Angew. Chem. Int. Edit. 2019;58:14420–14426. - PubMed
    1. Wilson DS, Szostak JW. In vitro selection of functional nucleic acids. Annu. Rev. Biochem. 1999;68:611–647. - PubMed
    1. Hughes, R. A. & Ellington, A. D. Synthetic DNA synthesis and assembly: putting the synthetic in synthetic biology. Cold Spring Harb. Perspect. Biol.10.1101/cshperspect.a023812 (2022). - PMC - PubMed
    1. Rouet, R., Jackson, K. J. L., Langley, D. B. & Christ, D. Next-generation sequencing of antibody display repertoires. Front. Immunol.10.3389/fimmu.2018.00118 (2018). - PMC - PubMed