. 2024 Jan;5(1):85-99.
doi: 10.1038/s43018-023-00647-3. Epub 2023 Oct 9.

Targeting pancreatic cancer metabolic dependencies through glutamine antagonism

Affiliations

Targeting pancreatic cancer metabolic dependencies through glutamine antagonism

Joel Encarnación-Rosado et al. Nat Cancer. 2024 Jan.

Abstract

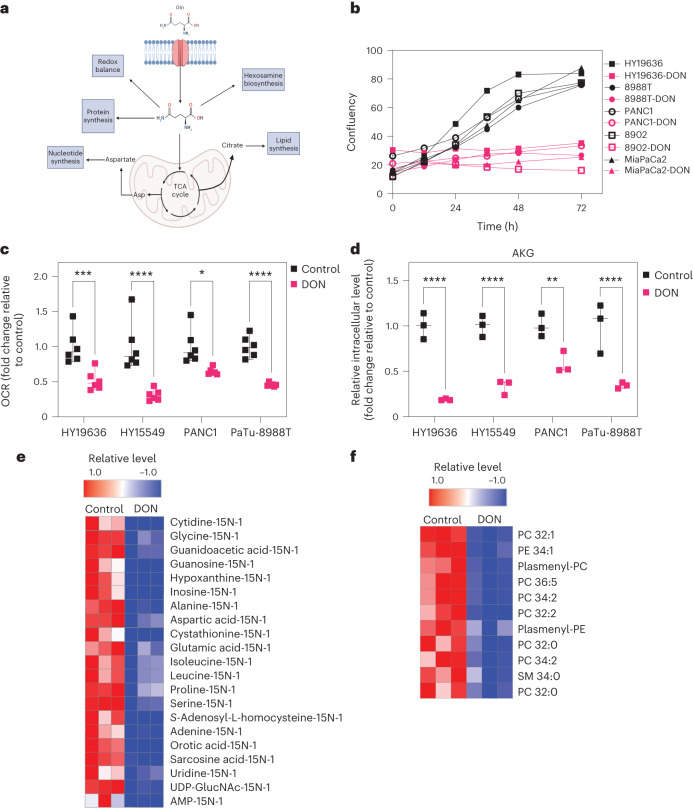
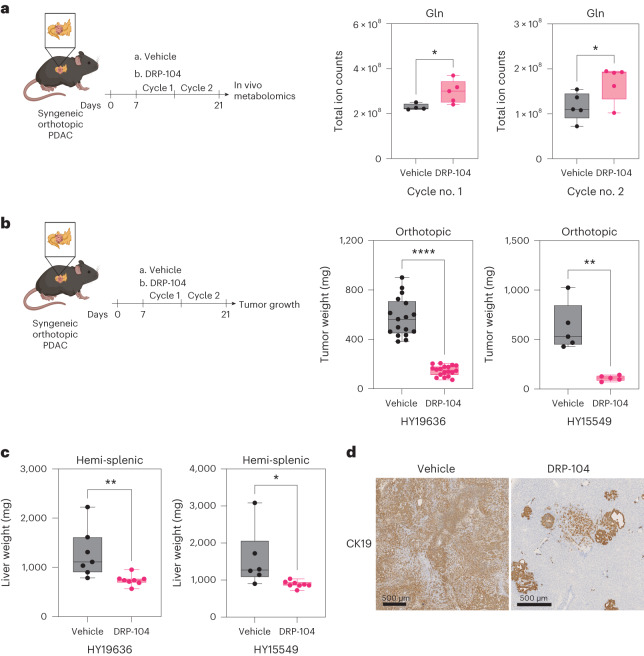
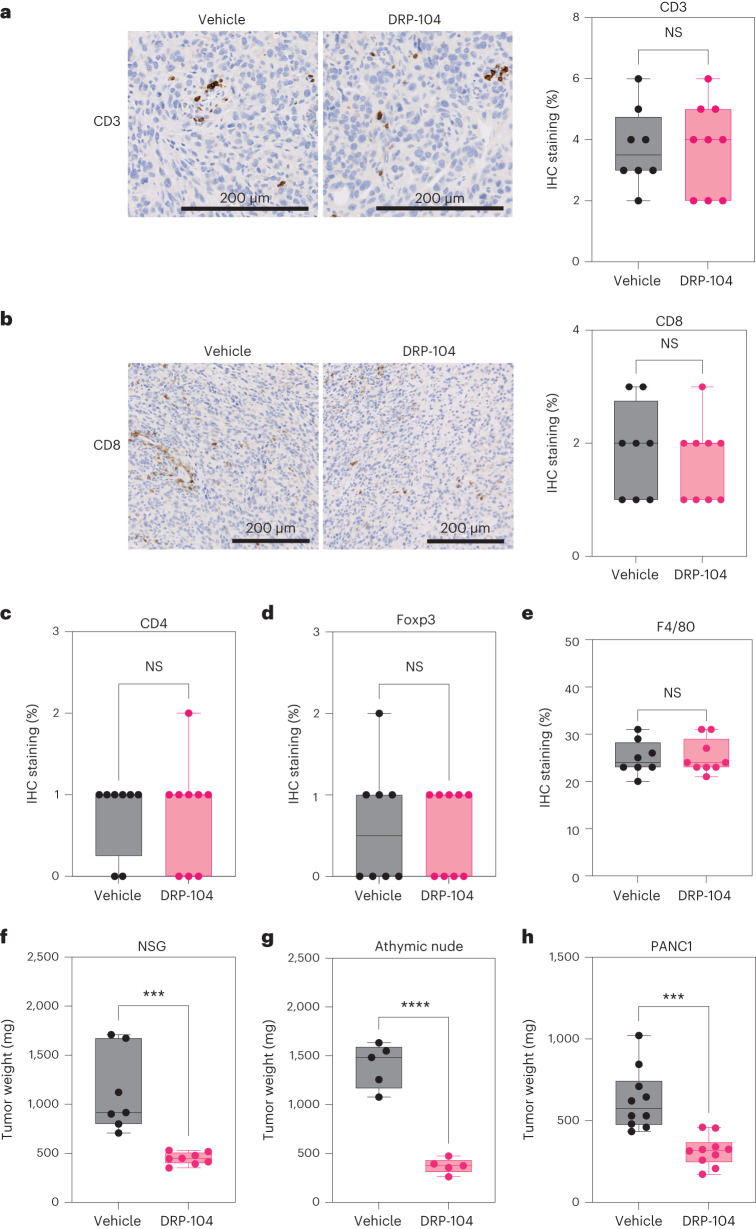
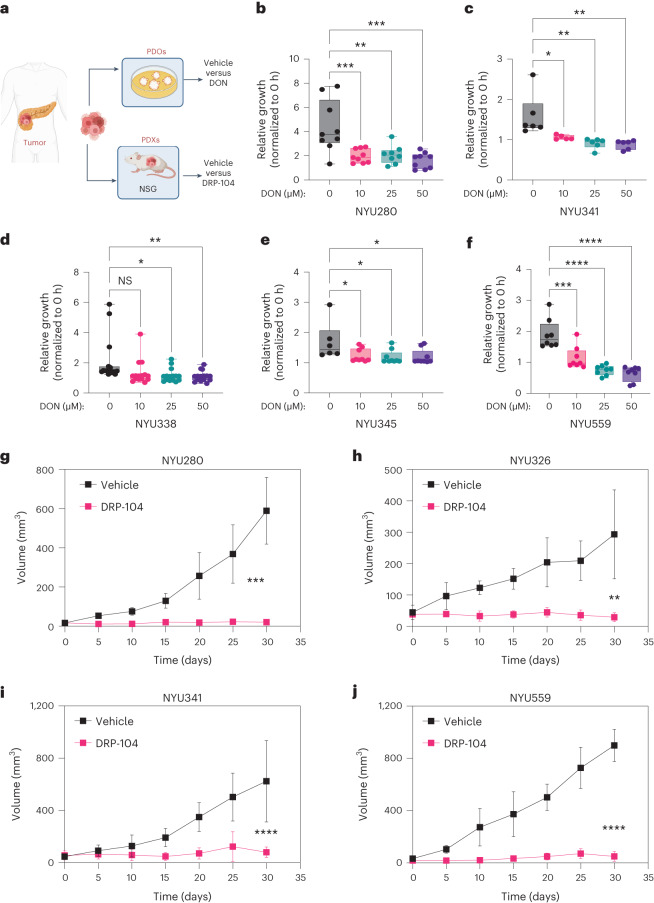
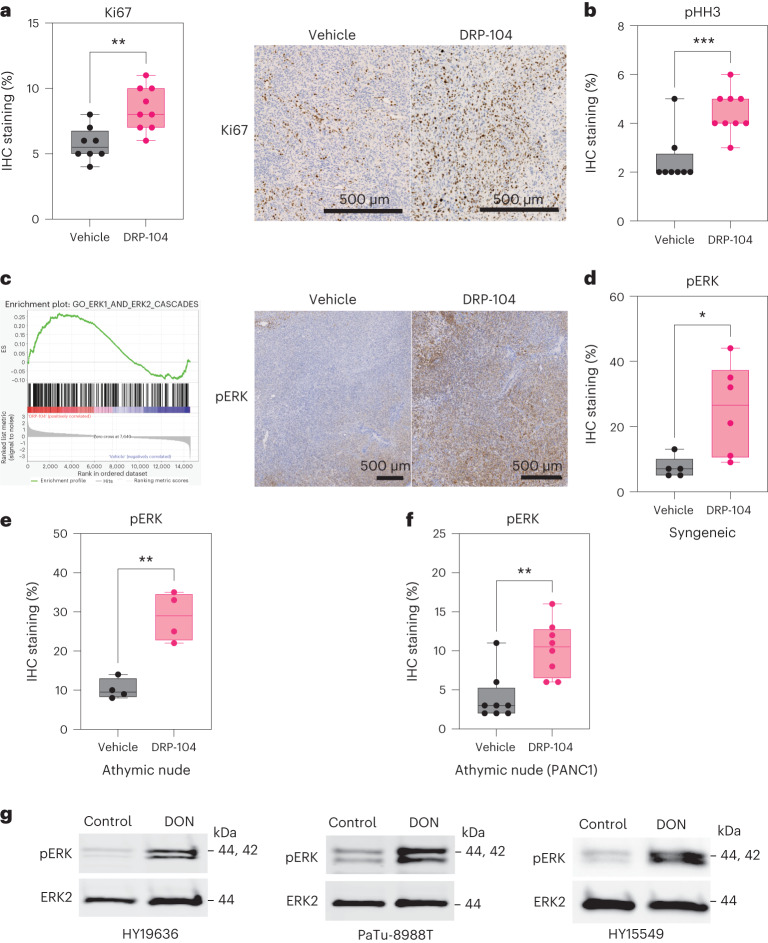
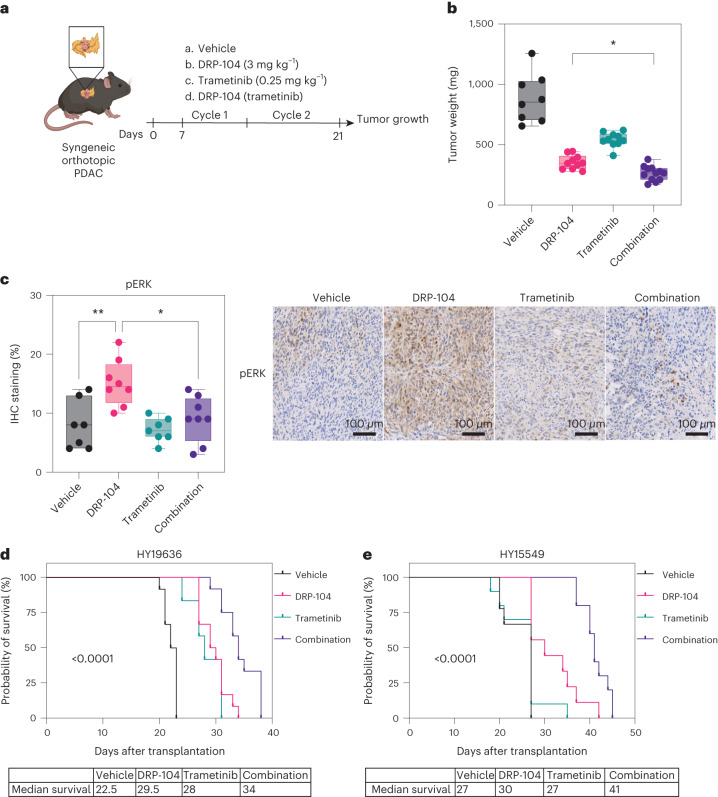
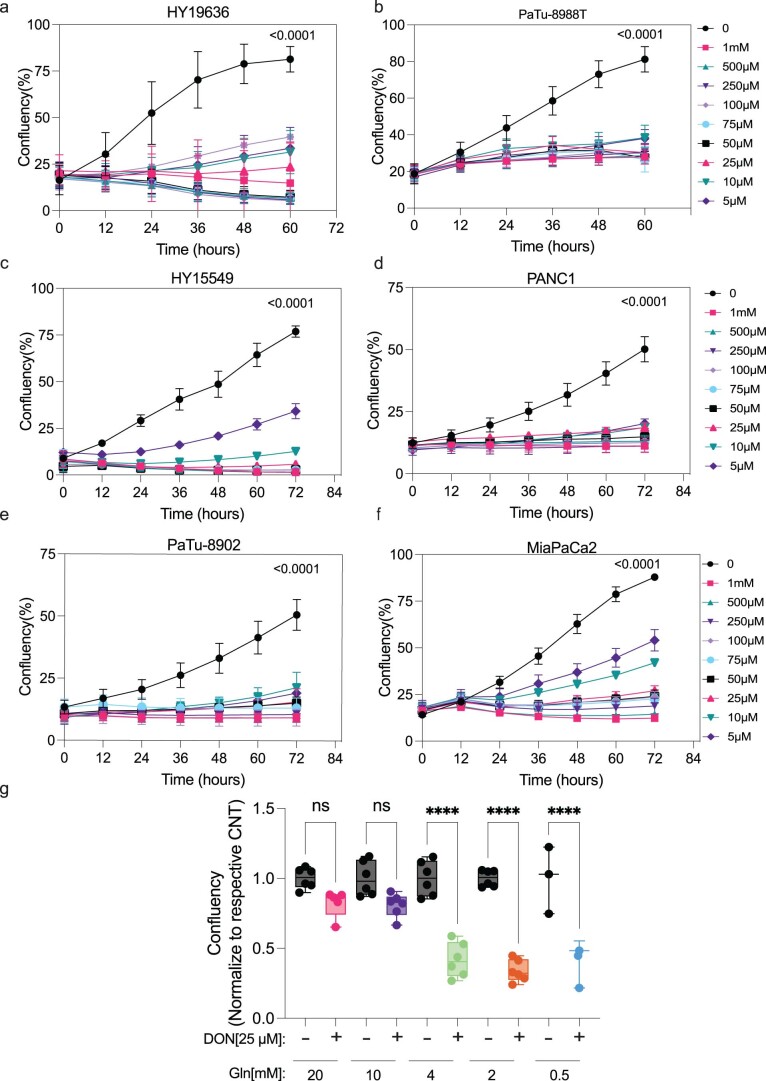
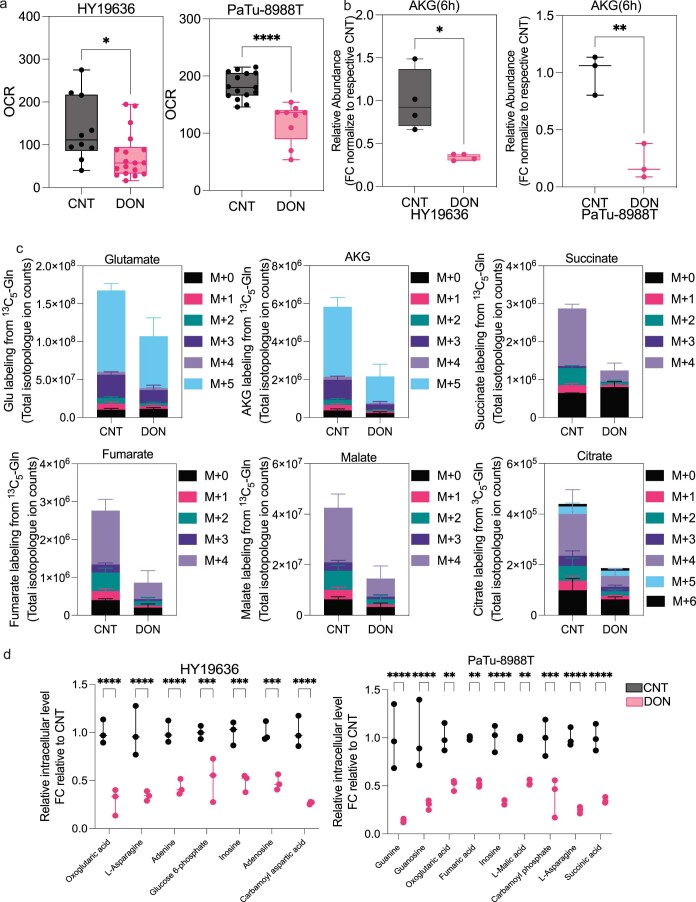
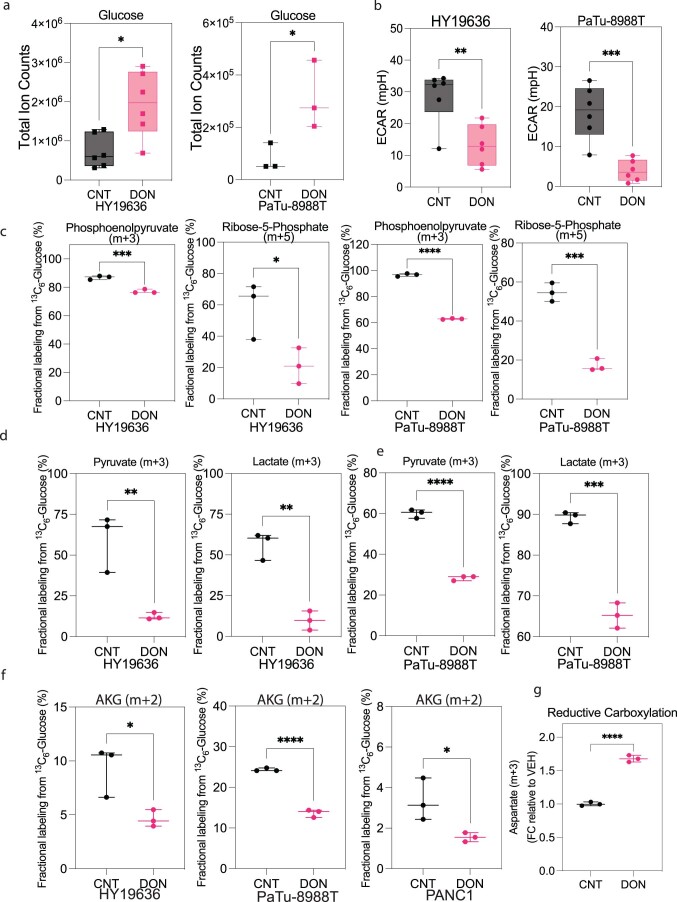
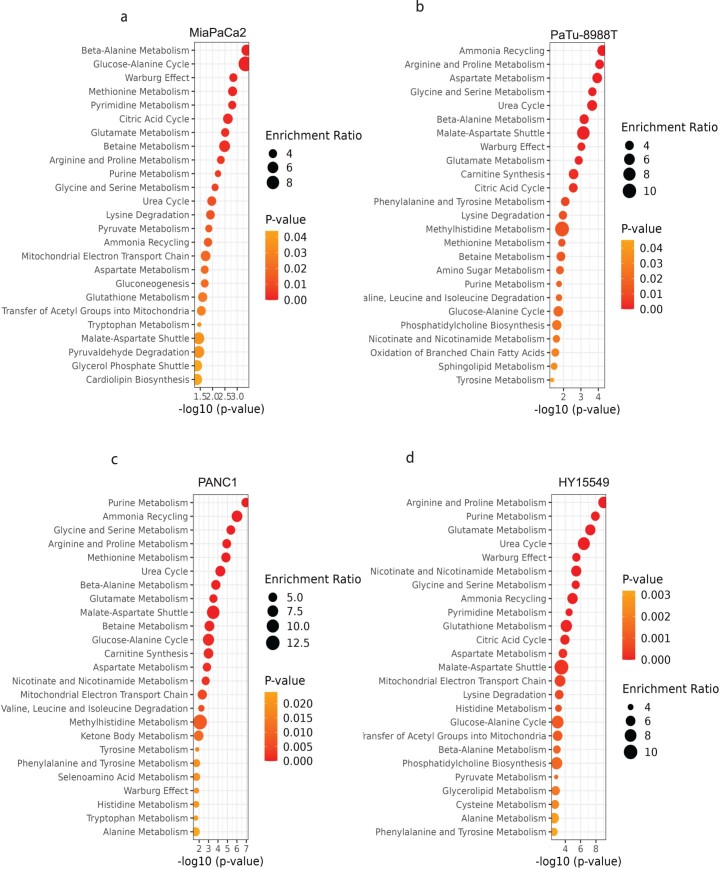
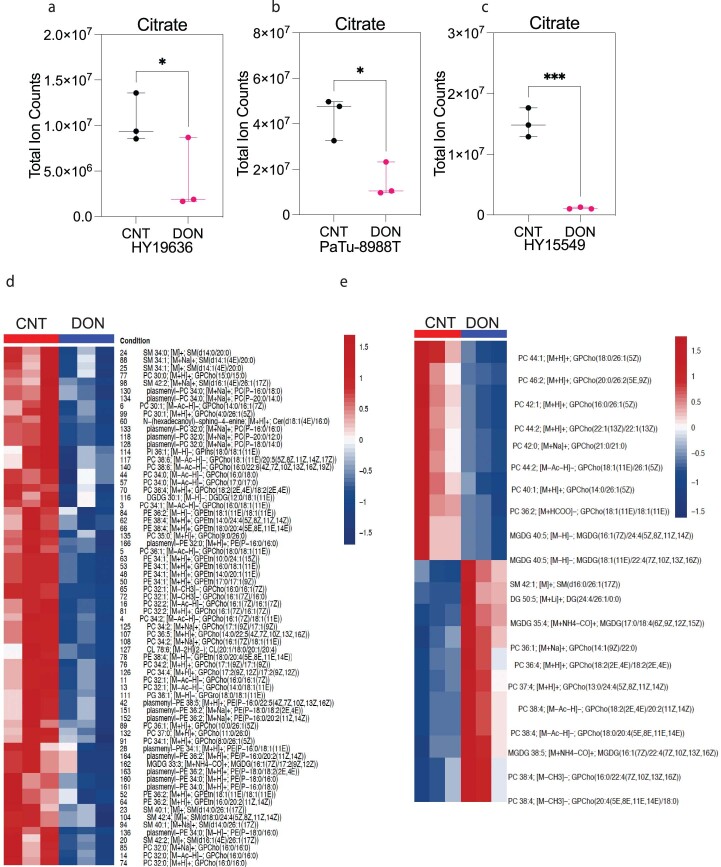
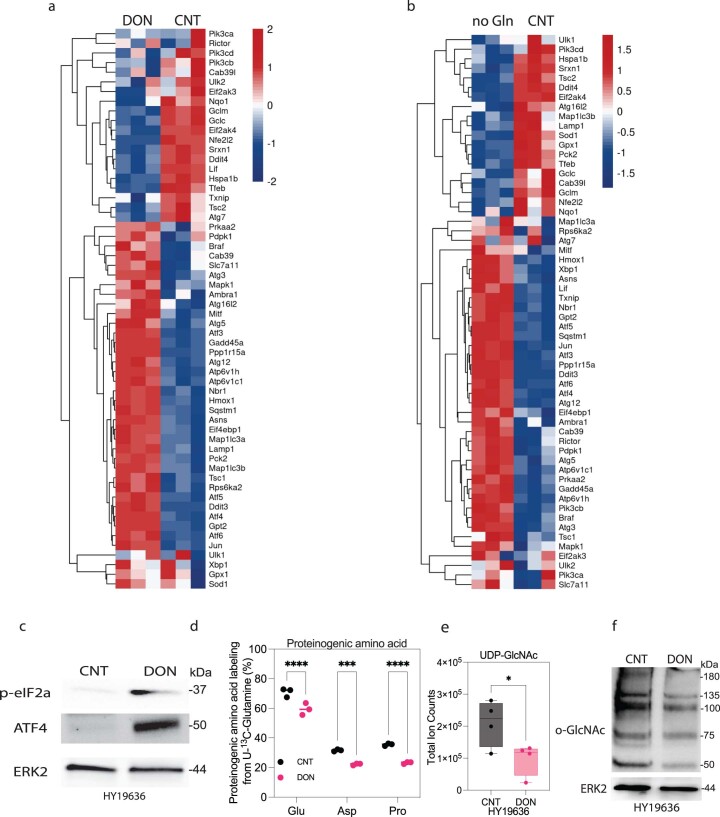
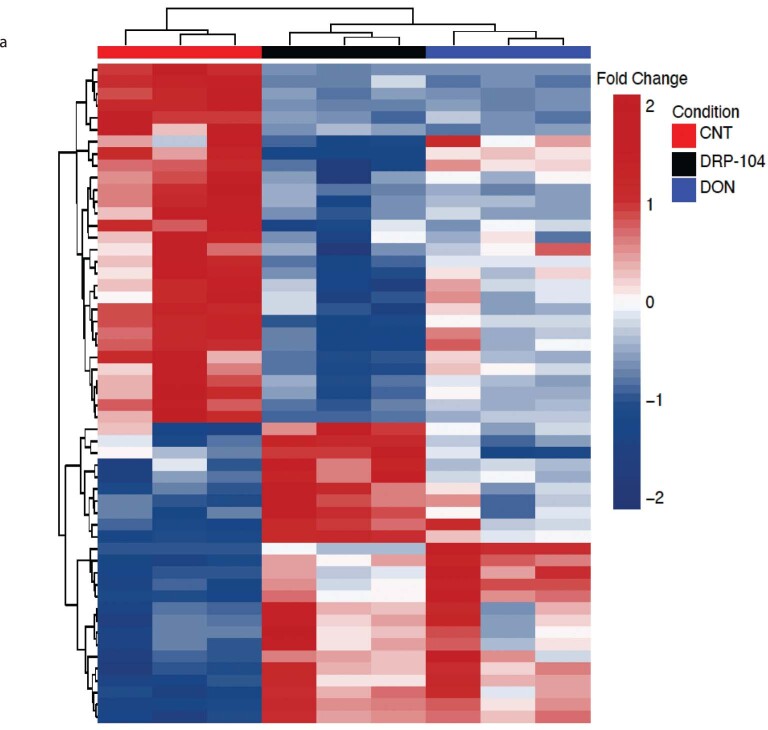
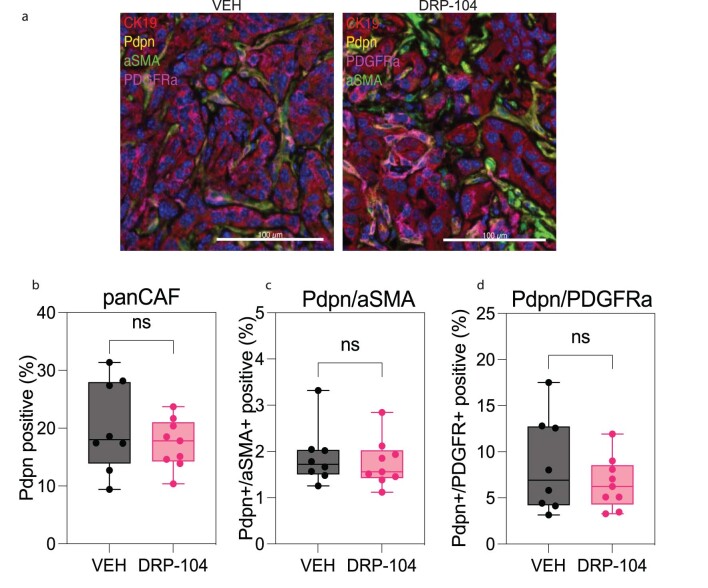
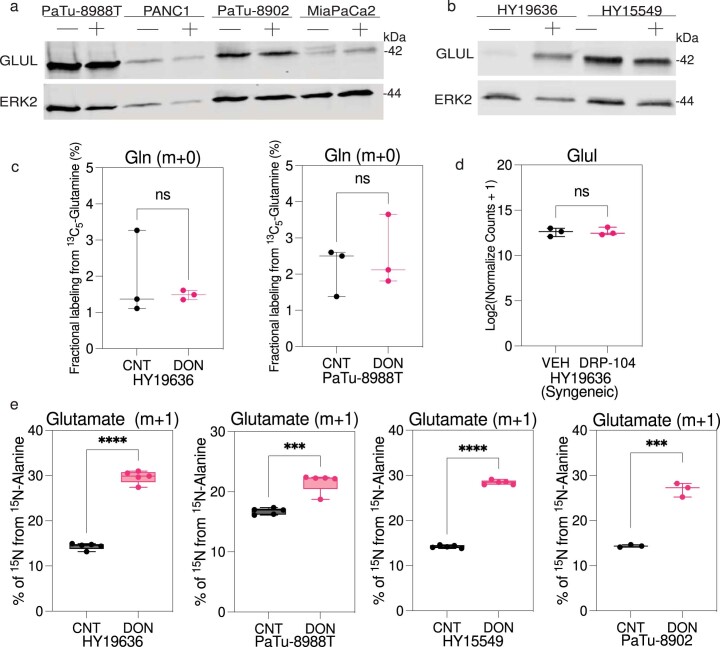
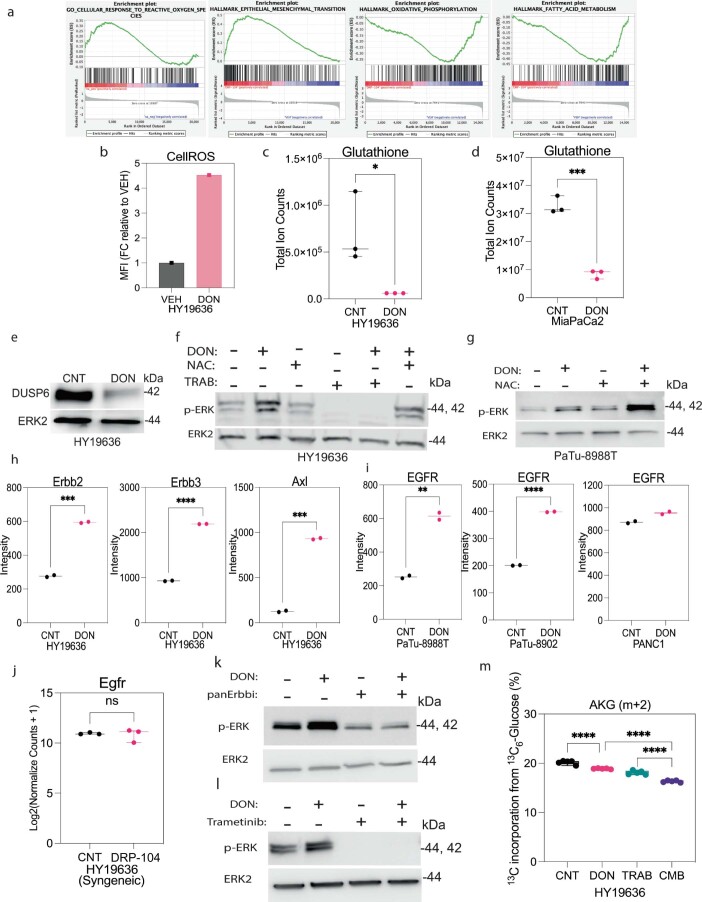
Pancreatic ductal adenocarcinoma (PDAC) cells use glutamine (Gln) to support proliferation and redox balance. Early attempts to inhibit Gln metabolism using glutaminase inhibitors resulted in rapid metabolic reprogramming and therapeutic resistance. Here, we demonstrated that treating PDAC cells with a Gln antagonist, 6-diazo-5-oxo-L-norleucine (DON), led to a metabolic crisis in vitro. In addition, we observed a profound decrease in tumor growth in several in vivo models using sirpiglenastat (DRP-104), a pro-drug version of DON that was designed to circumvent DON-associated toxicity. We found that extracellular signal-regulated kinase (ERK) signaling is increased as a compensatory mechanism. Combinatorial treatment with DRP-104 and trametinib led to a significant increase in survival in a syngeneic model of PDAC. These proof-of-concept studies suggested that broadly targeting Gln metabolism could provide a therapeutic avenue for PDAC. The combination with an ERK signaling pathway inhibitor could further improve the therapeutic outcome.

Trial registration: ClinicalTrials.gov NCT04471415.


Conflict of interest statement

A.C.K. has financial interests in Vescor Therapeutics and is an inventor on patents pertaining to KRAS-regulated metabolic pathways and redox control pathways in pancreatic cancer, targeting GOT1 as a therapeutic approach, targeting alanine transport, and the autophagic control of iron metabolism. A.C.K. is on the scientific advisory board of Rafael/Cornerstone Pharmaceuticals and OncoRev, and has been a consultant for Deciphera and Abbvie. R.W. and Y.Y. are employees and have an ownership interest in Dracen Pharmaceuticals. The other authors declare no competing interests.

Figures

Fig. 1
Fig. 1. DON creates a metabolic crisis in pancreatic cancer.
a, As Gln has pleiotropic roles in cellular metabolism, we hypothesized that using a broad-acting Gln antagonist, such as DON or DRP-104, could prevent the rapid metabolic adaptation seen in these tumors. Diagram created with Biorender.com. b, Panel of human and murine PDAC cell lines treated with DON (25 µM) for 72 h. Data are displayed as confluency. Data are displayed as the mean of n = 3 biological replicates per condition per cell line. c, Basal OCR was decreased in mouse (HY19636, HY15549) and human (PANC1, PaTu-8988T) PDAC cells on DON treatment. HY19636, ***P = 0.0003; HY15549, ****P < 0.0001; PANC1, *P = 0.0106; PaTu-8988T, ****P < 0.0001. Statistics were derived from n = 6 samples per condition from two independent experiments (three samples per experiment). Data are shown as the mean ± s.e.m. of n = 6 biological replicates per condition. Significance was determined using a two-way analysis of variance (ANOVA) using a Holm-Šídák’s multiple comparisons test. *P = 0.0106, ****P < 0.0001. d, Total pool size of intracellular AKG in PDAC cells in the presence or absence of DON (25 µM) in HY19636, HY15549, PANC1 and PaTu-8988T cells. Data were obtained using gas chromatography–mass spectrometry (GC–MS) and normalized to an internal standard (norvaline) and cell number. Statistics were derived from a representative experiment with n = 3 independent samples per condition. The GC–MS experiment was performed twice with similar results. Data are shown as the mean ± s.e.m. of n = 3 replicates. Significance was determined using a two-way ANOVA with a Holm-Šídák’s multiple comparisons test. **P = 0.0071, ****P < 0.0001. e, Isotopolog abundance in cells labeled with 15N-Gln after DON treatment in HY19636 cells. All the metabolites in this heatmap have a statistical significance of at least P < 0.05. Significance was determined using the Wald test (DESeq2) corrected for multiple comparisons. The columns are biological replicates in triplicate and the rows represent metabolites. Red indicates the maximum level (1.0) and blue is lower (−1.0) than the mean for each metabolite between control and DON treatment. f, Relative lipid levels in cells treated with DON after 24 h. All the lipids presented in this heatmap have a statistical significance of at least P < 0.005. Significance was determined using the Wald test corrected for multiple comparisons. Columns are biological replicates in triplicate; rows represent metabolites. Red indicates the maximum level (1.0); blue is lower (−1.0) relative to the mean for each metabolite between control and DON treatment. For the complete list of lipid species and full annotations, refer to the source data. Heatmaps generated with Morpheus. Source data
Fig. 2
Fig. 2. DRP-104 reduces tumor growth and liver colonization in syngeneic PDAC models.
a, In vivo measurement of Gln through liquid chromatography (LC)–MS in a DRP-104-treated syngeneic PDAC model. Data are presented as total ion counts and normalized to tumor weight and internal standards. Cycle no. 1: vehicle, n = 4 tumors from biologically independent mice; DRP-104, n = 5 tumors from biologically independent mice; P = 0.0370. Cycle no. 2: vehicle, n = 5; DRP-104, n = 5; P = 0.0483. Significance was determined using a two-tailed unpaired t-test. The box plots extend from the 25th to the 75th percentile. The whiskers represent the smallest to largest values. The line in the middle of the box represents the median. b, KPC-derived (HY19636 and HY15549) cells were injected into the pancreata of B6J mice. Mice were treated daily either with vehicle or DRP-104 (3 mg kg−1) intraperitoneally for two cycles (5 days on, 2 days off). Samples were collected 21 days after transplantation for downstream evaluations. For HY19636 cells, data were pooled from two independent experiments (vehicle, n = 17 tumors from biologically independent mice; DRP-104, n = 18 tumors from biologically independent mice; ****P < 0.0001. For HY15549: vehicle, n = 5 tumors from biologically independent mice; DRP-104, n = 5 tumors from biologically independent mice; **P = 0.0015. Significance was determined using a two-tailed unpaired t-test. The box plots extend from the 25th to the 75th percentile. The whiskers represent the smallest to largest values. The line in the middle of the box represents the median. c, Weight of the livers after treatment with vehicle or DRP-104 (3 m kg−1) in B6J mice. DRP-104 treatment started 3 days after the hemi-splenectomy. For HY19636 cells: vehicle, n = 7 from biologically independent mice; DRP-104, n = 8 from biologically independent mice; **P = 0.009. For HY15549 cells: vehicle, n = 6 from biologically independent mice; DRP-104, n = 8 from biologically independent mice; *P = 0.0314. Significance was determined using a two-tailed unpaired t-test. The box plots extend from the 25th to the 75th percentile. The whiskers represent the smallest to largest values. The line in the middle of the box represents the median. d, Representative images of liver metastasis (from biologically independent mice) visualized using CK19 staining. CK19 staining was performed in all the samples listed in Fig. 2c and showed similar results. Source data
Fig. 3
Fig. 3. The adaptive immune system is not required for DRP-104 antitumor properties in PDAC.
a,b, Representative images and quantification of CD3 (a) and CD8 (b) staining in DRP-104-treated and control tumors (HY19636) (vehicle, n = 8 tumors from biologically independent mice; DRP-104, n = 9 tumors from biologically independent mice). A two-tailed unpaired t-test showed no significance. CD3: P = 0.96; CD8: P = 0.58. IHC, immunohistochemistry. c, Quantification of CD4 levels in DRP-104-treated tumors (HY19636) (vehicle, n = 8 tumors from biologically independent mice; DRP-104, n = 9 tumors from biologically independent mice). A two-tailed unpaired t-test showed no significance (NS) (P = 0.92). d, Quantification of Foxp3 levels in DRP-104-treated tumors (HY19636) (vehicle, n = 8 tumors from biologically independent mice; DRP-104, n = 9 tumors from biologically independent mice). A two-tailed unpaired t-test showed no significance (P = 0.8257). e, Quantification of F4/80 levels in DRP-104-treated tumors (HY19636) (vehicle, n = 8 tumors from biologically independent mice; DRP-104, n = 9 tumors from biologically independent mice). A two-tailed unpaired t-test showed no significance (P = 0.90). f, KPC-derived (HY19636) cells were injected into the pancreata of NSG mice. Vehicle, n = 5 tumors from biologically independent mice; DRP-104, n = 5 tumors from biologically independent mice (***P = 0.0005). Significance was determined using a two-tailed unpaired t-test. g, KPC-derived (HY19636) cells were injected into the pancreata of athymic nude mice. Mice were treated daily either with vehicle or DRP-104 (3 mg kg−1) intraperitoneally for two cycles (5 days on, 2 days off). Samples were collected 21 days after transplantation for downstream evaluation. Vehicle, n = 5 tumors from biologically independent mice; DRP-104, n = 5 tumors from biologically independent mice. ****P < 0.0001. Significance was determined using a two-tailed unpaired t-test. h, PANC1 cells were injected into the pancreata of athymic nude mice. Treatment started 14 days after implantation. Samples were collected 21 days after transplantation for downstream evaluation. Vehicle, n = 10 tumors from biologically independent mice; DRP-104, n = 10 tumors from biologically independent mice. ***P = 0.0002. Significance was determined using a two-tailed unpaired t-test. In Fig. 3a–h, the box plots extend from the 25th to the 75th percentile. The whiskers represent the smallest to largest values. The line in the middle of the box represents the median. Source data
Fig. 4
Fig. 4. DON/DRP-104 diminishes proliferation in PDAC organoids and PDX models.
a, PDAC organoids and PDX models were generated from human pancreatic cancer samples. PDAC organoids were treated with DON at the indicated doses. b, NYU280 organoids were treated with increasing concentrations of DON (10 µM, 25 µM and 50 µM) for 7 days. Data were obtained from three independent experiments. ***P < 0.0007 (control versus 10 µM of DON); **P = 0.0016 (control versus 25 µM of DON); ***P < 0.0001 (control versus 50 µM of DON). c, NYU341 organoids were treated with increasing concentrations of DON (10 µM, 25 µM and 50 µM) for 7 days. Data were obtained from three independent experiments. *P = 0.0172 (control versus 10µM of DON); **P = 0.0017 (control versus 25 µM of DON); **P = 0.0011 (control versus 50 µM of DON). d, NYU338 organoids were treated with increasing concentrations of DON (10 µM, 25 µM and 50 µM) for 7 days. Data were obtained from three independent experiments. P = 0.0513 (not significant (NS)); *P = 0.0133; **P = 0.0081. e, NYU345 organoids were treated with increasing concentrations of DON (10 µM, 25 µM and 50 µM) for 7 days. Data were obtained from three independent experiments. *P = 0.036 (control versus 10 µM of DON); *P = 0.0202 (control versus 25 µM of DON); *P = 0.0214 (control versus 50 µM of DON). f, NYU559 organoids were treated with increasing concentrations of DON (10 µM, 25 µM and 50 µM) for 7 days. Data were obtained from three independent experiments. ***P = 0.0003 (control versus 10 µM of DON); ****P= 0.0001 (control versus 25µM of DON); ****P = 0.0001 (control versus 50 µM of DON). For all PDO studies, growth was measured as confluency over time and normalized to t = 0 h. Significance for Fig. 4a–f was determined using a one-way ANOVA with a Dunnett’s multiple comparisons test from at least n = 6 independent biological samples. PDX species were implanted subcutaneously in the flank of NSG mice. Mice were treated daily either with vehicle or DRP-104 (3 mg kg−1) intraperitoneally for four cycles (5 days on, 2 days off). g, NYU280: vehicle, n = 4; DRP-104, n = 5; ***P < 0.0001. h, NYU326: vehicle, n = 5; DRP-104, n = 4; **P = 0.008. i, NYU341: vehicle, n = 11; DRP-104, n = 11; ****P < 0.0001. j, NYU559: vehicle, n = 4; DRP-104, n = 4; ****P < 0.0001. For all PDX studies, tumors were measured every 5 days. In Fig. 4g–j, data were plotted as the geometric mean, s.e.m. and s.d. In Fig. 4g–j, all samples were tumors from biologically independent mice and significance was determined using a two-tailed unpaired t-test. Source data
Fig. 5
Fig. 5. MAPK signaling is activated by DRP-104 treatment as a resistance mechanism.
a, Quantification of Ki67 levels in DRP-104-treated tumors (HY19636). Vehicle, n = 8 tumors from biologically independent mice; DRP-104, n = 9 tumors from biologically independent mice; **P = 0.0021. b, Quantification of phospho-histone H3 (pHH3) levels in DRP-104-treated tumors (HY19636). Vehicle, n = 8 tumors from biologically independent mice; DRP-104, n = 9 tumors from biologically independent mice; ***P = 0.0009. Significance was determined using a two-tailed unpaired t-test. c, GSEA of transcripts between DRP-104-treated and control tumors demonstrated enrichment in the ERK1 and ERK2 cascades (GO:0070371). Enrichment score (ES) = 0.2; normalized ES = 1.25, false discovery rate q = 0.05. IHC analysis of phospho-ERK (pERK) in a representative PDAC tumor. For the bulk RNA-seq studies, three randomly selected tumors were used per group. d, Quantification of pERK in the syngeneic model with HY19636 cells. Vehicle, n = 5 tumors from biologically independent mice; DRP-104, n = 6 tumors from biologically independent mice; *P = 0.0214. Significance was determined using a two-tailed unpaired t-test. e, pERK levels in athymic nude mice with HY19636 cells. Vehicle, n = 4 tumors from biologically independent mice; DRP-104, n = 4 tumors from biologically independent mice; **P = 0.0016. Significance was determined using a two-tailed unpaired t-test. f, pERK levels in athymic nude mice with PANC1 cells. Vehicle, n = 8 tumors from biologically independent mice; DRP-104, n = 8 tumors from biologically independent mice; **P = 0.002. Significance was determined using a two-tailed unpaired t-test. g, Immunoblot of pERK and ERK2 (loading control) in HY19636, HY15549 and PaTu-8988T cells treated with DON (25 µM) for 24 h. Representative immunoblot of two independent experiments. Source data
Fig. 6
Fig. 6. DRP-104 and MAPK inhibition increase survival in a syngeneic PDAC model.
a, KPC-derived (HY19636) cells were injected into the pancreata of B6J mice. Mice were treated daily either with vehicle, DRP-104 (3 mg kg−1), trametinib (0.25 mg kg−1) or in combination (DRP-104 and trametinib) for two cycles (5 days on, 2 days off). Samples were collected 21 days after transplantation for downstream evaluation. b, Tumor weights at the end point. Vehicle, n = 8; DRP-104, n = 10; trametinib, n = 10; combination, n = 12. *P = 0.0444 (DRP-104 versus combination). Significance was determined using an ordinary one-way ANOVA with Holm-Šídák’s multiple comparisons test. c, Quantification of pERK levels in vehicle (n = 7), DRP-104 (n = 8), trametinib (n = 7) and combination (n = 8) treatment in B6J mice (HY19636). *P = 0.0116; **P = 0.0041. Significance was determined using an ordinary one-way ANOVA with Tukey multiple comparisons test. d,e, HY19636 (d) or HY15549 (e) cells were injected into the pancreata of B6J mice. Mice were treated daily either with vehicle (n = 12 biologically independent mice), DRP-104 (n = 12 biologically independent mice), trametinib (0.25 mg kg−1) (n = 12 biologically independent mice) or in combination (n = 12 biologically independent mice). Treatment continued until each mouse reached the end point criteria. A log-rank (Mantel–Cox) test indicated a P < 0.0001. Source data
Extended Data Fig. 1
Extended Data Fig. 1. DON inhibits cellular proliferation in a panel of PDAC lines.
Cell growth of human and murine pancreatic cancer cells (a) HY19636, (b) PaTu-8988T, (c)HY15549, (d)PANC1, (e)PaTu-8902 and (f)MiaPaCa2 exposed to DON for 72 hours at various concentrations ([DON, µM]: 500, 250, 100, 75, 50, 25, 10, and 5). Data plotted as confluency (geometric mean and error, n = 3). Significance was determined by two-way ANOVA using Dunnett’s multiple comparisons test. All the p values are included in the data source. (g) HY19636 cells were treated with DON (25 µM) for 7 days at various concentrations of glutamine (20 mM, n = 5; 10 mM, n = 6; 4 mM, n = 6; 2 mM, n = 6; 0.5 mM, n = 3). Representation of one representative experiment. Every condition was normalized to the control of each respective glutamine concentration. Data is displayed as mean ± s.e.m. The box plots extend from the 25th to 75th percentiles. The whiskers represent the smallest to largest values. The line in the middle of the box is plotted at the median. Significance was determined by ordinary one-way ANOVA using Tukey’s multiple comparisons test. P value: ****: <0.0001. All the p values are included in the data source. Source data
Extended Data Fig. 2
Extended Data Fig. 2. DON rapidly reduces TCA cycle metabolism in PDAC.
(a) Basal oxygen consumption rate is decreased in HY19636 and PaTu-8988T after 6 hours of DON treatment (25 µM). For HY19636, VEH, n = 10; DON, n = 18; P Value: **: 0.0056. For PaTu-8988T, VEH, n = 15; DRP-104, n = 9. P value: ****:0.0001 Significance was determined using unpaired t-test (two-tailed). The box plots extend from the 25th to 75th percentiles. The whiskers represent the smallest to largest values. The line in the middle of the box is plotted at the median. (b) Total ion counts of alpha-ketoglutarate (AKG) in HY19636 and PaTu-8988T after 6 hours treatment of DON (25 µM). Data relative to control and internal standard (norvaline). For HY19636, VEH, n = 4; DON, n = 4; P value: 0.0104 (*). Data displayed as mean ± s.e.m of n = 4. For PaTu-8988T, VEH, n = 3; DON, n = 3; P value: 0.0041 (**). Data displayed as mean ± s.e.m of n = 3. Significance was determined by unpaired t-test (two-tailed). The box plots extend from the 25th to 75th percentiles. The whiskers represent the smallest to largest values. The line in the middle of the box is plotted at the median. (c) Total ion counts of isotopologues of U-13C-Glutamine labeling of the indicated metabolites in HY19636 cells. VEH, n = 3; DRP-104, n = 3. Data displayed as mean ± s.e.m. Significance was determined by one-way ANOVA using Tukey’s multiple comparisons test. All the statistical test and values are included in the data source. (d) Relative abundance of metabolites in central carbon metabolism, TCA cycle, and nucleotide metabolism after DON treatment in HY19636 and PaTu-8988T. Data was obtained through LCMS and represented as fold change relative to control. VEH, n = 3; DRP-104, n = 3. Data displayed as mean ± s.e.m. Significance was determined by ordinary two-way ANOVA using Šídák’s multiple comparisons test multiple comparisons test. All the statistical test and values are included in the data source. All the statistical test and values are included in the data source. Source data
Extended Data Fig. 3
Extended Data Fig. 3. DON impairs glucose metabolism in PDAC.
(a) Total ion counts of intracellular D-Glucose in PDAC cells in the presence or absence of DON (25 µM, 24 hours) (HY19636 and PaTu-8988T). For HY19636, VEH, n = 6; DRP-104, n = 6; P value: 0.0101 (*). For PaTu-8988T, VEH, n = 3; DRP-104, n = 3; P value: 0.0463 (*). Data was obtained through LC-MS and normalized to cell number. Data displayed as mean ± s.e.m. and significance were determined was unpaired t-test two-tailed. (b) Extracellular acidification rate (ECAR) is decreased in HY19636 and PaTu-8988T after 24 hours of treatment of DON (25 µM). For HY19636, VEH, n = 6; DRP-104, n = 6; P value: 0.005 (**). For PaTu-8988T, VEH, n = 6; DRP-104, n = 6; P value: 0.0006 (**). Significance was determined by unpaired t-test (two-tailed). (c) Fractional labeling from U-13C6-Glucose of phosphoenolpyruvate (m + 3) and ribose-5-phosphate (m + 5) after DON treatment (25 µM) in HY19636 and PaTu-8988T. For HY19636, VEH, n = 3; DRP-104, n = 3; P values: 0.0009 (***); 0.0384 (*). For PaTu-8988T, VEH, n = 3; DRP-104, n = 3; P values: <0.0001 (****); 0.0003 (***). Data was obtained through LCMS and plotted as percentage. Data displayed as mean ± s.e.m and significance were determined was unpaired t-test (two-tailed). The box plots extend from the 25th to 75th percentiles. The whiskers represent the smallest to largest values. The line in the middle of the box is plotted at the median. (d) Contribution of U-13C6-Glucose to pyruvate and lactate after DON (25 µM, 24 hours) treatment in HY19636, VEH, n = 3; DRP-104, n = 3; P value:0.01 (**), 0.0014 (**) and (e) PaTu-8988T, VEH, n = 3; DRP-104, n = 3; P value: <0.0001 (****), 0.003 (***). Data was obtained through LCMS and plotted as a percentage. Data displayed as mean ± s.e.m. and significance were determined was unpaired t-test (two-tailed). (f) Fractional labeling of αKG in cells labeled with [U-13C6]-Glucose of cells after DON treatment in HY19636, PaTu-8988T and PANC1 cells. For all cell lines, VEH, n = 3, DRP-104, n = 3. P values: 0.0296(*); < 0.0001 (****); 0.043 (*) Data was obtained through LCMS and plotted as a percentage. Data displayed as mean ± s.e.m. and significance were determined was unpaired t-test (two-tailed). (g) Relative levels of Aspartate (m + 3) derived from [U-13C5]-Glutamine after DON treatment in PaTu-8988T, suggesting that TCA is been reductive instead of oxidative as observed by the odd numbers of labeled carbons. Data was collected through GC-MS, the percentage of incorporation was normalized to control. Data displayed as mean ± s.e.m. and significance were determined was unpaired t-test (two-tailed). Source data
Extended Data Fig. 4
Extended Data Fig. 4. DON treatment globally disrupted central carbon and nucleotide metabolism.
Metabolite Set Enrichment Analysis of various PDAC lines (a) MiaPaCa2, (b)PaTu-8988T, (c)PANC1, and (d)HY15549. Values were obtained from LCMS analysis, treated with DON (25 µM, 24 hours). The input for Metabolite Set Enrichment Analysis were based on P Value < 0.05. Significance was determined using the Wald test (DESeq2) corrected for multiple comparisons. All values are available in the source data. Source data
Extended Data Fig. 5
Extended Data Fig. 5. DON treatment globally disrupts lipid metabolism.
(a)Total ion counts of citrate in HY19636 cells treated with DON (25 µM) for 24 hours. VEH, n = 3; DRP-104, n = 3; P value: 0.0413 (*). Data obtained through GCMS normalized to internal standard (norvaline) and cell counts. Data displayed as mean ± s.e.m. and significance were determined using unpaired t-test (two-tailed). (b)Total ion counts of citrate in PaTu-8988T cells treated with DON (25 µM) for 24 hours. VEH, n = 3; DRP-104, n = 3; P value: 0.0143 (*). Data obtained through GCMS normalized to internal standard (norvaline) and cell counts. Data displayed as mean ± s.e.m and significance were determined using unpaired t-test two-tailed. (c)Total ion counts of citrate in HY15549 cells treated with DON (25 µM) for 24 hours. VEH, n = 3; DRP-104, n = 3; P value: 0.0005 (***) Data obtained through GCMS normalized to internal standards and cell counts. Data displayed as mean ± s.e.m. and significance were determined using unpaired t-test two-tailed. (d) HY15549 and (e)PaTu-8988T cells were treated with DON for 24 hours. For both cell lines, VEH, n = 3; DRP-104, n = 3. LCMS was performed after scaling the lipid extraction to a measured aliquot ( ~ 5e6/mL) for each of the samples. Lipid peak intensities were extracted according to a library of m/z values and retention times developed with standards. LipidBLAST was used to identify lipid species and features. Heatmap was generated by using the significant metabolites (p < 0.05). Significance was determined using the Wald test (DESeq2) corrected for multiple comparisons. Complete dataset and statistics are available in the source data. Source data
Extended Data Fig. 6
Extended Data Fig. 6. Stress-related pathways are activated upon DON treatment.
(a) Bulk RNAseq demonstrated increased expression of genes in various stress-related pathways after 24 hours of DON treatment (25 µM) in HY19636 cells. (b) Bulk RNAseq demonstrated increased expression of genes in various stress-related pathways after 24 hours of glutamine deprivation in HY19636 cells. (c) Immunoblot of p-eIF2α, ATF4 and ERK2 in DON-treated cells (25 µM) (HY19636). The image is representative of two independent experiments. (d) Percentage of contribution of [U-13C5]-Glutamine to proteinogenic amino acids (for example, glutamate, aspartate, and proline) in DON-treated cells (HY19636) for 24 hours. VEH, n = 3; DRP-104, n = 3. P values: <0.0001(****); 0.0004 (***); < 0.0001(****). Data was obtained through GCMS and represented as percentages. Data displayed as mean ± s.e.m. and significance were determined using ordinary one-way ANOVA using Šídák’s multiple comparisons test. (e) Total levels of UDP-GlcNAc detected via LC-MS in DON-treated cells (25 µM). VEH, N = 4; DRP-104, n = 4. P value: 0.0434 (*).Total ion counts were normalized to cell number (HY19636). Data displayed as mean ± s.e.m. and significance were determined was unpaired t-test (two-tailed). The box plots extend from the 25th to 75th percentiles. The whiskers represent the smallest to largest values. The line in the middle of the box is plotted at the median. (f) Immunoblot of O-GlcNAc and ERK2 (loading control) in DON-treated (25 µM) cells (HY19636). The image is representative of two independent experiments. Source data
Extended Data Fig. 7
Extended Data Fig. 7. DRP-104 creates a metabolic crisis in PDAC similar to DON.
HY19636 were treated with DRP-104 (25 µM) and DON (25 µM) for 24 hours. (a)Heatmap was generated by unsupervised clustering using the significant metabolites (p-value < 0.05) from the comparison of CNT vs DON and CNT vs DRP-104. Significance was determined using the Wald test (DESeq2) corrected for multiple comparisons. Source data
Extended Data Fig. 8
Extended Data Fig. 8. Assessment of cancer-associated fibroblasts upon DRP-104.
a) Representative multispectral imaging of PDAC cell lines (CK19-, red), panCAFs (Pdpn, yellow), aSMA (green), PDGFR (magenta) in DRP-104 treated (n = 9) and VEH (n = 8) tumors. (b) Quantification of pan-CAF (Pdpn-positive) abundance in DRP-104 treated and control tumors. VEH, n = 8; DRP-104, n = 9. Unpaired t-test (two-tailed) showed no significance P value: 0.3411. The box plots extend from the 25th to 75th percentiles. The whiskers represent the smallest to largest values. The line in the middle of the box is plotted at the median. (c) Quantification of Pdpn-positive, aSMA-positive populations in DRP-104 treated and VEH tumors. VEH, n = 8; DRP-104, n = 9. Unpaired t-test (two-tailed) showed no significance P value: 0.6294. The box plots extend from the 25th to 75th percentiles. The whiskers represent the smallest to largest values. The line in the middle of the box is plotted at the median. (d) Quantification of Pdpn-positive, PDGFR-positive populations in DRP-104 treated and VEH tumors. VEH, n = 8; DRP-104, n = 9. Unpaired t-test (two-tailed) showed no significance P value: 0.3358. The box plots extend from the 25th to 75th percentiles. The whiskers represent the smallest to largest values. The line in the middle of the box is plotted at the median. Source data
Extended Data Fig. 9
Extended Data Fig. 9. Alanine supports metabolism in DON-treated cells.
(a) Immunoblot analysis for GLUL and ERK2 (loading control) in PaTu-8988T, PANC1, PaTu-8902 and MiaPaCa2 cells treated with DON (25 µM) for 72 hours. The image is representative of two independent experiments. (b)Immunoblot analysis for GLUL and ERK2 (loading control) in HY19636 and HY15549 cells treated with DON (25 µM) for 72 hours. The image is representative of two independent experiments. (c) HY19636 and PaTu-8988T cells were treated with DON (25 µM) for 72 hours. Then, cells were exposed to U-13C5-Glutamine for 24 hours. Data plotted as percentage of m + 0 (unlabeled) fraction. VEH, n = 3; DON, n = 3. Data displayed as mean ± s.e.m. Unpaired t-test (two-tailed) showed no significance P value: 0.5613 (HY19636) and 0.6234 (PaTu-8988T). (d) GLUL expression upon DRP-104 treatment in syngeneic tumors (HY19636) at endpoint. Data obtained from bulkRNA-seq studies. Unpaired t-test (two-tailed) showed no significance P value: 0.9019. (e) Percentage of incorporation of 15N-Alanine into glutamate after DON treatment in HY19636, PaTu-8988T, HY15549 and PaTu-8902 cells (25 µM, 24 hours). For HY1936, VEH, n = 5; DON, n = 5. P value: <0.0001 (****). For PaTu-8988T, VEH, n = 5; DON, n = 5. P value: 0.0002 (***); For HY15549, VEH, n = 5; DON, n = 5. P value: <0.0001 (****). For PaTu-8902, VEH, n = 3; DON, n = 3. P value: 0.0001 (***). Data displayed as mean ± s.e.m. and significance were determined was unpaired t-test (two-tailed). Source data
Extended Data Fig. 10
Extended Data Fig. 10. Multiple inputs can lead to MAPK activation in response to DON treatment.
(a) Gene set enrichment analysis (GSEA) of transcripts between DRP-104 treated and control tumors demonstrated enrichment in ROS, EMT, OXPHOS, fatty acid Metabolism. (b) Mean Fluorescent Intensity (MFI) of CellROS in DON versus control cells measured by FACS in HY19636 cells. (c) Total levels of glutathione detected via LC-MS in DON-treated cells in HY19636. Total abundance was represented as fold change relative to control. VEH, n = 3; DRP-104, n = 3. P value: 0.0413 (*).Data displayed as mean ± s.e.m. and significance were determined was unpaired t-test two-tailed. (d) Total levels of glutathione detected via LC-MS in DON-treated cells in MiaPaCa2. Total abundance was represented as fold change relative to control. VEH, n = 3; DRP-104, n = 3. P value: 0.0002 (***). Data displayed as mean ± s.e.m. and significance were determined was unpaired t-test two-tailed. (e) Immunoblot of DUSP6 and ERK2 (loading control) in DON-treated cells in HY19636 cells. The image is representative of three independent experiments. (f) Immunoblot of p-ERK and ERK2 (loading control) in cells treated with DON, NAC (10 mM), trametinib or the combination for 24 hours in HY19636 cells. The image is representative of three independent experiments. (g) Immunoblot of p-ERK and ERK2 (loading control) in cells treated with DON, NAC (10 mM), or the combination for 24 hours in PaTu-8988T cells. The image is representative of three independent experiments. (h) Quantification of phospho-RTK array in HY19636 cells upon DON treatment (25 µM, 72 hours). Data were quantified by ImageJ. VEH, n = 2; DON, n = 2. P value for Erbb2 0.0004 (***); P value for Erbb3 < 0.0001 (****); P value for Axl 0.0002 (***). Representative experiment. Experiment was repeated two times with similar results. Data displayed as mean ± s.e.m. and significance were determined was unpaired t-test two-tailed. (i) Quantification of phospho-RTK array (EGFR) in PaTu-8988T, PATu-8902 and PANC1 cells upon DON treatment (25 µM, 72 hours). Data were quantified by ImageJ. VEH, n = 2; DON, n = 2. P value for PaTu-8988T: 0.0038 (**). P value for PaTu-8902: <0.0001 ****. P value for PANC1: 0.002. Representative experiment. Experiment was repeated two times with similar results. Data displayed as mean ± s.e.m. and significance were determined was unpaired t-test two-tailed. (j) Relative mRNA levels of Egfr in DRP-104 treated tumors. VEH, n = 3; DRP-104, n = 3. P value: 0.7406 (ns). Data displayed as mean ± s.e.m. and significance were determined was unpaired t-test two-tailed. (k) Immunoblot of p-ERK and ERK2 (loading control) in cells treated with DON, pan-RTK inhibitor or the combination for 24 hours. The image is representative of two independent experiments. (l) Immunoblot of p-ERK and ERK2 (loading control) in cells treated with DON, trametinib or the combination for 24 hours. The image is representative of three independent experiments. (m) Percentage of incorporation of 13C6-Glucose to alpha-ketoglutarate (AKG) (m + 2) in cells pre-treated with trametinib with or without DON for 24 hours in HY19636.VEH, n = 6; DON, n = 6. P values: <0.0001 (****); 0.0031(**). Data displayed as mean ± s.e.m. and significance determined by ordinary one-way ANOVA using Tukey’s multiple comparisons test. The box plots extend from the 25th to 75th percentiles. The whiskers represent the smallest to largest values. The line in the middle of the box is plotted at the median. Source data

References

    1. Siegel RL, Miller KD, Fuchs HE, Jemal A. Cancer statistics, 2022. CA Cancer J. Clin. 2022;72:7–33. doi: 10.3322/caac.21708. - DOI - PubMed
    1. Halbrook CJ, Lyssiotis CA, Pasca di Magliano M, Maitra A. Pancreatic cancer: advances and challenges. Cell. 2023;186:1729–1754. doi: 10.1016/j.cell.2023.02.014. - DOI - PMC - PubMed
    1. Hosein AN, Brekken RA, Maitra A. Pancreatic cancer stroma: an update on therapeutic targeting strategies. Nat. Rev. Gastroenterol. Hepatol. 2020;17:487–505. doi: 10.1038/s41575-020-0300-1. - DOI - PMC - PubMed
    1. Ho WJ, Jaffee EM, Zheng L. The tumour microenvironment in pancreatic cancer—clinical challenges and opportunities. Nat. Rev. Clin. Oncol. 2020;17:527–540. doi: 10.1038/s41571-020-0363-5. - DOI - PMC - PubMed
    1. Encarnación-Rosado J, Kimmelman AC. Harnessing metabolic dependencies in pancreatic cancers. Nat. Rev. Gastroenterol. Hepatol. 2021;18:482–492. doi: 10.1038/s41575-021-00431-7. - DOI - PMC - PubMed

Publication types

MeSH terms

Associated data

LinkOut - more resources