. 2024 Jan;5(1):100-113.
doi: 10.1038/s43018-023-00649-1. Epub 2023 Oct 9.

Glutamine mimicry suppresses tumor progression through asparagine metabolism in pancreatic ductal adenocarcinoma

Affiliations

Glutamine mimicry suppresses tumor progression through asparagine metabolism in pancreatic ductal adenocarcinoma

Maria Victoria Recouvreux et al. Nat Cancer. 2024 Jan.

Abstract

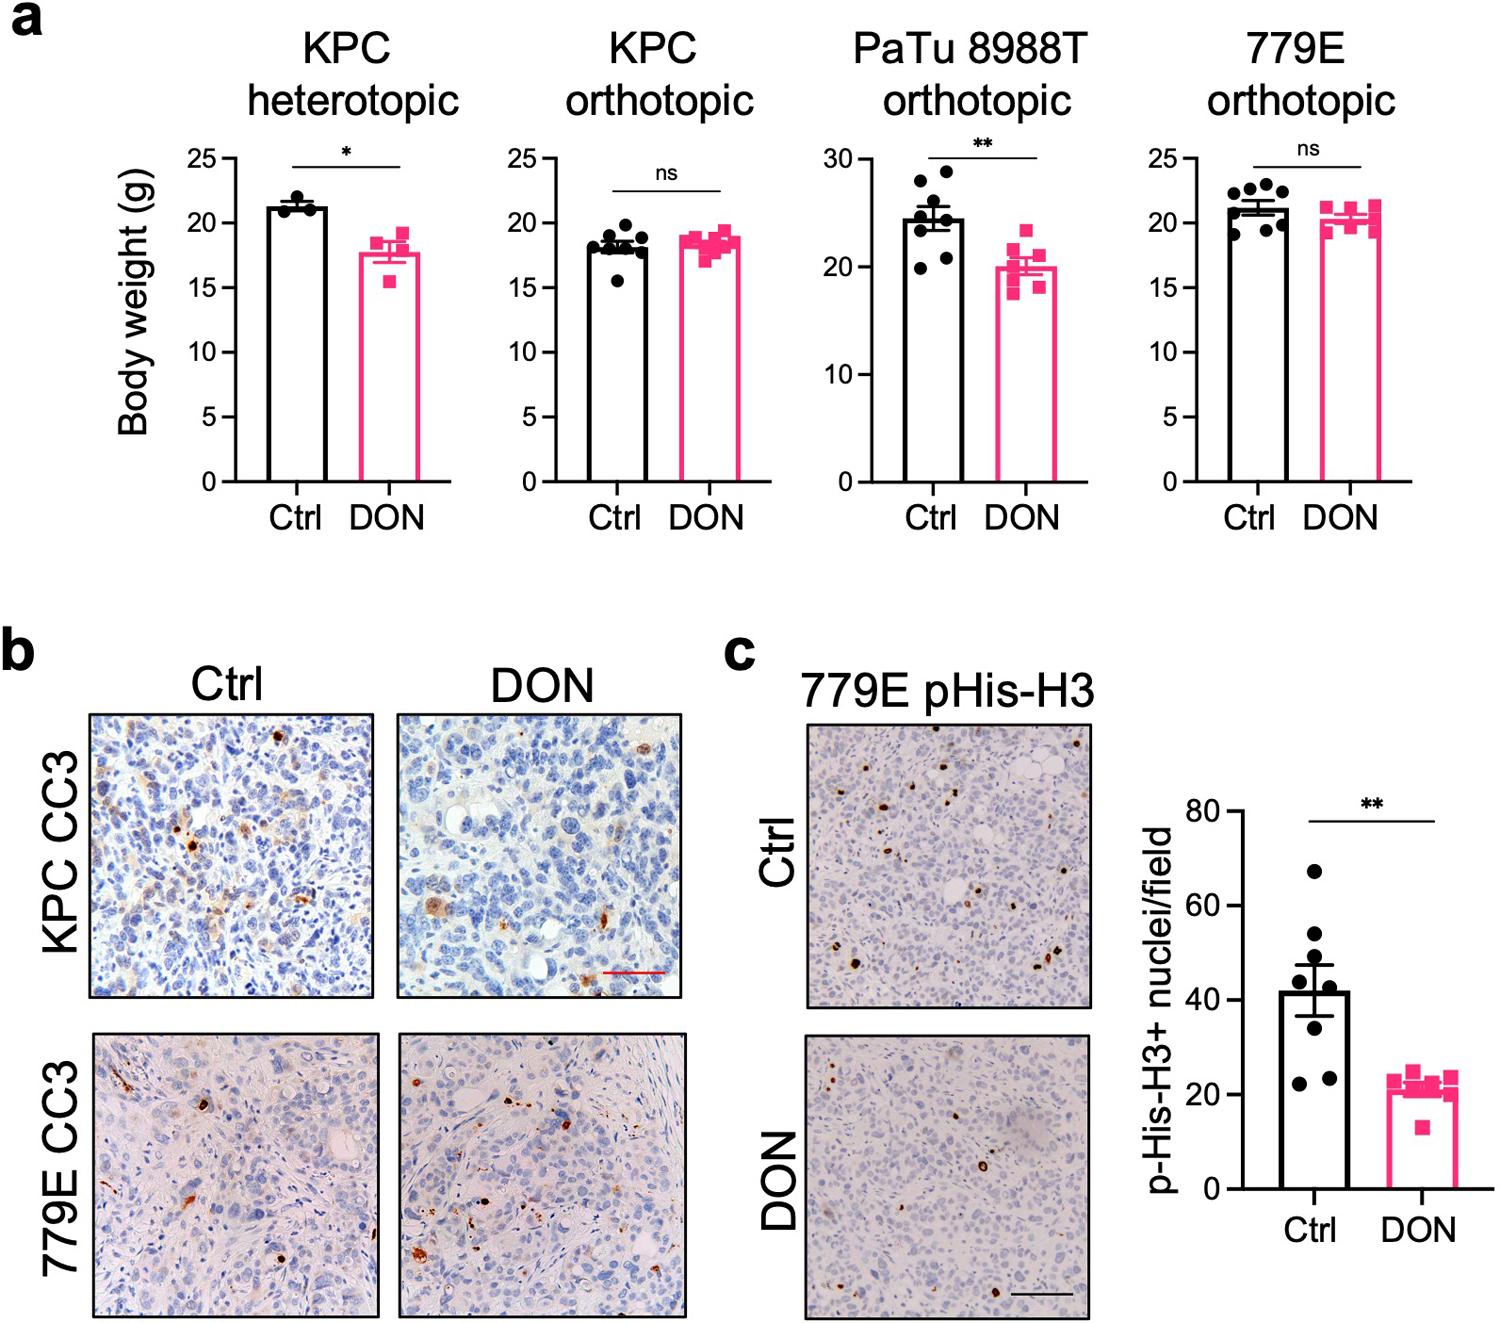
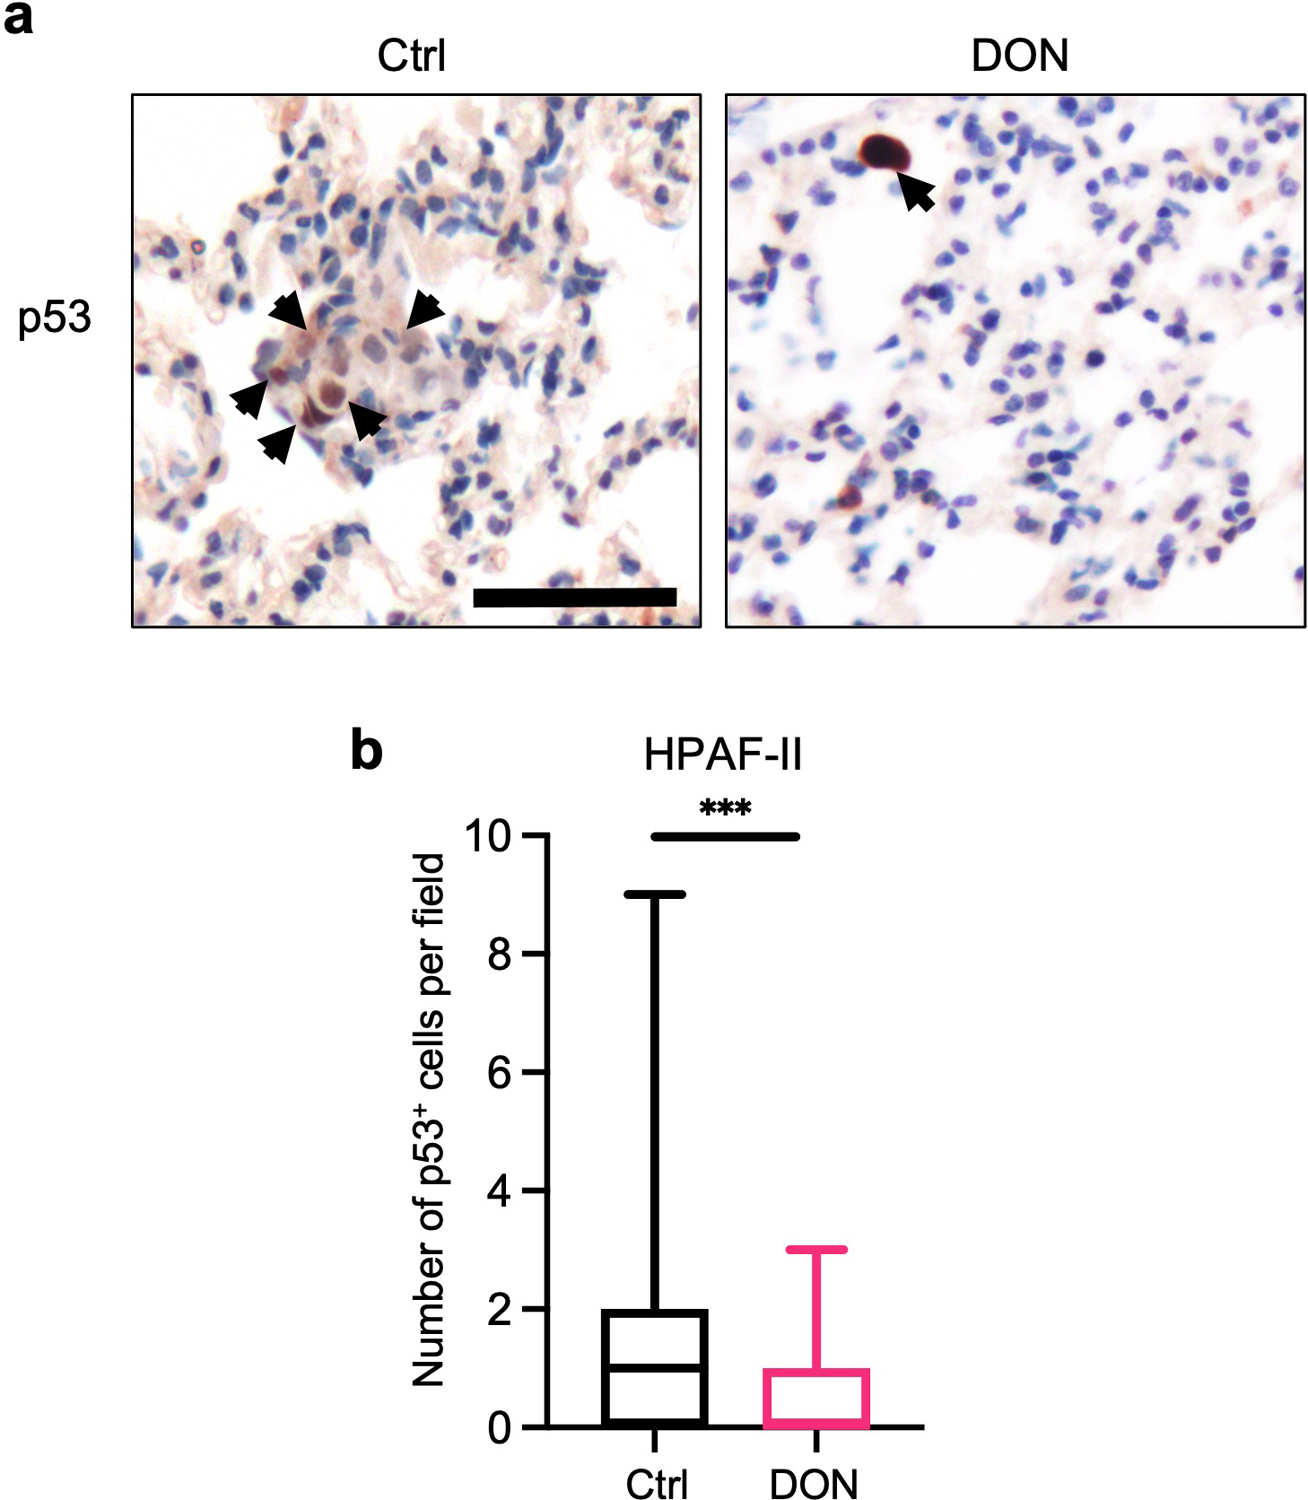
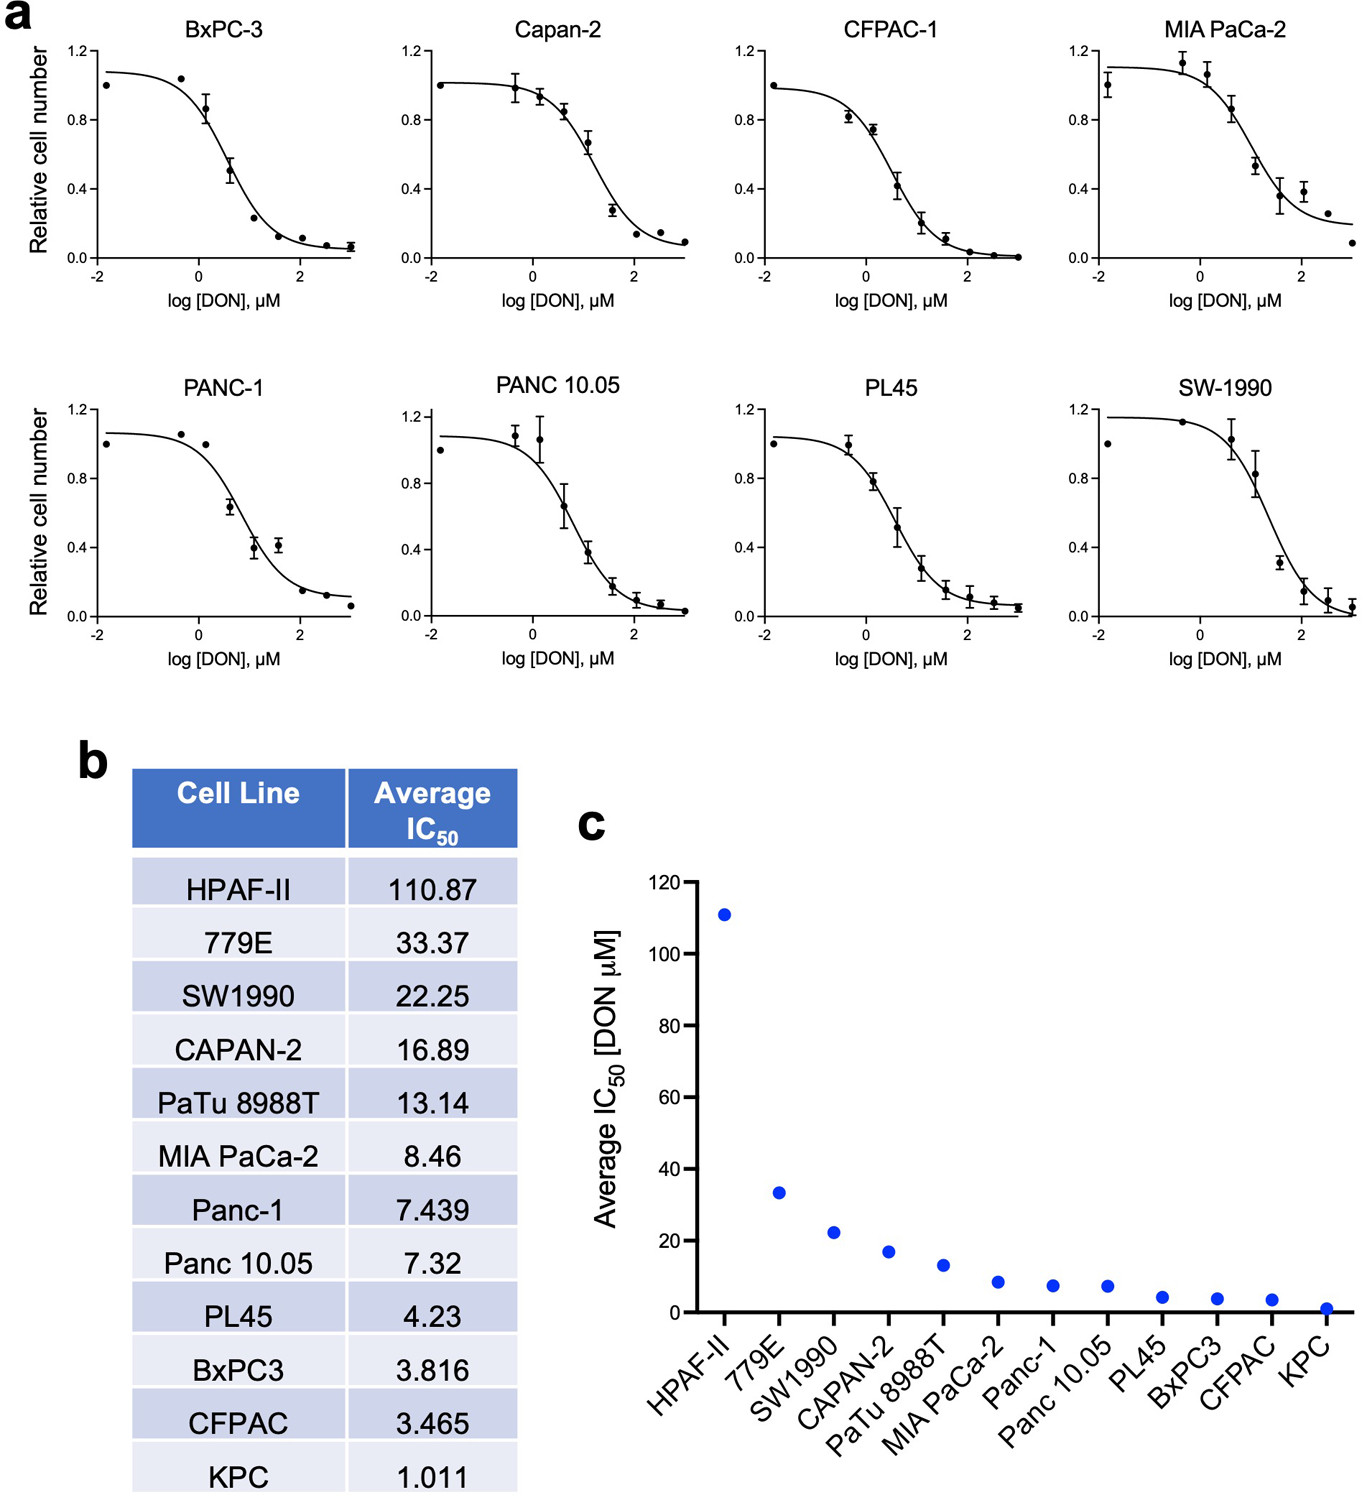
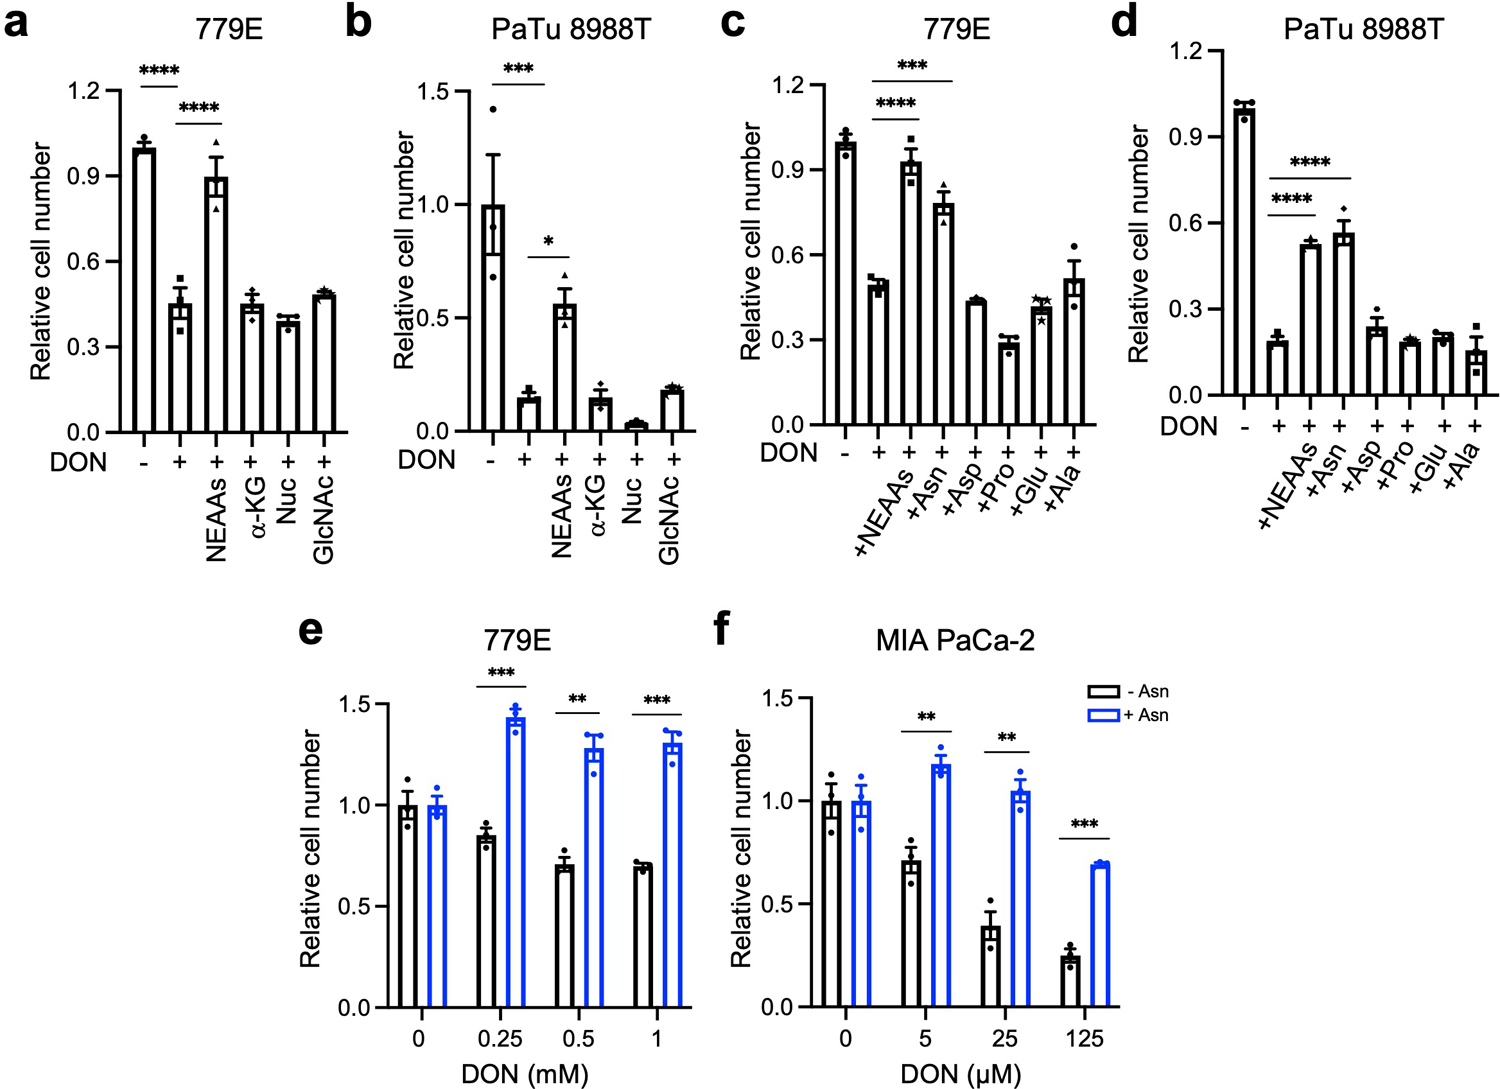
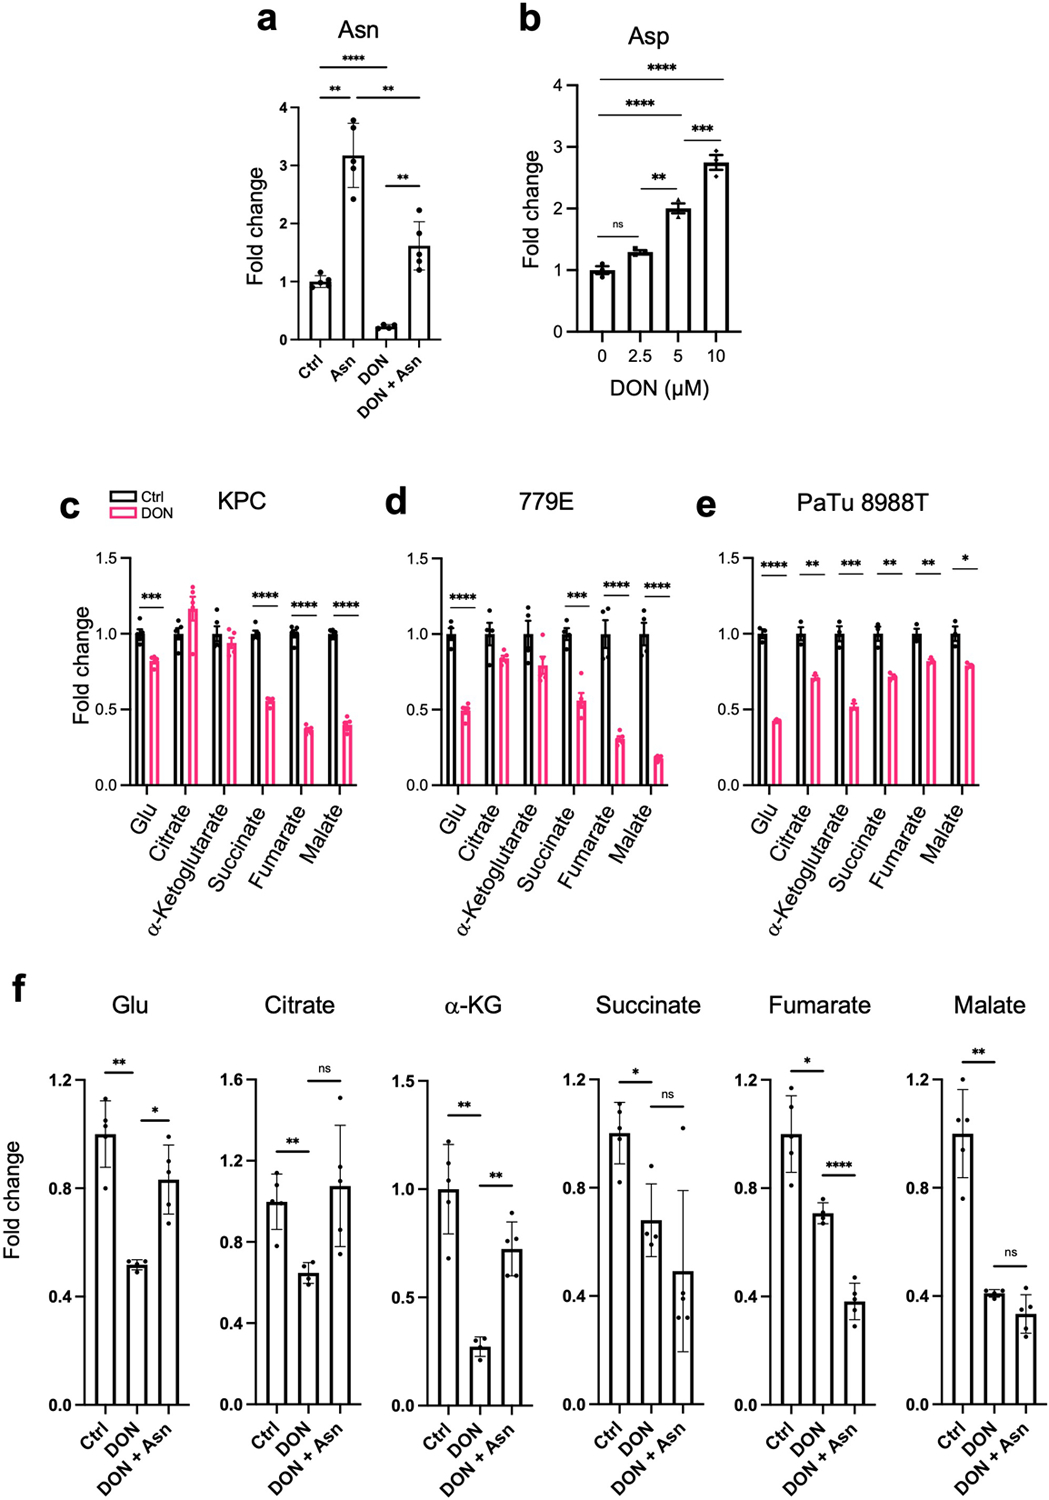
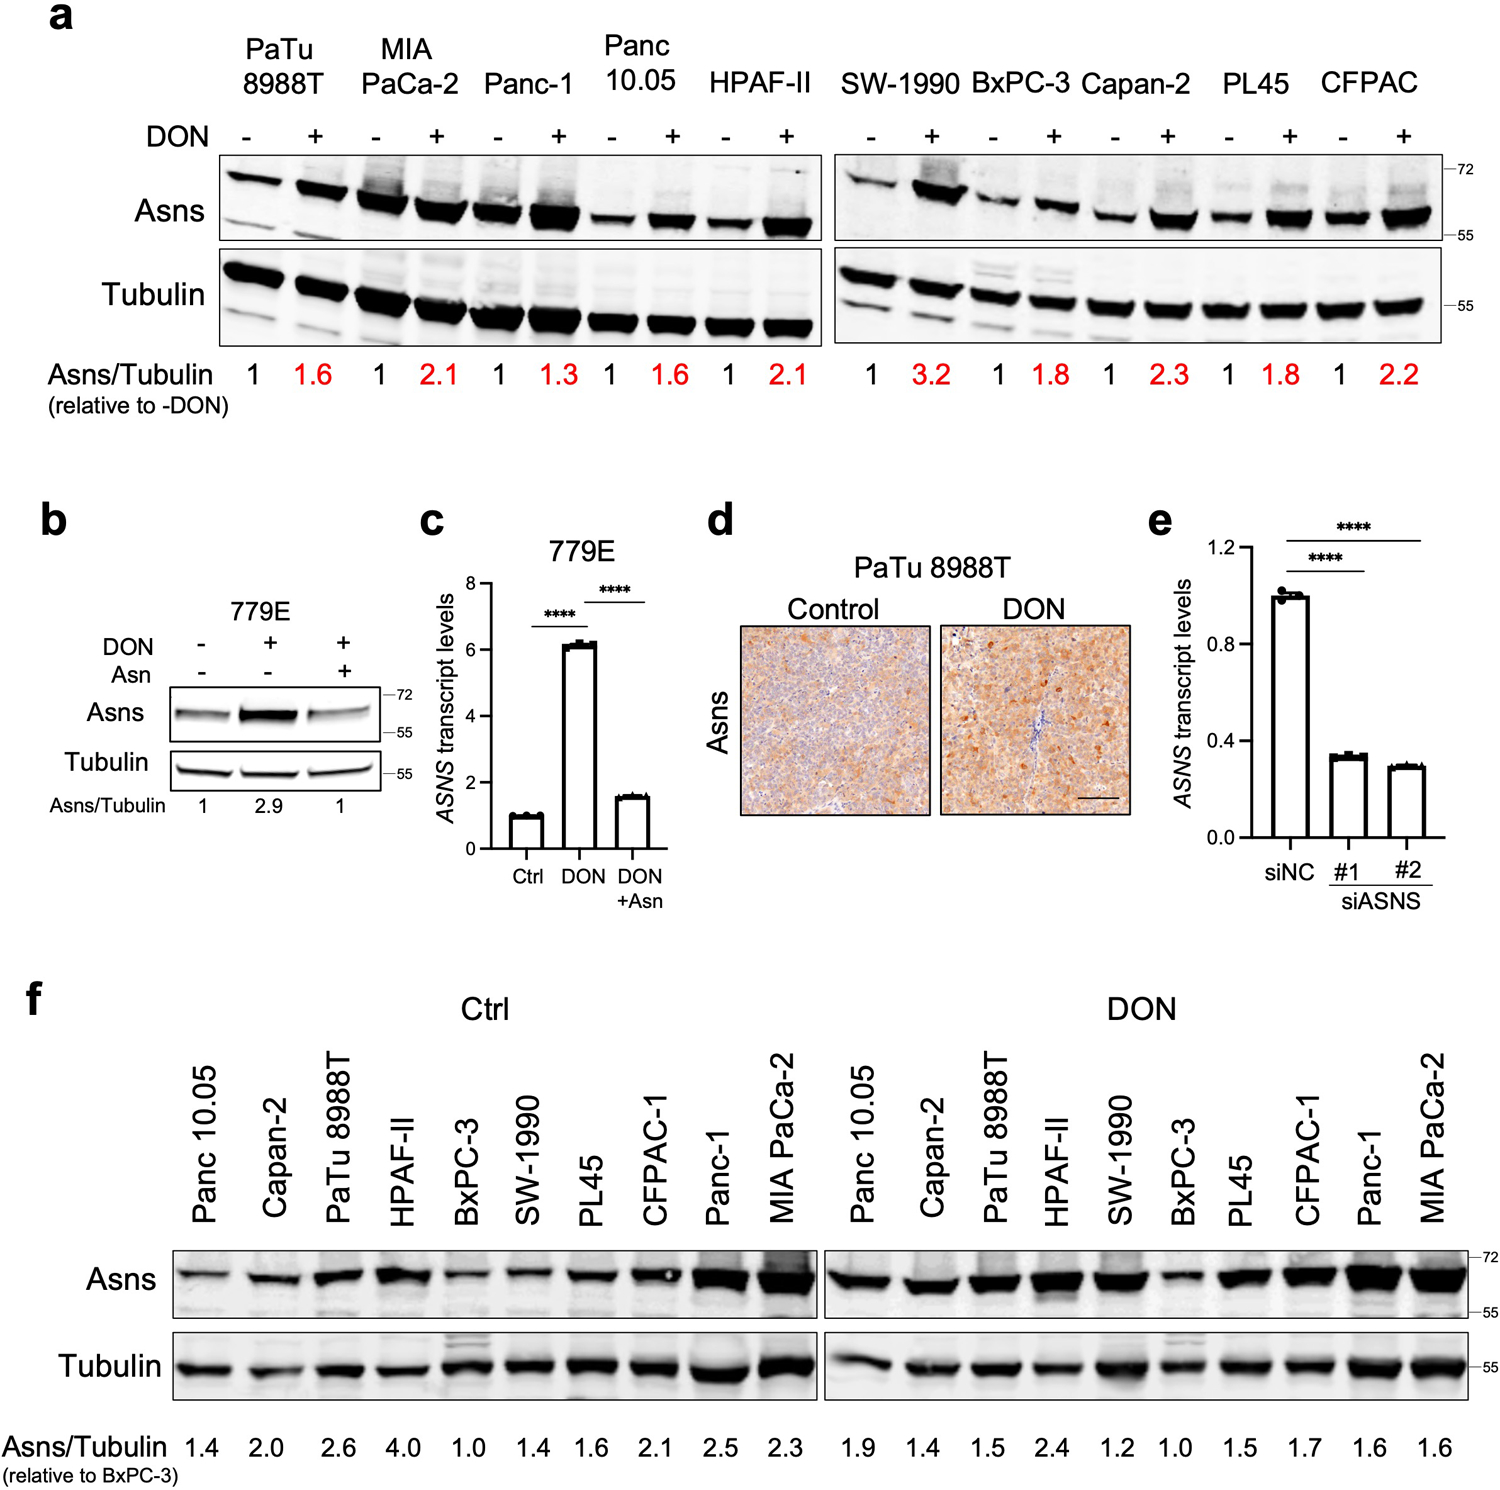
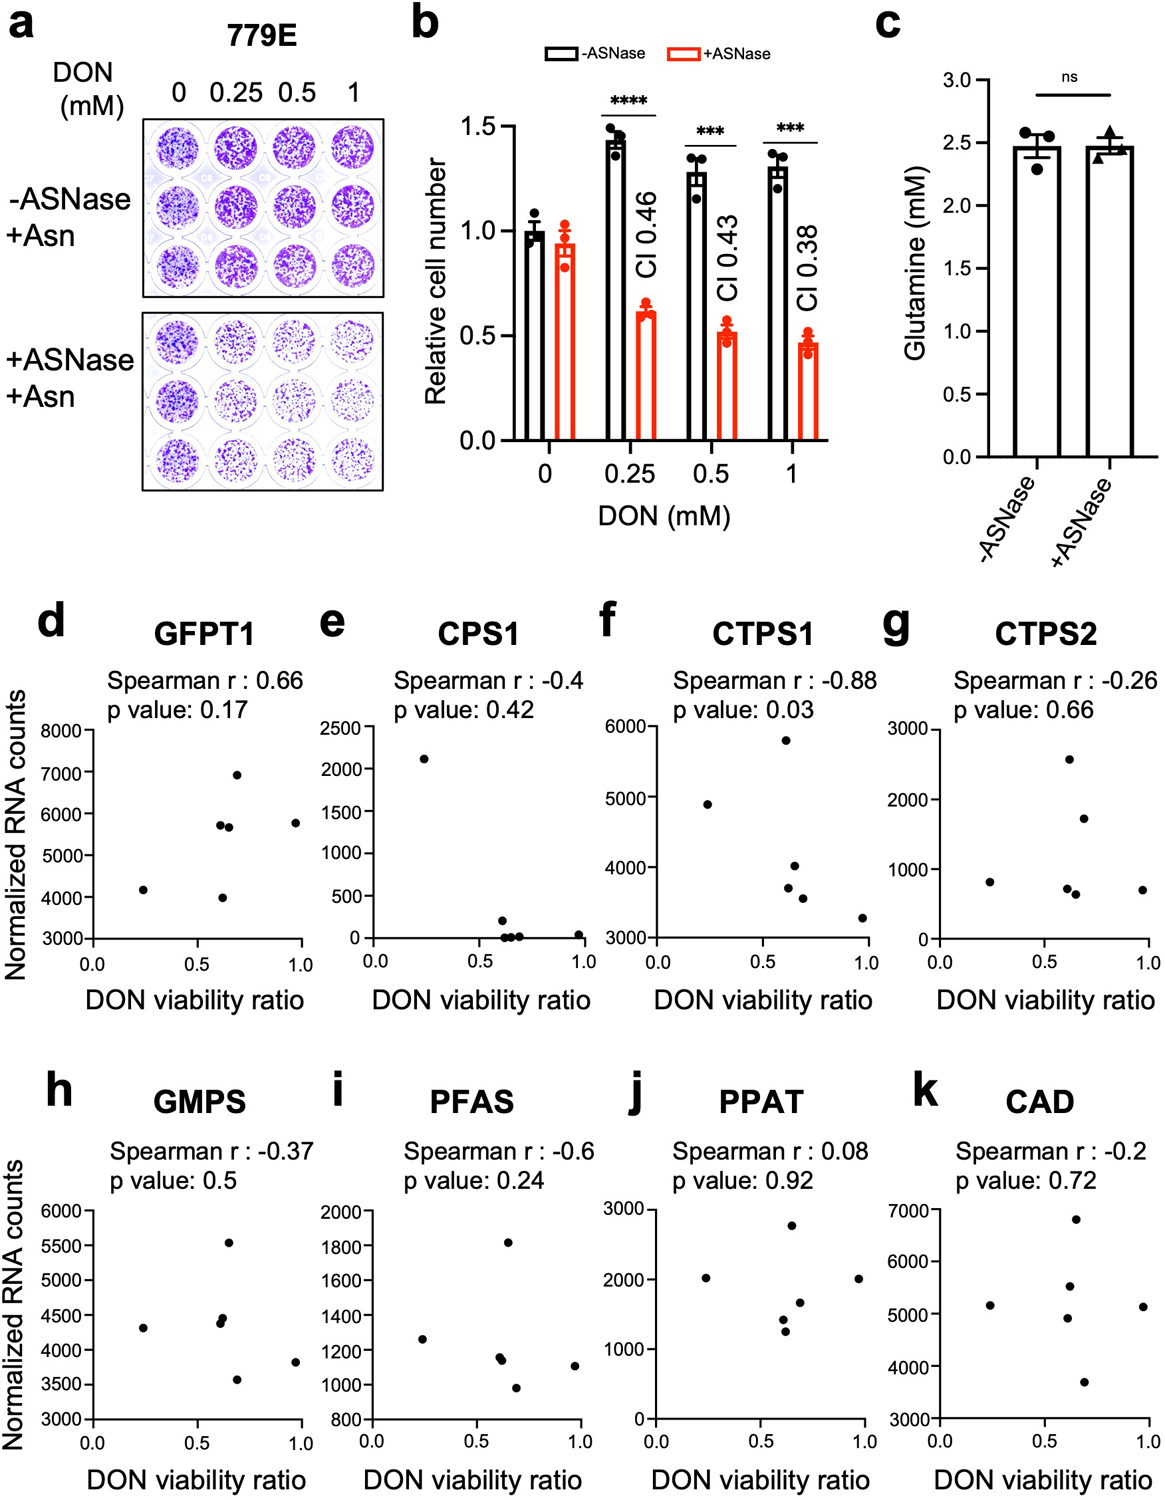
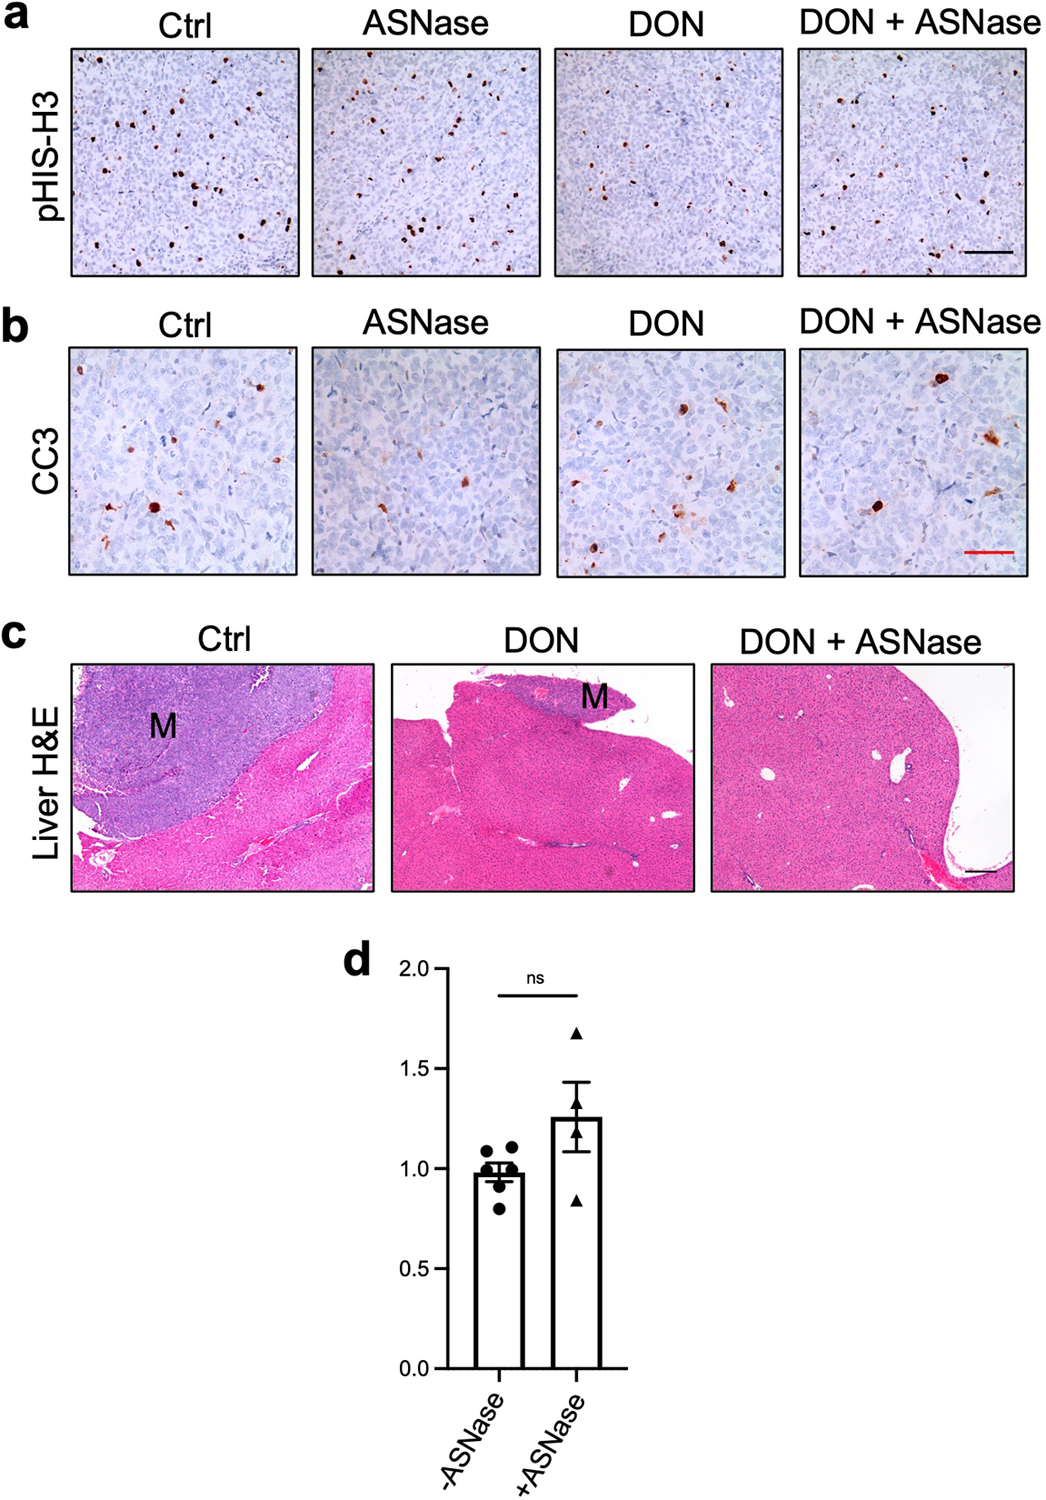
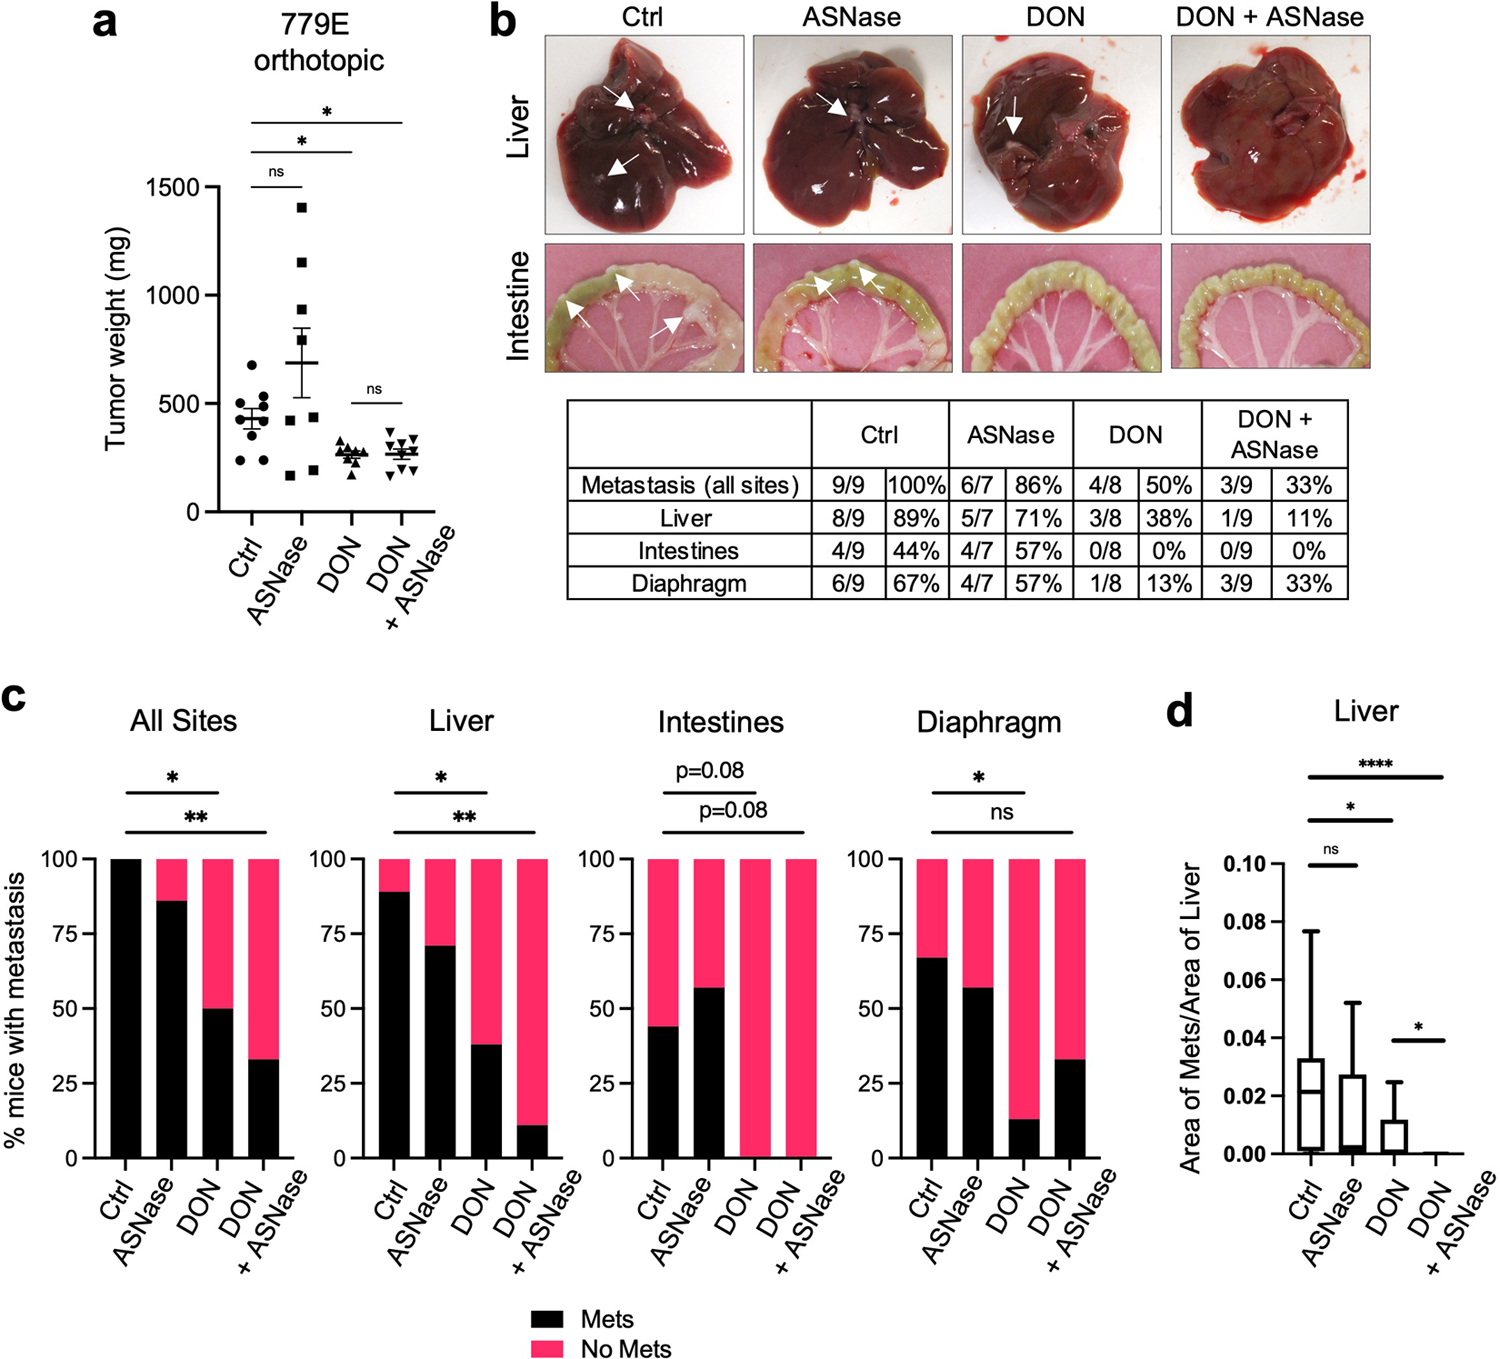
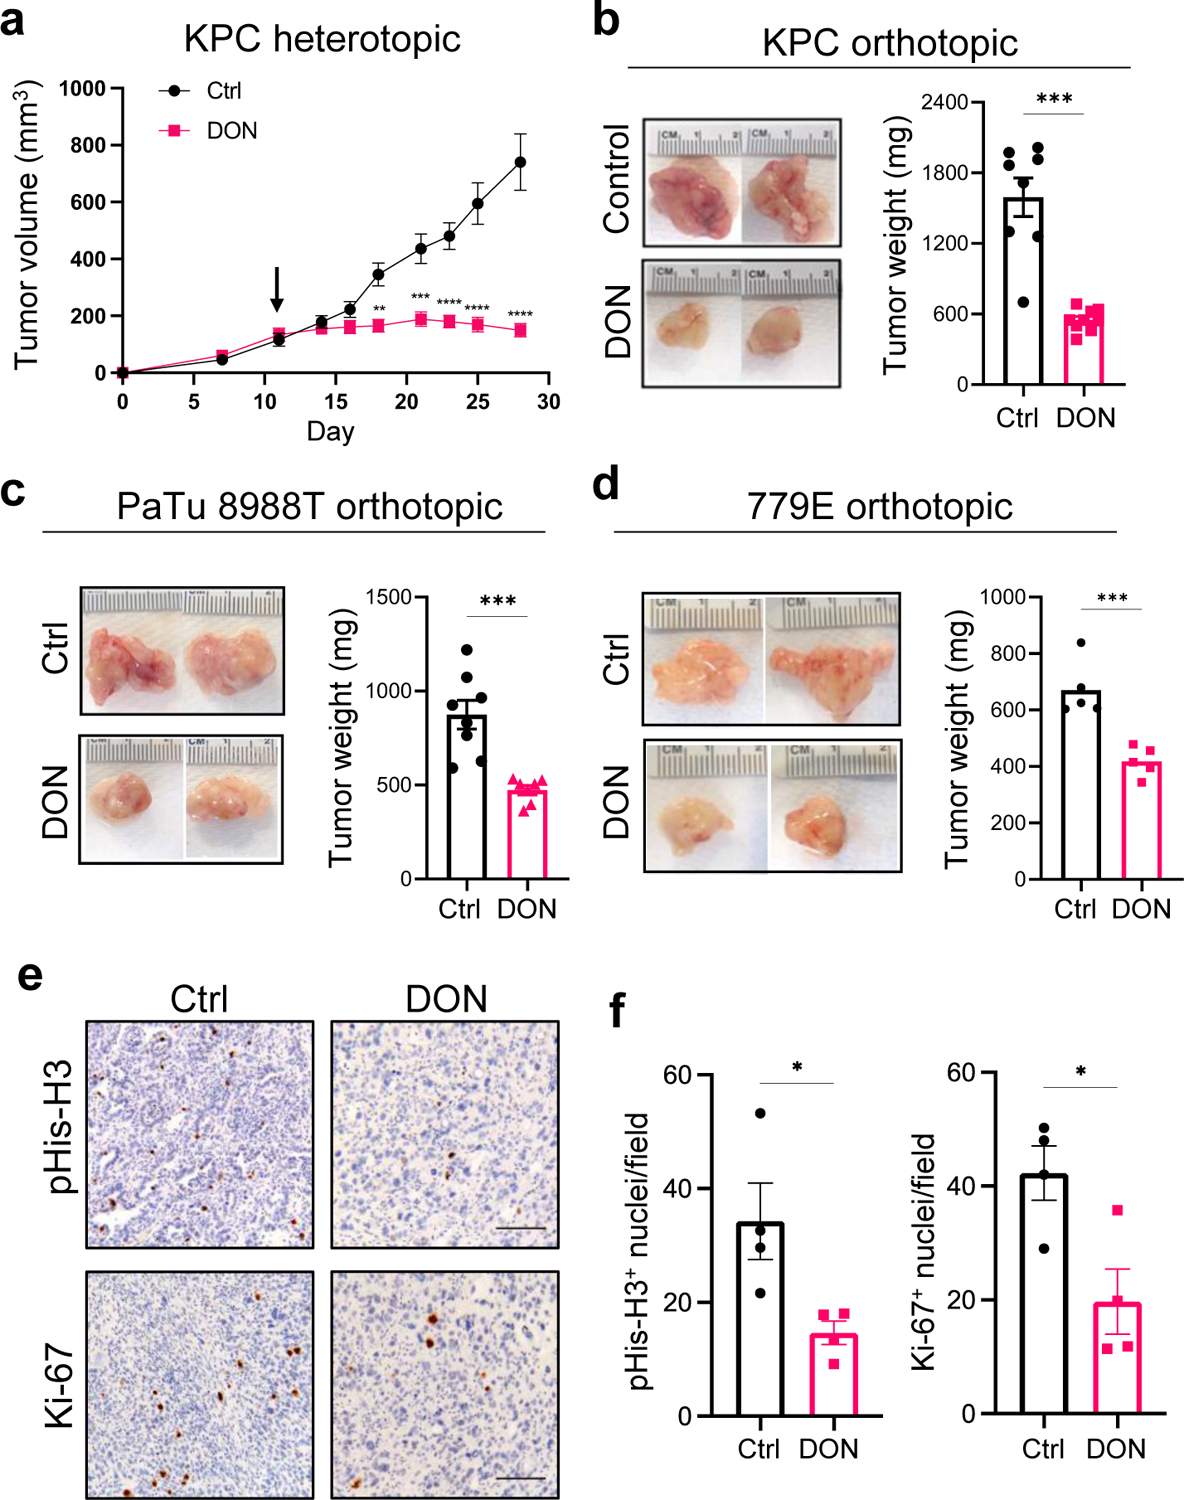
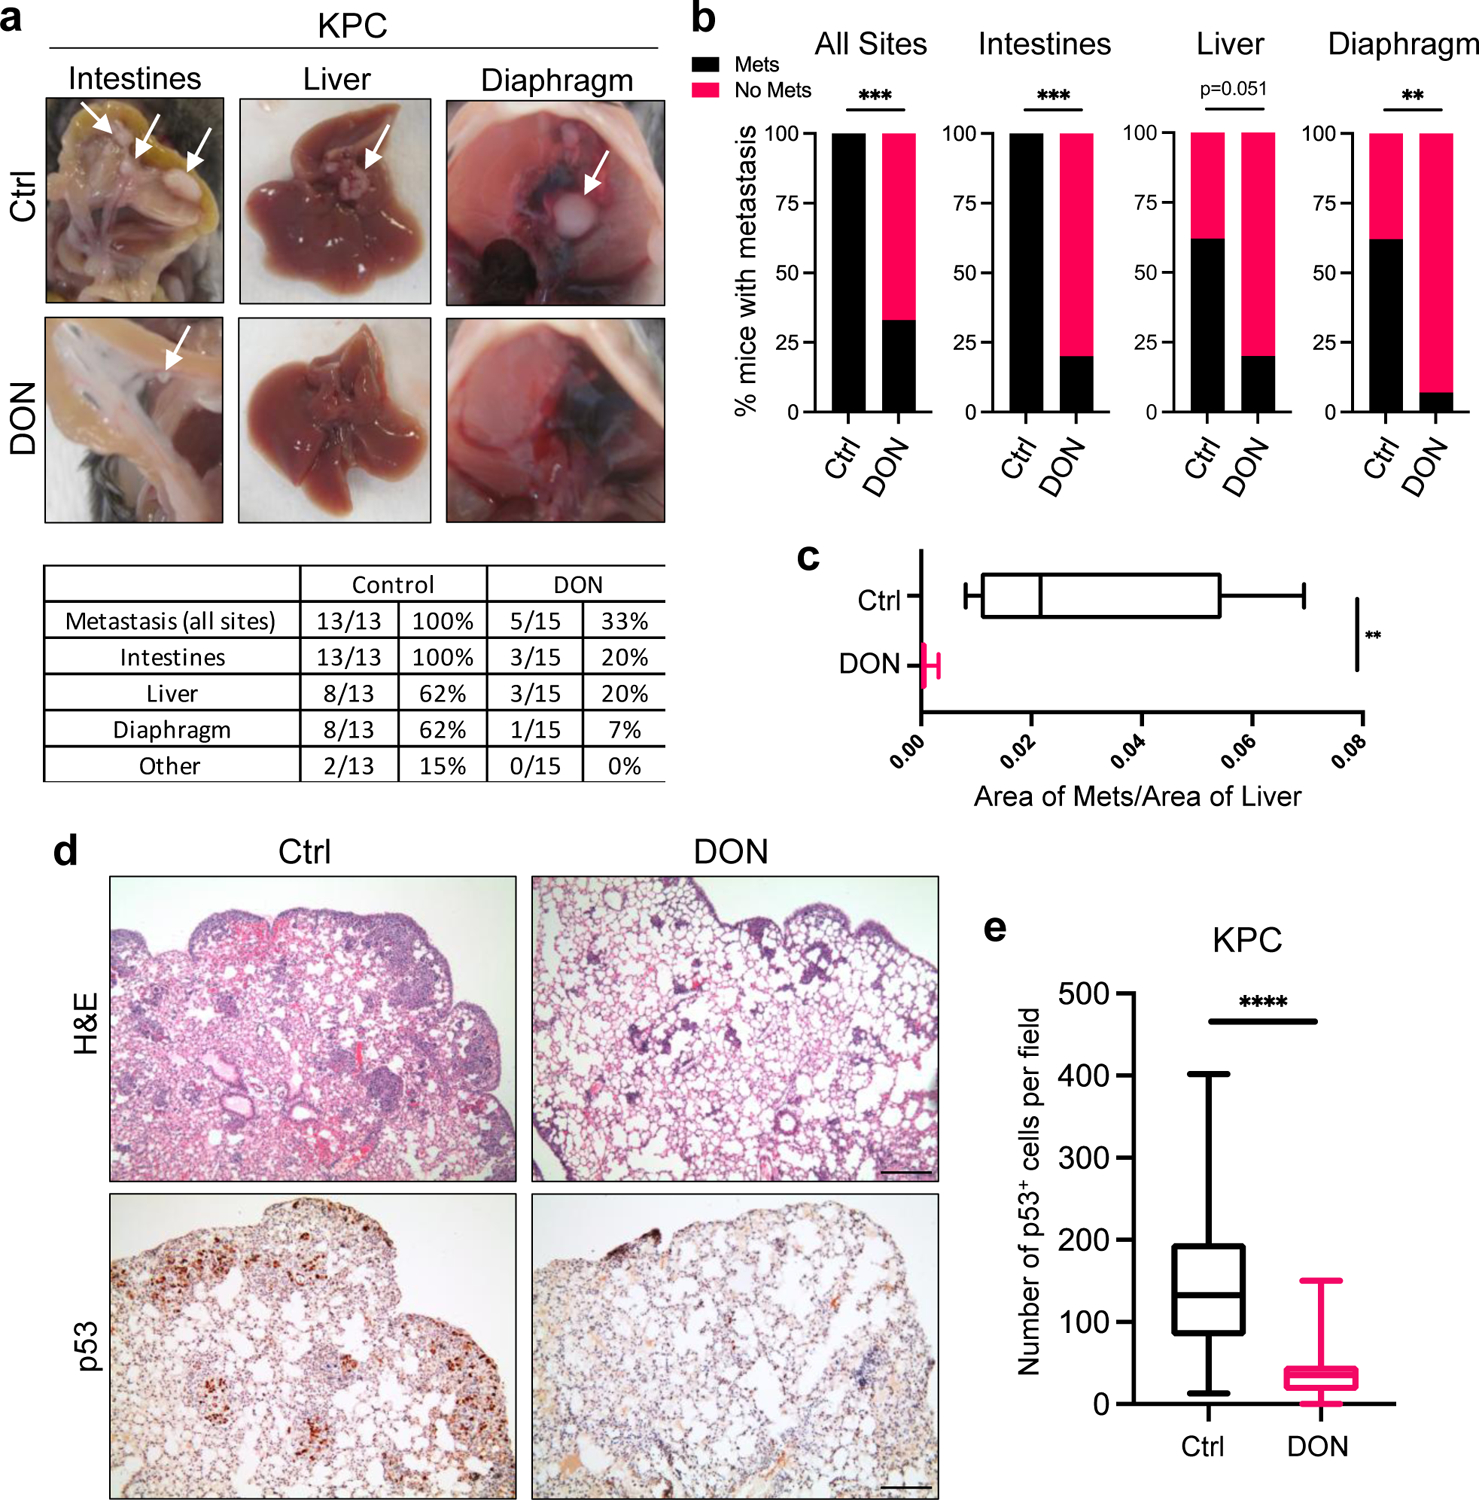
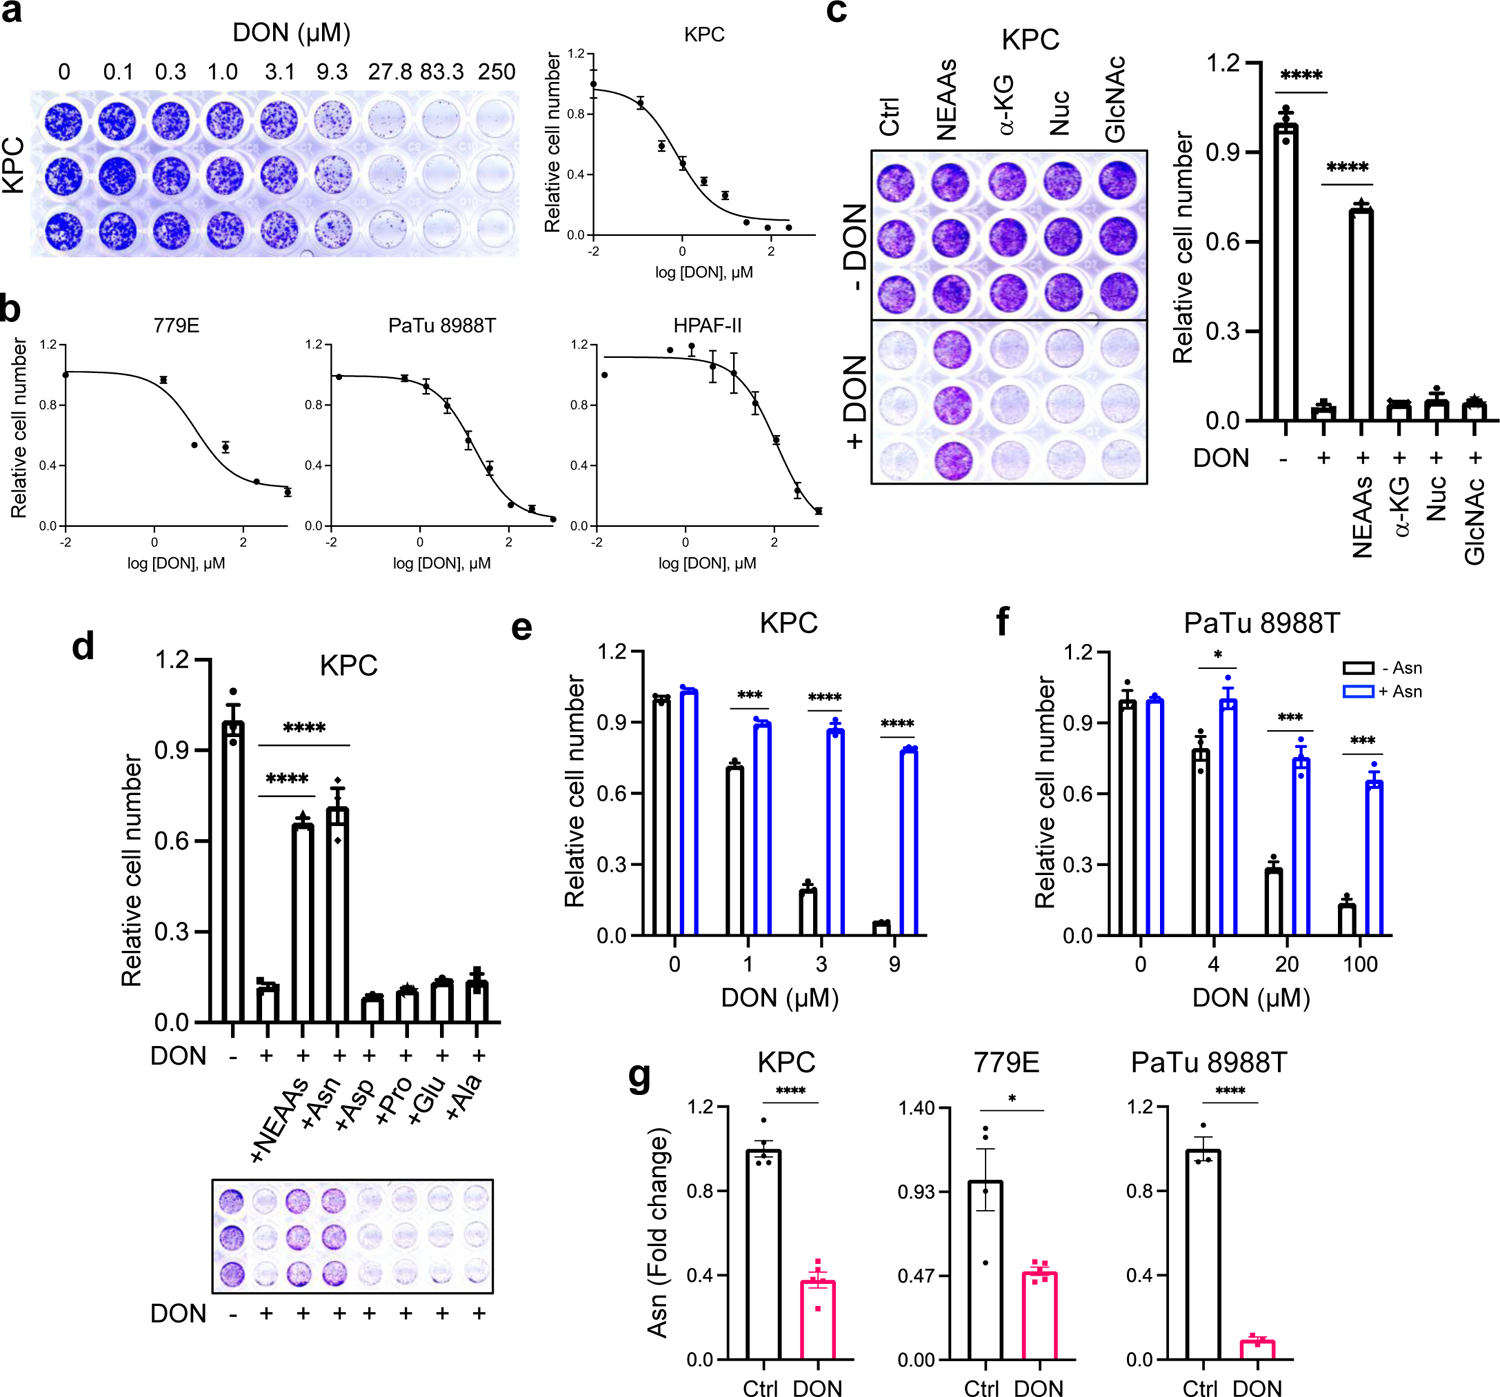
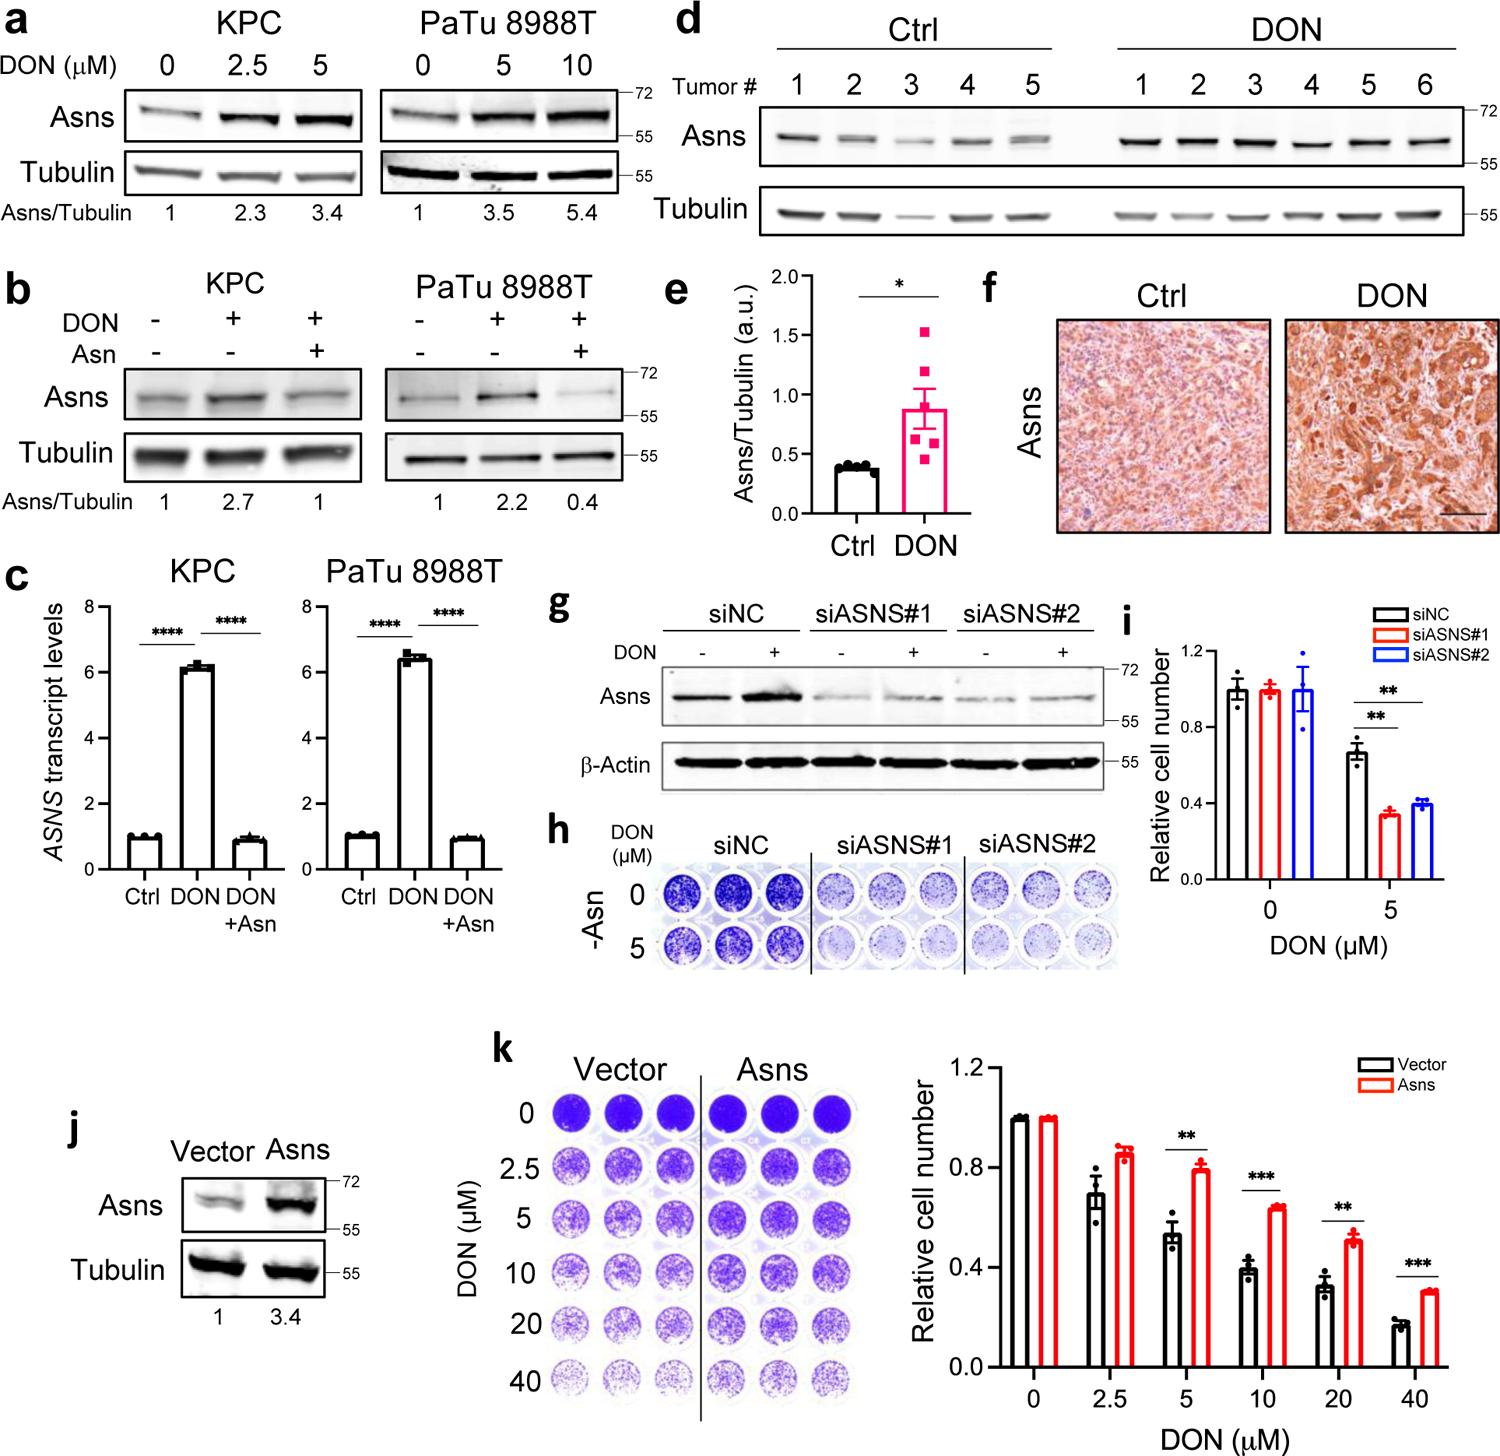
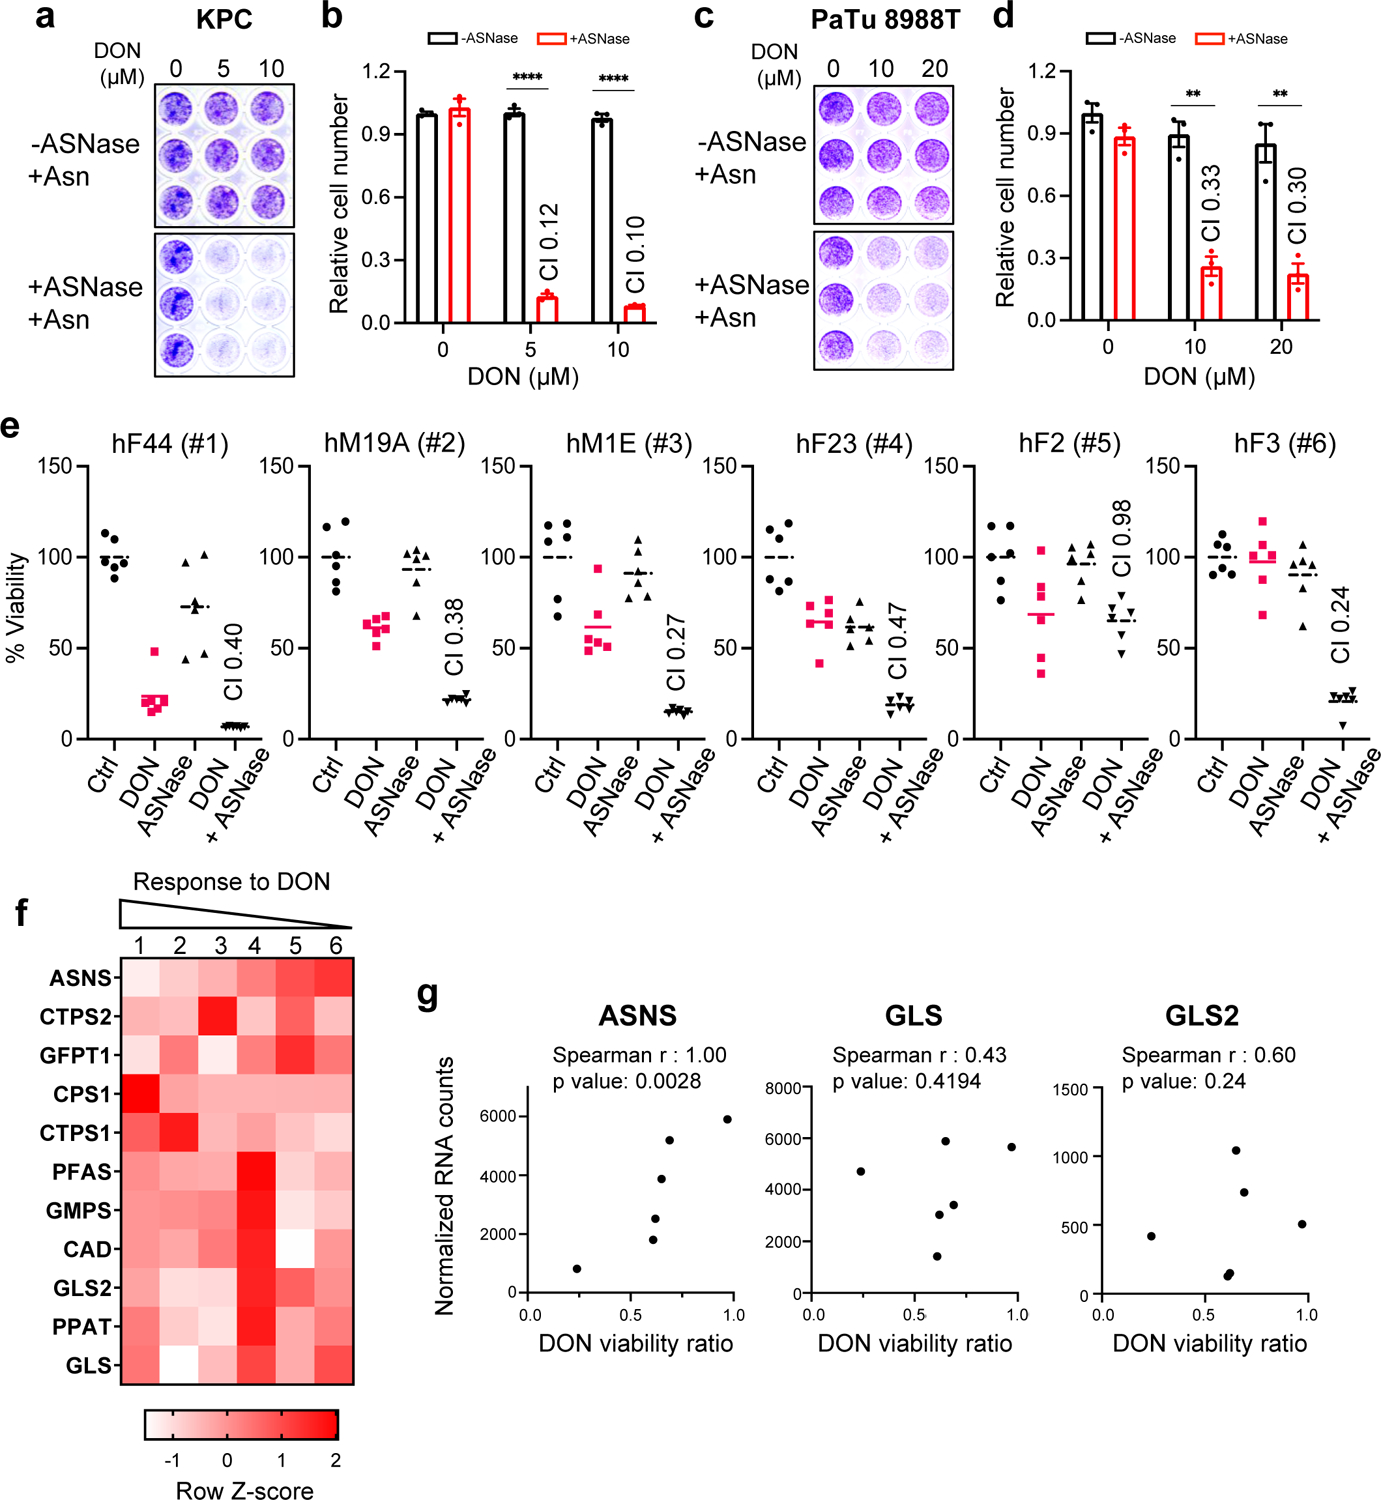
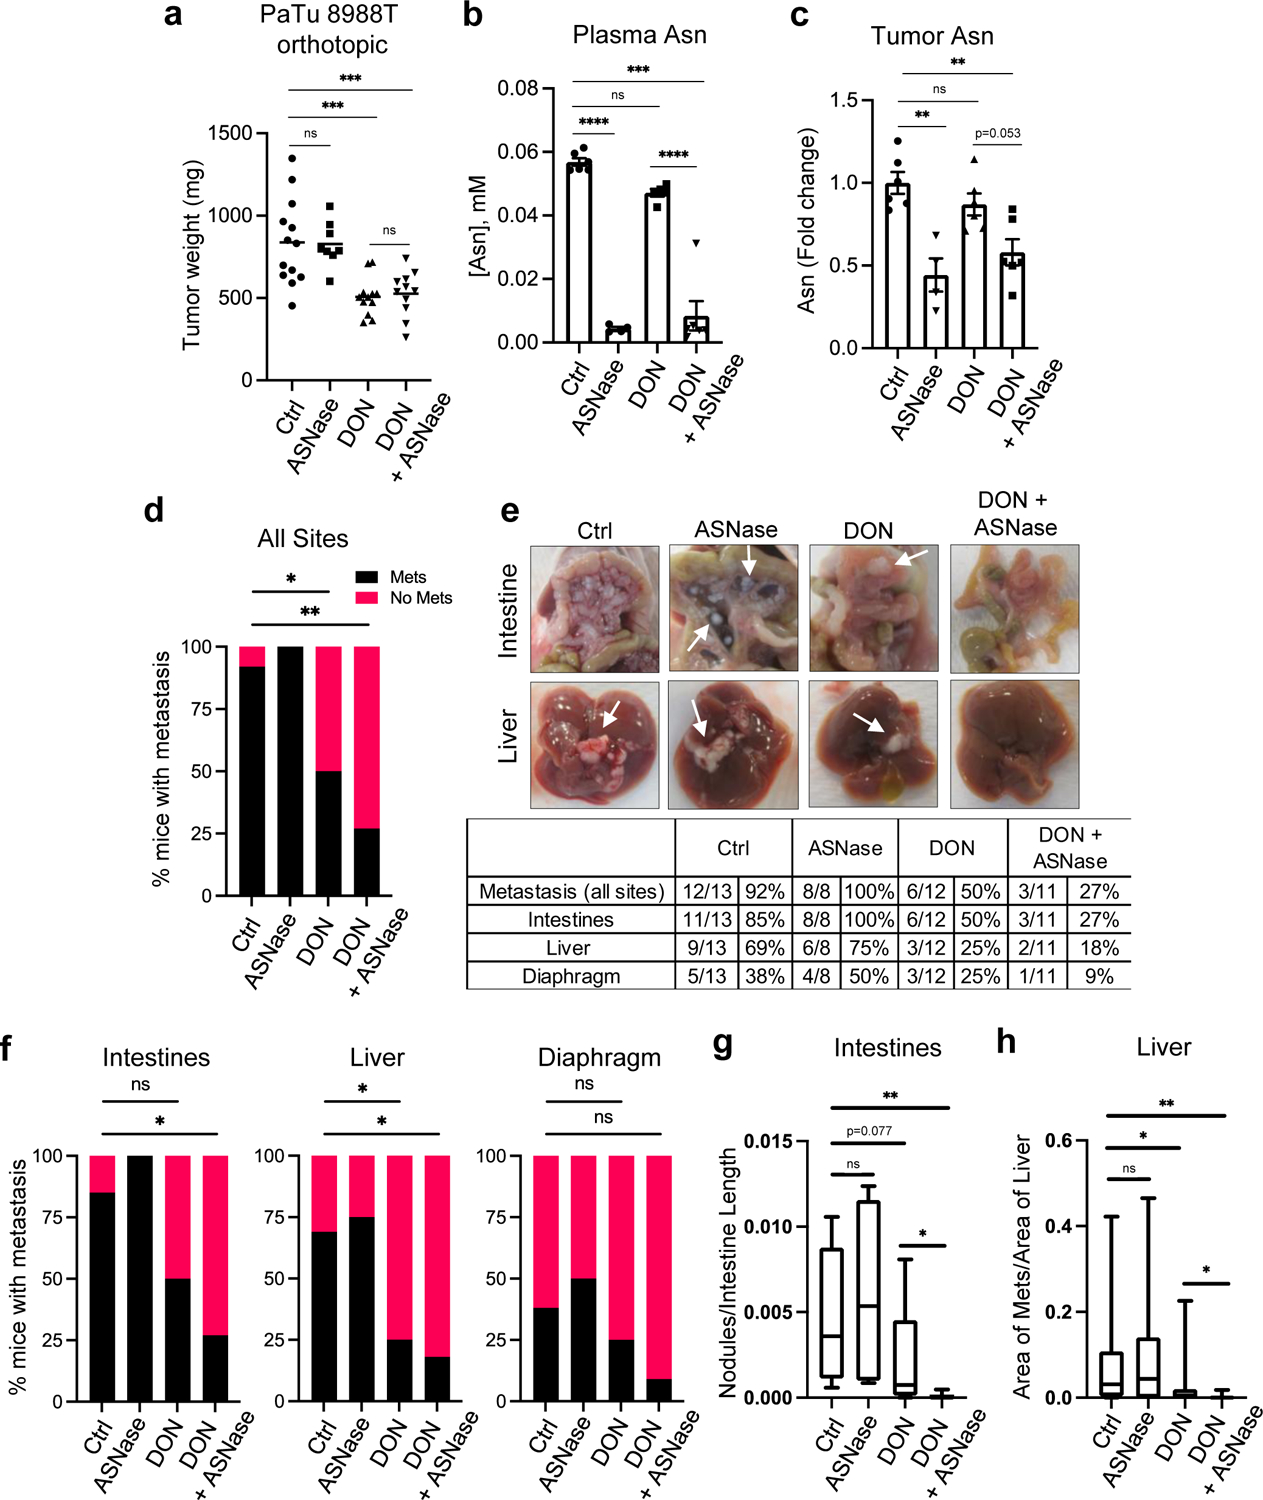
In pancreatic ductal adenocarcinoma (PDAC), glutamine is a critical nutrient that drives a wide array of metabolic and biosynthetic processes that support tumor growth. Here, we elucidate how 6-diazo-5-oxo-L-norleucine (DON), a glutamine antagonist that broadly inhibits glutamine metabolism, blocks PDAC tumor growth and metastasis. We find that DON significantly reduces asparagine production by inhibiting asparagine synthetase (ASNS), and that the effects of DON are rescued by asparagine. As a metabolic adaptation, PDAC cells upregulate ASNS expression in response to DON, and we show that ASNS levels are inversely correlated with DON efficacy. We also show that L-asparaginase (ASNase) synergizes with DON to affect the viability of PDAC cells, and that DON and ASNase combination therapy has a significant impact on metastasis. These results shed light on the mechanisms that drive the effects of glutamine mimicry and point to the utility of cotargeting adaptive responses to control PDAC progression.


Conflict of interest statement

COMPETING INTERESTS STATEMENT

The authors declare no competing interests.

Figures

Extended Data Fig. 1.
Extended Data Fig. 1.. DON treatment minimally affects animal body weight and tumor cell apoptosis, but significantly impacts tumor cell proliferation.
a) Body weights of mice bearing subcutaneous or orthotopic PDAC tumors after treatment with vehicle (Ctrl) or DON. Data are presented as mean ± SEM. KPC heterotopic (n=4, P=0.0167), KPC orthotopic (n=8 and n=9, P=0.6737), PaTu 8988T orthotopic (n=7, P=0.0078), and 779E orthotopic (n=8 and n=7, P=0.2302). b) Immunohistochemical staining of the apoptosis marker Cleaved Caspase 3 (CC3) in KPC and 779E orthotopic tumors treated with vehicle (Control) or DON (10mg/kg). Representative images are shown of n=3 independent experiments. Red scale bar 50 μm. c) Immunohistochemical staining of the proliferation marker pHis-H3 in 779E orthotopic tumors treated with vehicle (Control) or DON (10mg/kg). Representative images are shown. Scale bar 100 μm. Quantification of pHis-H3-positive nuclei/ image field is shown as mean ± SEM of n=4 tumors per group. P=0.0057. Statistical significance was calculated using unpaired two-tailed Student’s t test (a,c). *P<0.05, **P<0.01, ns=not significant.
Extended Data Fig. 2.
Extended Data Fig. 2.. DON suppresses lung micrometastases in an i.v. injection mouse model.
a) Immunohistochemical staining of p53 in lung tissue sections derived from animals i.v. injected with human HPAF-II cells. Representative images are shown. Black arrows indicate p53+ cells. Scale bar 50 μm b) Quantification of p53 staining in lung tissue sections. Data are presented as Min to Max box-and-whisker plot with median indicated at center line for n=64 or n=77 images per condition (Ctrl, DON) from a total of 4 or 5 mice per group (Ctrl, DON; P=0.0002). Statistical significance was calculated using unpaired two-tailed Student’s t test. ***P<0.001.
Extended Data Fig. 3.
Extended Data Fig. 3.. DON dose response curves and IC50 determinations for a panel of PDAC cells.
a) DON dose response curves for the indicated human PDAC cell lines. Data are presented relative to the untreated control condition and are representative of 3 independent experiments (MIA PaCa-2) or an average of 3 independent experiments (BxPC-3, Capan-2, CFPAC-1, PANC-1, PANC 10.05, PL45, SW-1990). Each independent experiment was performed with 3 replicates per condition. Data are presented as mean ± SEM. b) Summary of the average IC50 from at least 3 independent experiments for each of the cell lines indicated. c) Graphical representation of the average IC50 values presented in b).
Extended Data Fig. 4.
Extended Data Fig. 4.. Effects of DON on cell fitness are selectively rescued by asparagine supplementation.
a), b) Relative number of 779E (a) or PaTu 8988T (b) cells treated with or without DON (1mM or 10μM, respectively) with supplementation of the indicated metabolites for 24h. Cells were stained with crystal violet and stained area was quantified. Data are presented relative to untreated control for each condition and are representative of 3 independent experiments. Data are presented as mean ± SEM of triplicate wells. 779E cells: Ctrl(-DON) vs Ctrl(+DON), P<0.0001; Ctrl(+DON) vs NEAAs, P<0.0001. PaTu 8988T cells: Ctrl(-DON) vs Ctrl(+DON), P=0.0002; Ctrl(+DON) vs NEAAs, P=0.0366. c), d) Relative number of 779E (c) or PaTu 8988T (d) cells treated with or without DON (1mM or 10μM, respectively) supplemented with a cocktail of NEAAs or the indicated individual amino acids (0.1mM) for 24h. Data are presented relative to untreated control for each condition and are representative of 3 independent experiments. Data are presented as mean ± SEM of triplicate wells. 779E cells: Ctrl(+DON) vs NEAAs, P<0.0001; Ctrl(+DON) vs Asn, P=0.0001. PaTu 8988T cells: For all statistical comparisons, P<0.0001. e), f) Relative number of 779E cells (e) or MIA PaCa-2 cells (f) treated with DON at the indicated concentrations with or without 0.1mM Asn supplementation. Data are presented relative to untreated control for each condition and are representative of 3 independent experiments. Data are presented as mean ± SEM of triplicate wells. 779E cells: 0.25mM, P=0.0004; 0.5mM, P=0.0014; 1mM, P=0.0004. MIA PaCa-2 cells: 5μM, P=0.0033; 25μM, P=0.0016; 125μM, P=0.0002. Statistical significance was calculated using One-way ANOVA followed by Dunnet’s multiple comparisons test (a-d) or unpaired two-tailed Student’s t test (e,f). *P<0.05, **P<0.01, ***P<0.001, ****P<0.0001.
Extended Data Fig. 5.
Extended Data Fig. 5.. DON treatment affects polar metabolite pools.
a) Quantification of intracellular asparagine (Asn) levels in KPC cells treated with or without 10μM DON and supplemented with or without 0.1 mM Asn for 24h. Data are presented relative to untreated control that lacks Asn supplementation. Data are presented as mean ± SEM of at least n=4 samples. Ctrl vs Asn, P=0.0043. Ctrl vs DON, P<0.0001. Asn vs DON+Asn, P=0.0078. DON vs DON+Asn, P=0.0074. b) Quantification of intracellular aspartate (Asp) levels in PaTu 8988T cells treated with or without DON at the indicated concentrations for 24h. Data are presented relative to untreated control. Data are presented as mean ± SEM of n=3 samples. 0 vs 2.5μM, P=0.1163. 2.5μM vs 5μM, P=0.0011. 5μM vs 10μM, P=0.0008. For all other statistical comparisons, P<0.0001. c-e) Quantification of intracellular levels of the indicated metabolites in KPC (c), 779E (d) or PaTu 8988T (e) cells treated with vehicle control or DON (10μM, 10μM, and 1mM, respectively) for 24h. Data are presented relative to untreated control. Data are presented as mean ± SEM of n=5 samples (c,d) and n=3 samples (e). KPC cells: Glu, P=0.0006. 779E cells: Succinate, P=0.0003. PaTu 8988T cells: Citrate, P=0.0032. α-Ketoglutarate, P=0.0009. Succinate, P=0.0046. Fumarate, P=0.0074. Malate, P=0.013. For all other statistical comparisons, P<0.0001. f) Quantification of intracellular levels of the indicated metabolites in KPC cells treated with vehicle control, 10μM DON and 10μM DON supplemented with 0.1 mM Asn for 24h. Data are presented relative to untreated control. Data are presented as mean ± SEM of at least n=4 samples. Glu: Ctrl vs DON, P=0.0018. DON vs DON+Asn, P=0.0102. Citrate: Ctrl vs DON, P=0.0060. DON vs DON+Asn, P=0.0621. α-Ketoglutarate: Ctrl vs DON, P=0.0029. DON vs DON+Asn, P=0.0012. Succinate: Ctrl vs DON, P=0.0166. DON vs DON+Asn, P=0.4256. Fumarate: Ctrl vs DON, P=0.0129. DON vs DON+Asn, P<0.0001. Malate: Ctrl vs DON, P=0.0024. DON vs DON+Asn, P=0.1399. Statistical significance was calculated using unpaired two-tailed Student’s t test (a, c-f) or one-way ANOVA followed by Dunnet’s multiple comparisons test (b). *P<0.05, **P<0.01, ***P<0.001, ****P<0.0001, ns=not significant.
Extended Data Fig. 6.
Extended Data Fig. 6.. Determinations of ASNS expression levels using qPCR, immunohistochemistry, and immunoblotting.
a) Immunoblot assessing Asns protein levels in the indicated human PDAC cell lines treated with or without 10μM DON for 24h. Tubulin was used as a loading control. The results are representative of 2 independent experiments. Densitometry quantifications are presented relative to the vehicle only (-DON) condition and values were normalized to the loading control. b) Immunoblot assessing Asns protein expression in 779E cells treated with 0.5mM DON with or without 0.1mM Asn supplementation for 24h. Tubulin was used as a loading control. c) Relative ASNS mRNA expression levels as assessed by qPCR in 779E cells treated with 0.5mM DON with or without 0.1mM Asn supplementation for 24h. Data are presented relative to untreated control and are representative of 3 independent experiments. Data are presented as mean ± SEM of n=3 replicates. For all statistical comparisons P<0.0001. d) Immunohistochemical staining of Asns protein in PaTu 8988T orthotopic tumors treated with vehicle control (Control) or DON (5mg/kg). Representative images of n=4 mice per group are shown. Scale bar, 100μm. e) Relative ASNS mRNA expression levels in KPC cells as assessed by qPCR after transfection with non-targeting negative control siRNA (siNC) or two different hairpins targeting ASNS (siASNS#1 and siASNS#2) for 24h. Data are presented relative to siNC control and are representative of 3 independent experiments. Data are presented as mean ± SEM of n=3 replicates. For all statistical comparisons P<0.0001. f) Immunoblot assessing Asns protein levels in the indicated human PDAC cell lines treated vehicle (Control) or 10μM DON for 24h. Tubulin was used as a loading control. The results are representative of 2 independent experiments. Densitometry quantifications are presented relative to the values obtained for BxPC-3 cells and were normalized to the loading control. Statistical significance was calculated using One-way ANOVA followed by Tukey’s multiple comparisons test. ****P<0.0001.
Extended Data Fig. 7.
Extended Data Fig. 7.. DON and ASNase co-treatment in 779E cells, glutamine quantification, and correlation analyses for DON target genes in PDOs.
a,b) Relative number of 779E cells treated with the indicated doses of DON in combination with ASNase (0.5U/ml) for 24h. Cells were stained with crystal violet and representative images are shown. Quantification of crystal violet staining is shown relative to untreated control and is representative of two independent experiments. The coefficient of drug interaction (CI) was calculated for each DON concentration (shown in graph). Data are presented as mean ± SEM of n=3 replicate wells. 0.25mM, P<0.0001. 0.5mM, P=0.0004. 1mM, P=0.00017. c) Determination of the glutamine concentration in cell culture media incubated with or without 0.5U/mL ASNase for 24 hours. Data are presented as mean ± SEM of n=3 replicate samples. d-k) Correlation analysis between normalized gene expression of the indicated enzymes targeted by DON and DON viability ratio for the six PDOs assessed. Statistical significance was calculated using unpaired two-tailed Student’s t test (b,c) or two-tailed Spearman correlation coefficient (d-k). ***P<0.001, ****P<0.0001, ns=not significant.
Extended Data Fig. 8.
Extended Data Fig. 8.. Co-treatment with DON and ASNase does not further impact apoptosis or proliferation in tumors but does suppress liver metastases.
a), b) Immunohistochemical staining of phospho-Histone H3 (pHis-H3; a) or cleaved Caspase 3 (CC3; b) in PaTu 8988T orthotopic tumors treated with vehicle (Control), ASNase (60U/mice), DON (5–10mg/kg), or a combination of DON + ASNase for 3 weeks. Representative images are shown of n=3 independent experiments. Scale bar 100 μm. c) Hematoxylin and Eosin (H&E) staining of liver sections from PaTu 8988T tumor-bearing mice treated with vehicle (Control), DON (5–10mg/kg), or a combination of DON + ASNase for 3 weeks. Metastases are indicated (M). Representative images are shown of n=3 independent experiments. Scale bar 200 μm. d) Determination of the glutamine plasma concentration in animals treated with vehicle (Control) or ASNase (60U/mouse) for 3 weeks. Data are presented as mean ± SEM of n=6 or n=4 mice. Statistical significance was calculated using unpaired two-tailed Student’s t test. P=0.2093. ns=not significant.
Extended Data Fig. 9.
Extended Data Fig. 9.. Suppression of metastasis by DON is enhanced by co-treatment with ASNase in a primary PDAC orthotopic mouse model.
a) Tumor weights of 779E orthotopic tumors from animals treated with vehicle (Ctrl), ASNase (3U/g), DON (5mg/kg), or combination of DON + ASNase for 2 weeks. Data are presented as mean ± SEM of n=9, n=7, n=8, or n=9 mice per group. Ctrl vs ASNase, P=0.5836. Ctrl vs DON, P=0.042. Ctrl vs DON+ASNase, P=0.0491. b) Characterization of macrometastases in animals with 779E orthotopic tumors treated as indicated. Representative images of macrometastases in the different tissues are shown. The white arrows point to macrometastases. The number of mice with macrometastases in each organ site was quantified as indicated in the table. n=9, n=7, n=8, or n=9 mice per group. c) Quantification of the percentage of mice with 779E-derived primary orthotopic tumors that presented with macrometastases to any organ (all sites), the liver, intestines, or diaphragm. n=9, n=7, n=8, or n=9 mice per group. All Sites: Ctrl vs DON, P=0.029; Ctrl vs DON+ASNase, P=0.009. Liver: Ctrl vs DON, P=0.0498; Ctrl vs DON+ASNase, P=0.0034. Diaphragm: Ctrl vs DON, P=0.0498; Ctrl vs DON+ASNase, P=0.347. d) Quantification of the metastatic tumors in the liver using image-based computation. The total area of tumor tissue per area of liver tissue was determined. Data are presented as Min to Max box-and-whisker plot with median indicated at center line for n=16, n=14, n=12, or n=18 images per condition from a total of 9, 7, 6 or 9 mice per group. Ctrl vs ASNase, P=0.347. Ctrl vs DON, P=0.016. Ctrl vs DON+ASNase, P<0.0001. DON vs DON+ASNase, P=0.013. Statistical significance was calculated using one-way ANOVA followed by Tukey’s multiple comparisons (a), two-tailed chi-square test (c), or unpaired two-tailed Student’s t test (d). *P<0.05, **P<0.01, ***P<0.001, ****P<0.0001, ns=not significant.
Fig. 1.
Fig. 1.. Broadly inhibiting glutamine metabolism with DON suppresses PDAC tumor growth.
a) Growth of syngeneic KPC tumors implanted subcutaneously and treated with vehicle control (Control) or DON (10mg/kg) for 2 weeks. Tumor volumes were measured with a digital caliper at the indicated timepoints. Data are presented as mean ± SEM of n=4 mice/8 tumors per group. Day 18, P=0.0016. Day 21, P=0.0007. Days 23, 25 and 28, P<0.0001. b) Tumor weights of KPC orthotopic tumors from animals treated with vehicle control (Ctrl) or DON (10mg/kg) for 10 days. Representative tumor images are shown. Data are presented as mean ± SEM of n=8 or n=9 mice per group (Ctrl, DON). P=0.0003. c) Tumor weights of PaTu 8988T orthotopic tumors from animals treated with vehicle control (Ctrl) or DON (10mg/kg) for 3 weeks. Representative tumor images are shown. Data are presented as mean ± SEM of n=7 mice per group. P=0.0009. d) Tumor weights of 779E orthotopic tumors from animals treated with vehicle control (Ctrl) or DON (10mg/kg) for 2 weeks. Representative tumor images are shown. Data are presented as mean ± SEM of n=8 or n=7 mice per group (Ctrl, DON). P=0.001. e) Immunohistochemical staining of the proliferation markers phospho-Histone H3 (pHis-H3) and Ki-67 in KPC orthotopic tumors treated with vehicle (Ctrl) or DON (10mg/kg). Representative images are shown. Scale bar 100 μm. f) Quantification of pHis-H3- or Ki-67-positive nuclei/image field is shown as mean ± SEM of n=4 tumors per group. pHis-H3, P=0.0319. Ki-67, P=0.0227. Statistical significance was calculated using unpaired two-tailed Student’s t test (a-d, f). *P<0.05, **P<0.01, ***P<0.001, ****P<0.0001.
Fig. 2.
Fig. 2.. DON treatment attenuates metastasis in PDAC.
a) Characterization of macrometastases in animals with KPC orthotopic tumors treated with vehicle or DON (10mg/kg). Representative images of macrometastases in different tissues are shown. The number of mice with metastases in each organ site was quantified as indicated in the table. n=13 or n=15 mice per group as indicated. b) Quantification of the percentage of mice with KPC-derived primary orthotopic tumors that presented with macrometastases at any organ (all sites, P=0.0003), the intestines (P<0.0001), the liver, or the diaphragm (P=0.0036). n=13 or n=15 mice per group (Ctrl, DON). c) Quantification of the relative metastatic tumor sizes in the liver using image-based computation. The total area of tumor tissue per area of liver tissue was determined. Data are presented as Min to Max box-and-whisker plot with median indicated at center line for n=10 images per condition from a total of 5 mice per group. P=0.0027. d) H&E staining and immunohistochemical staining of p53 in lung tissue sections derived from animals i.v. injected with KPC cells. Representative images are shown. Scale bar 500 μm. e) Quantification of p53 staining in lung tissue sections. Data are presented as Min to Max box-and-whisker plot with median indicated at center line for n=60 or n=75 images per condition (Ctrl, DON) from a total of 4 or 5 mice per group (Ctrl, DON). P<0.0001. Statistical significance was calculated using two-tailed chi-square test (b) or unpaired two-tailed Student’s t test (c, e). **P<0.01, ***P<0.001, ****P<0.0001.
Fig. 3.
Fig. 3.. DON treatment suppresses PDAC cell growth through inhibition of asparagine metabolism.
a) Crystal violet staining and dose response curve for KPC cells treated with DON. Relative cell number was quantified by crystal violet staining. A representative image of the crystal violet staining is shown. Data are presented relative to the untreated control condition and are representative of 3 independent experiments. Each independent experiment was performed with 3 replicates per condition. Data are presented as mean ± SEM. b) DON dose response curves for the indicated human PDAC cell lines. Data are presented relative to the untreated control condition. For 779E and PaTu 8998T, data are representative of 3 independent experiments. For HPAF-II, data are an average of 3 independent experiments. Each independent experiment was performed with 3 replicates per condition. Data are presented as mean ± SEM. c) Crystal violet assays showing relative cell number of KPC cells treated with or without DON (5μM) and supplemented with the indicated metabolites for 24h. Representative images are shown. Data are presented relative to the untreated control (-DON) for each condition and are representative of 3 independent experiments. Data are presented as mean ± SEM of triplicate wells. Metabolites assessed were non-essential amino acids (NEAAs), α-ketoglutarate (α-KG), nucleosides (Nuc) and N-acetyl glucosamine (GlcNac). Ctrl vs DON, P<0.0001. Ctrl vs NEAAs, P<0.0001. d) Crystal violet assays showing relative cell number of KPC cells treated with or without DON (5 μM) supplemented with either a cocktail of NEAAs or the indicated individual amino acids (0.1mM) for 24h. Representative images are shown. Data are presented relative to the untreated control (-DON) for each condition and are representative of 3 independent experiments. Data are presented as mean ± SEM of triplicate wells. Ctrl vs NEAAs, P<0.0001. Ctrl vs Asn, P<0.0001. e), f) Relative number of KPC cells (e) or PaTu 8988T cells (f) treated with DON at the indicated concentrations with or without asparagine (Asn, 0.1mM) supplementation. Data are presented relative to the untreated control condition (-Asn, 0μM DON) and are representative of 3 independent experiments. Data are presented as mean ± SEM of triplicate wells. KPC cells: 1μM DON, P=0.0003; 3μM DON, P<0.0001; 9μM DON, P<0.0001. PaTu 8998T cells: 4μM DON, P=0.0343; 20μM DON, P=0.0007; 100μM DON, P=0.00014. g) Quantification of intracellular Asn levels in the indicated PDAC cell lines treated with vehicle control (Ctrl) or DON (10μM for KPC and PaTu 8988T, 1mM for 779E) for 24h. Data are presented relative to untreated control. Data are presented as mean ± SEM of n=5 wells (KPC, 779E) or n=3 wells (PaTu 8988T). KPC, P<0.0001. 779E, P=0.0128. PaTu 8988T, P<0.0001. Statistical significance was calculated using one-way ANOVA followed by Dunnet’s multiple comparisons test (c, d) or unpaired two-tailed Student’s t test (e-g). *P<0.05, ***P<0.001, ****P<0.0001.
Fig. 4.
Fig. 4.. ASNS upregulation is a metabolic adaptation to DON treatment.
a) Immunoblot assessing Asns protein levels in KPC and PaTu 8988T cells treated with DON at the indicated concentrations for 24h. Tubulin was used as a loading control. Results are representative of 3 independent experiments. Densitometry quantifications are presented relative to the vehicle only condition and values were normalized to the loading control. b) Immunoblot assessing Asns protein levels in KPC and PaTu 8988T cells treated with 10μM DON with or without Asn supplementation for 24h. Tubulin was used as a loading control. Results are representative of 3 independent experiments. Densitometry quantifications are presented relative to the vehicle only condition and values were normalized to the loading control. c) Relative ASNS mRNA levels as assessed by qPCR in KPC or PaTu 8988T cells treated with 10μM DON with or without Asn supplementation for 24h. Data are presented relative to untreated control (Ctrl) and are representative of 3 independent experiments. Data are presented as mean ± SEM of n=3 replicates. For all statistical comparisons, P<0.0001. d) Immunoblot assessing Asns protein levels in KPC orthotopic tumors treated with vehicle (Control) or DON (10mg/kg) for 2 weeks. Tubulin was used as a loading control. e) Densitometry quantification of Asns protein relative to Tubulin in KPC orthotopic tumors from d). Data are presented as mean ± SEM of n=5 or n=6 tumor samples per group. P=0.0259. f) Immunohistochemical staining of Asns protein in KPC orthotopic tumors treated with vehicle control (Control) or DON (10mg/kg). Representative images of n=4 mice per group are shown. Scale bar, 100μm. g) Immunoblot assessing Asns protein levels in KPC cells transfected with non-targeting negative control siRNA (siNC) or two different hairpins targeting ASNS (siASNS#1 and siASNS#2) for 24h followed by 5μM DON treatment for 24h. h), i) Relative number of KPC cells transfected with siNC control, siASNS#1 or siASNS#2 following 5μM DON treatment for 24h. Representative images are shown (h). Quantification of crystal violet staining (i) where data is presented relative to untreated control and is representative of 3 independent experiments. Data are presented ± SEM of n=3 replicate wells. 5 μM DON: siNC vs siASNS#1, P=0.0021; siNC vs siASNS#2, P=0.0044. j) Immunoblot assessing Asns protein levels in KPC cells transfected with empty vector or ASNS-expressing vector for 48h. Tubulin was used as loading control. Results are representative of 3 independent experiments. Densitometry quantifications are presented relative to the vector only condition and values were normalized to the loading control. k) Relative number of vector control or ASNS-overexpressing KPC cells following treatment with DON. Quantification of crystal violet staining is shown relative to untreated control and is representative of 3 independent experiments. Data are presented ± SEM of n=3 replicate wells. 5 μM DON, P=0.0044. 10 μM DON, P=0.000997. 20 μM DON, P=0.0065. 40 μM DON, P=0.0005. Statistical significance was calculated using one-way ANOVA followed by Tukey’s multiple comparisons test (c) or unpaired two-tailed Student’s t test (e, i and k). *P<0.05, **P<0.01, ***P<0.001, ****P<0.0001.
Fig. 5.
Fig. 5.. ASNase synergizes with DON to suppress PDAC cell growth.
a-d) Relative number of KPC cells (a,b) or PaTu 8988T cells (c,d) treated with the indicated doses of DON in combination with L-asparaginase (ASNase, 0.5U/ml) for 24h. Cells were stained with crystal violet, representative images are shown. Quantification of crystal violet staining is shown relative to the untreated control and is representative of 3 independent experiments. The coefficient of drug interaction (CI) was calculated for each DON concentration (shown in graph). Data are presented ± SEM of n=3 replicate wells. KPC: For all statistical comparisons, P<0.0001. PaTu 8988T: 10 μM DON, P=0.0011; 20 μM DON, P=0.0038. e) Cell viability was assessed in 6 PDAC patient-derived organoids (PDOs) treated with vehicle (Ctrl), 50μM DON, 0.3 U/ml ASNase, or combination of DON + ASNase. The CI is indicated in the graphs. Graphs are ordered by decreasing organoid sensitivity to DON and accordingly numbered #1–6. Data are presented relative to untreated control and presented as mean ± SEM of n=5 replicate wells. f) Heatmap analysis of normalized gene expression (RNA-seq) of known DON-targeting enzymes in PDAC PDOs (#1–6) used in e. Legend indicates row Z-score. g) Correlation analysis between normalized gene expression of the indicated DON-targeting enzymes and DON viability ratio, used as measurement of PDO responsiveness to DON treatment. Statistical significance was calculated using unpaired two-tailed Student’s t test (b, d) or two-tailed Spearman correlation coefficient (g). **P<0.01, ****P<0.0001.
Fig. 6.
Fig. 6.. Suppression of PDAC metastasis by DON is enhanced by co-treatment with ASNase.
a) Tumor weights of PaTu 8988T orthotopic tumors from animals treated with vehicle (Ctrl), ASNase (3U/g), DON (5–10mg/kg), or combination of DON + ASNase for 3 weeks. Data are presented as mean ± SEM of n=13, n=8, n=12, or n=11 mice combined from 2 different cohorts. Ctrl vs ASNase, P=0.9994. Ctrl vs DON, P=0.0002. Ctrl vs DON+ASNase, P=0.0008. DON vs DON+ASNase, P=0.9935. b) Asn levels quantified by GC-MS in plasma of mice bearing PaTu 8988T orthotopic tumors. Data are presented as mean ± SEM of n=6, n=4, n=5, or n=6 mice per group. For all statistically significant comparisons, P<0.0001. Ctrl vs DON, P=0.1001. c) Quantification of intratumoral Asn levels in PaTu 8988T orthotopic tumors. Data are presented relative to no treatment control and quantification was calculated as amount of Asn per mg of tumor tissue. Data are presented as mean ± SEM of n=6, n=4, n=6, or n=6 mice per group. Ctrl vs ASNase, P=0.0007. Ctrl vs DON, P=0.5989. Ctrl vs DON+ASNase, P=0.0037. d) Quantification of the percentage of mice with PaTu 8988T-derived primary orthotopic tumors that presented with macrometastases in any organ (all sites). n=13, n=8, n=12, or n=11 mice per group. Ctrl vs DON, P=0.03. Ctrl vs DON+ASNase, P=0.0022. e) Characterization of macrometastases in animals with PaTu 8988T orthotopic tumors treated as indicated. Representative images of macrometastases in the different tissues are shown. The white arrows point to macrometastases. The number of mice with macrometastases in each organ site was quantified as indicated in the table. n=13, n=8, n=12, or n=11 mice per group. f) Quantification of the percentage of mice with PaTu 8988T-derived primary orthotopic tumors that presented with macrometastases to the intestines, liver, or diaphragm. n=13, n=8, n=12, or n=11 mice per group. Intestines: Ctrl vs DON, P=0.097; Ctrl vs DON+ASNase, P=0.011. Liver: Ctrl vs DON, P=0.047; Ctrl vs DON+ASNase, P=0.018. Diaphragm: Ctrl vs DON, P=0.673; Ctrl vs DON+ASNase, P=0.166. g) Quantification of the relative number of metastatic nodules in the intestines using image-based computation. The total number of tumor nodules per length of intestine was determined from one image per mouse. Data are presented as Min to Max box-and-whisker plot with median indicated at center line for n=13, n=8, n=12, or n=11 mice per group. Ctrl vs ASNase, P=0.536. Ctrl vs DON+ASNase, P=0.0011. DON vs DON+ASNase, P=0.029. h) Quantification of metastatic tumors in the liver using image-based computation. The total area of tumor tissue per area of liver tissue was determined. Data are presented as Min to Max box-and-whisker plot with median indicated at center line for n=26, n=16, n=24, or n=22 images per condition from a total of 13, 8, 12 or 11 mice per group. Ctrl vs ASNase, P=0.665. Ctrl vs DON, P=0.034. Ctrl vs DON+ASNase, P=0.0013. DON vs DON+ASNase, P=0.045. Statistical significance was calculated using one-way ANOVA followed by Tukey’s multiple comparisons (a-c), two-tailed chi-square test (d, f) or unpaired two-tailed Student’s t test (g, h). *P<0.05, **P<0.01, ***P<0.001, ****P<0.0001, ns=not significant.

References

    1. Son J et al. Glutamine supports pancreatic cancer growth through a KRAS-regulated metabolic pathway. Nature 496, 101–105 (2013). 10.1038/nature12040 - DOI - PMC - PubMed
    1. Lyssiotis CA, Son J, Cantley LC & Kimmelman AC Pancreatic cancers rely on a novel glutamine metabolism pathway to maintain redox balance. Cell Cycle 12, 1987–1988 (2013). 10.4161/cc.25307 - DOI - PMC - PubMed
    1. Cluntun AA, Lukey MJ, Cerione RA & Locasale JW Glutamine Metabolism in Cancer: Understanding the Heterogeneity. Trends Cancer 3, 169–180 (2017). 10.1016/j.trecan.2017.01.005 - DOI - PMC - PubMed
    1. Zhang J, Pavlova NN & Thompson CB Cancer cell metabolism: the essential role of the nonessential amino acid, glutamine. Embo J 36, 1302–1315 (2017). 10.15252/embj.201696151 - DOI - PMC - PubMed
    1. Kamphorst JJ et al. Human pancreatic cancer tumors are nutrient poor and tumor cells actively scavenge extracellular protein. Cancer Res 75, 544–553 (2015). 10.1158/0008-5472.CAN-14-2211 - DOI - PMC - PubMed

Publication types