Clinical Trial
. 2023 Oct;29(10):2559-2569.
doi: 10.1038/s41591-023-02598-9. Epub 2023 Oct 9.

ctDNA response after pembrolizumab in non-small cell lung cancer: phase 2 adaptive trial results

Affiliations
Clinical Trial

ctDNA response after pembrolizumab in non-small cell lung cancer: phase 2 adaptive trial results

Valsamo Anagnostou et al. Nat Med. 2023 Oct.

Abstract

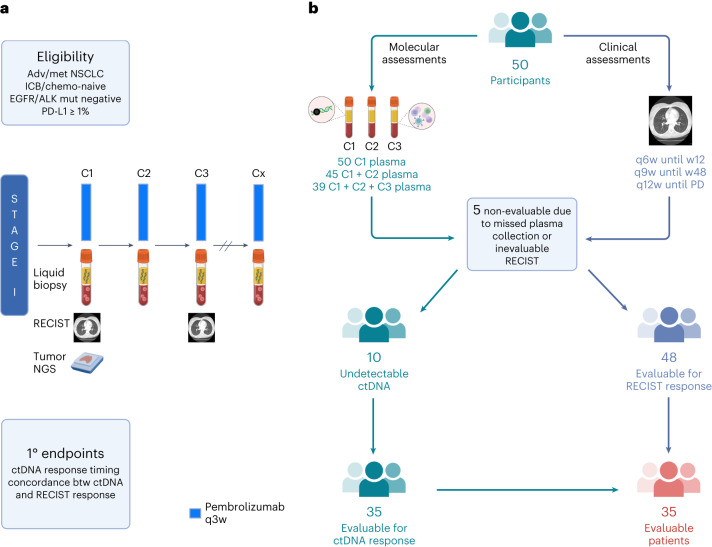
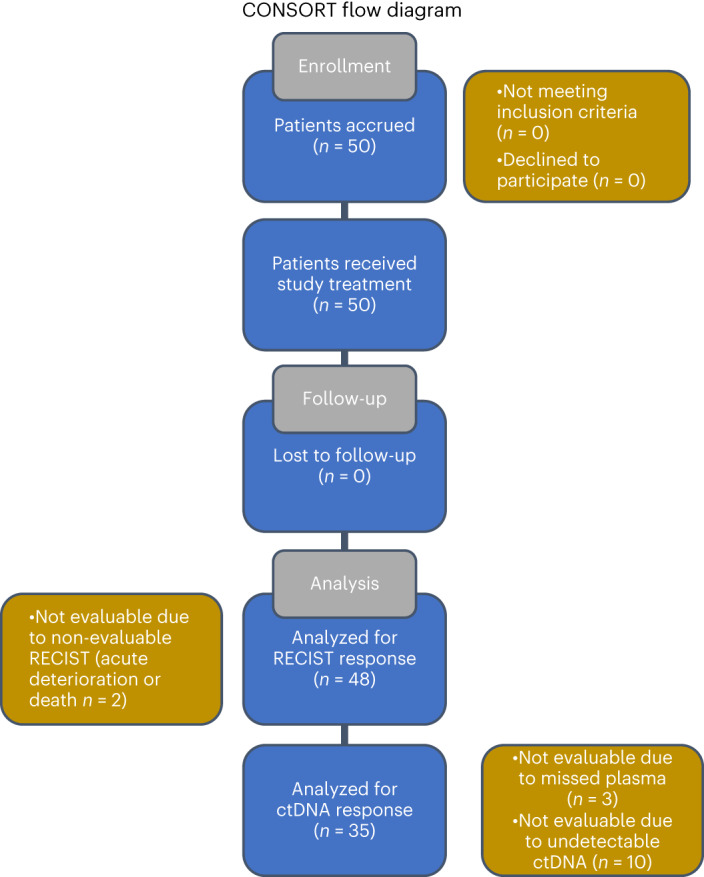
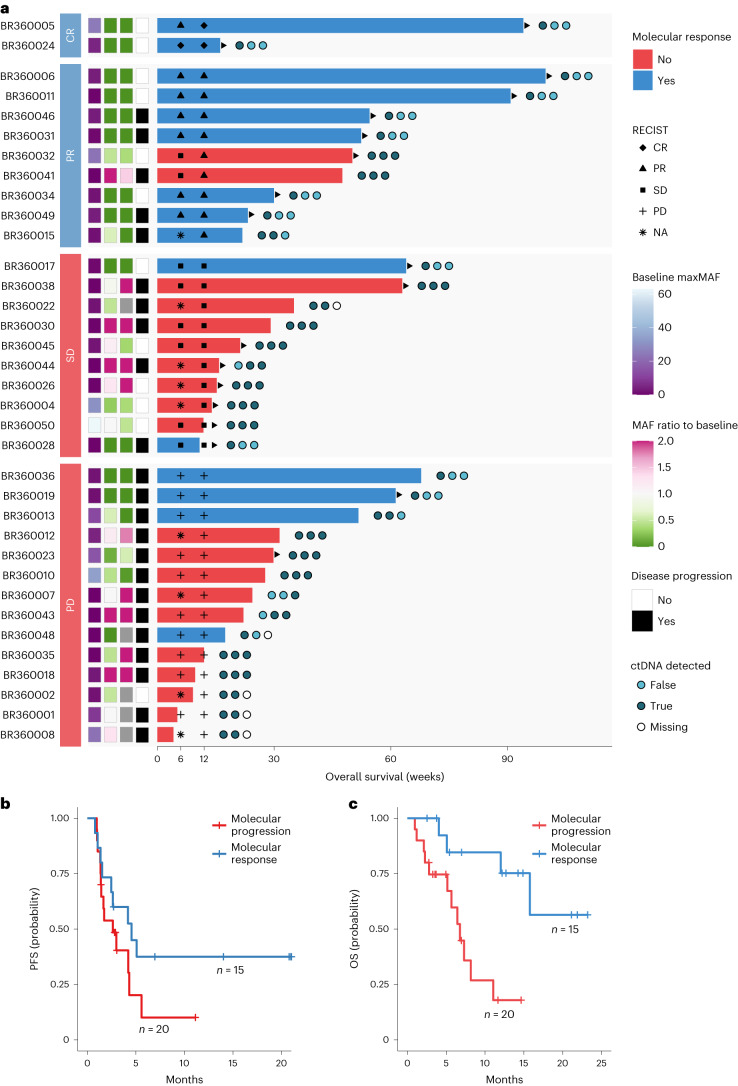
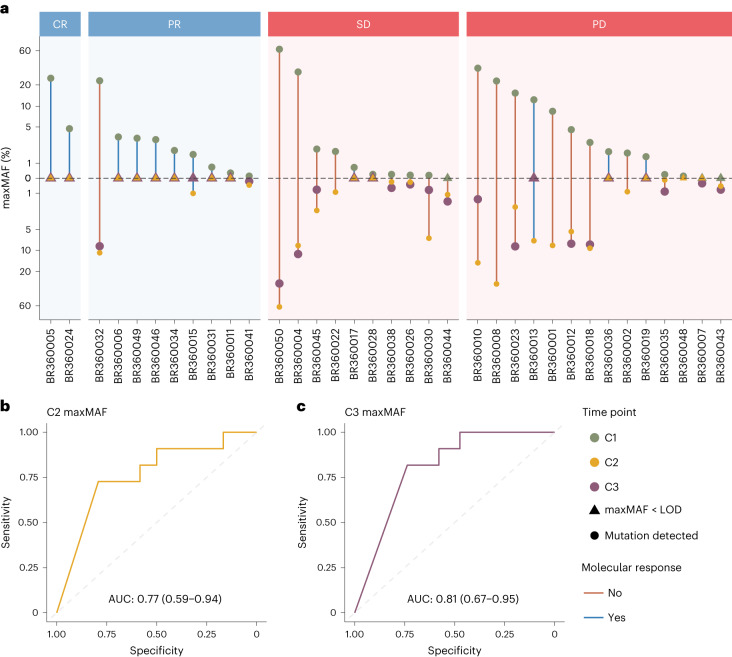
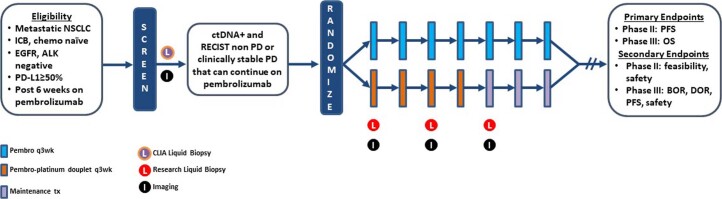
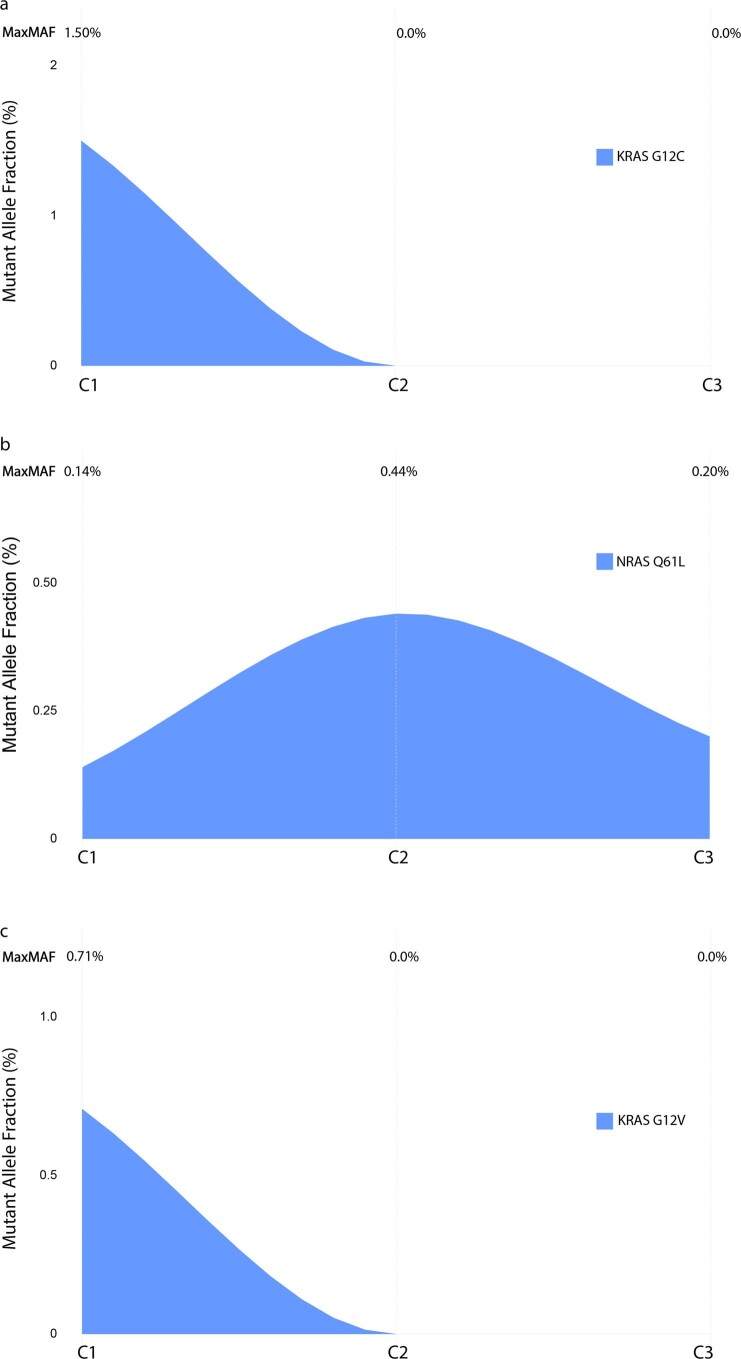
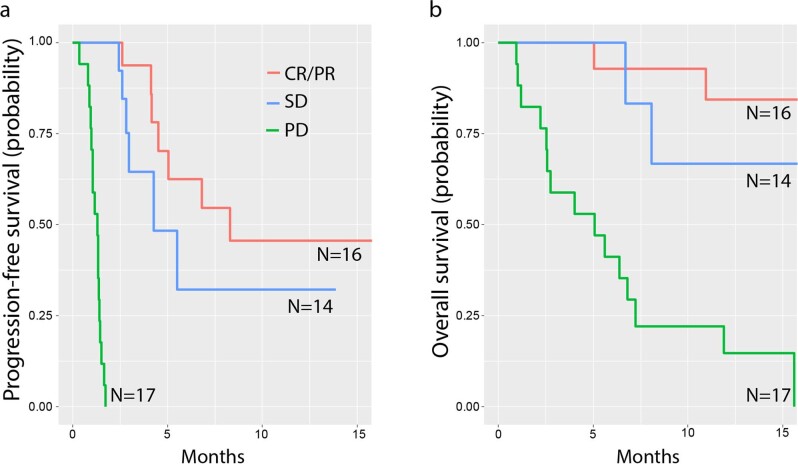
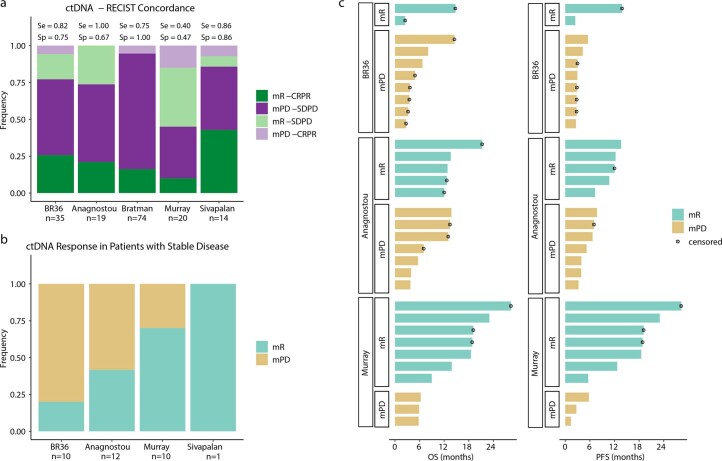
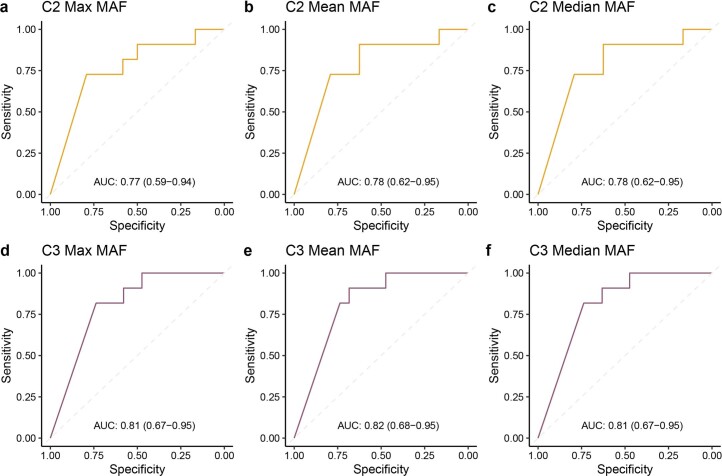
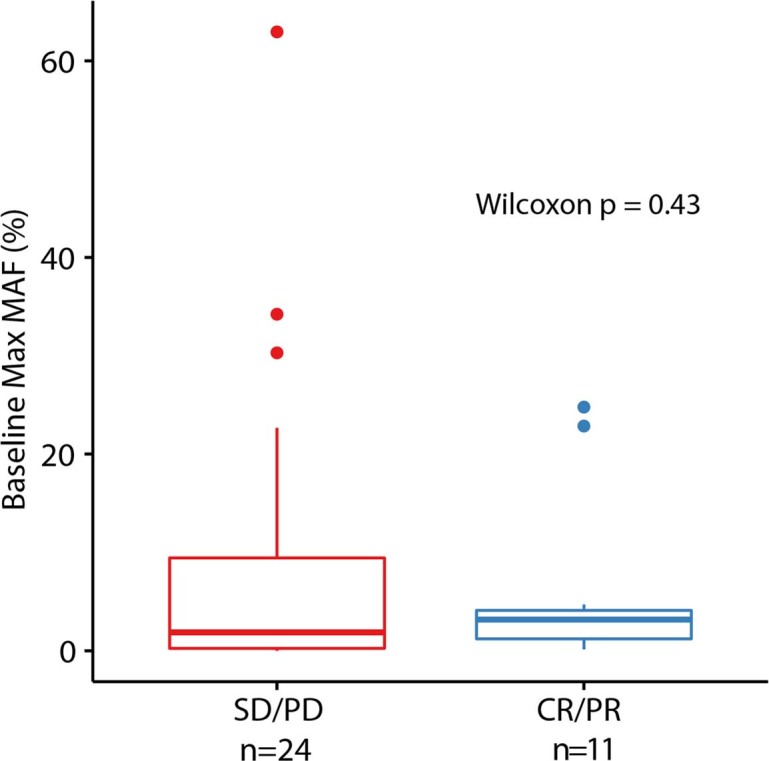
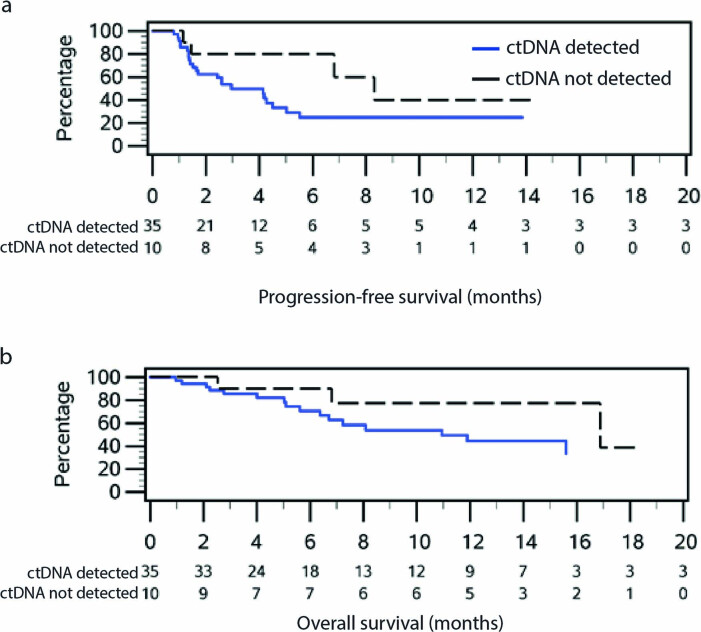
Circulating tumor DNA (ctDNA) has shown promise in capturing primary resistance to immunotherapy. BR.36 is a multi-center, randomized, ctDNA-directed, phase 2 trial of molecular response-adaptive immuno-chemotherapy for patients with lung cancer. In the first of two independent stages, 50 patients with advanced non-small cell lung cancer received pembrolizumab as standard of care. The primary objectives of stage 1 were to ascertain ctDNA response and determine optimal timing and concordance with radiologic Response Evaluation Criteria in Solid Tumors (RECIST) response. Secondary endpoints included the evaluation of time to ctDNA response and correlation with progression-free and overall survival. Maximal mutant allele fraction clearance at the third cycle of pembrolizumab signified molecular response (mR). The trial met its primary endpoint, with a sensitivity of ctDNA response for RECIST response of 82% (90% confidence interval (CI): 52-97%) and a specificity of 75% (90% CI: 56.5-88.5%). Median time to ctDNA response was 2.1 months (90% CI: 1.5-2.6), and patients with mR attained longer progression-free survival (5.03 months versus 2.6 months) and overall survival (not reached versus 7.23 months). These findings are incorporated into the ctDNA-driven interventional molecular response-adaptive second stage of the BR.36 trial in which patients at risk of progression are randomized to treatment intensification or continuation of therapy. ClinicalTrials.gov ID: NCT04093167 .


Conflict of interest statement

V.A. receives research funding to Johns Hopkins University from AstraZeneca and Personal Genome Diagnostics; has received research funding to Johns Hopkins University from Bristol-Myers Squibb and Delfi Diagnostics in the past 5 years; and is an advisory board member for AstraZeneca and NeoGenomics. V.A is an inventor on patent applications (63/276,525, 17/779,936, 16/312,152, 16/341,862, 17/047,006 and 17/598,690) submitted by Johns Hopkins University related to cancer genomic analyses, ctDNA therapeutic response monitoring and immunogenomic features of response to immunotherapy, which have been licensed to one or more entities. Under the terms of these license agreements, the university and inventors are entitled to fees and royalty distributions. N.N. is an inventor on patent application 17/598,690 submitted by Johns Hopkins University related to genomic features of response to immunotherapy. S.L. receives research funding to his institution from Bristol-Myers Squibb, Merck, GlaxoSmithKline, 23andme, SignalChem, AstraZeneca, Treadwell Therapeutics and Boehringer Ingelheim; serves on the advisory boards of Sanofi, Bayer and Pfizer; and holds royalties from UpToDate. M.S. is an employee of Personal Genome Diagnostics (LabCorp) and holds equity in LabCorp. R.A.J. has participated on advisory boards for AbbVie, Amgen, AstraZeneca, Bayer, Bristol-Myers Squibb, EMD Serono, Fusion Pharmaceuticals, Jazz Pharmaceuticals, Eli Lilly, Merck Sharp & Dohme, Novartis, Pfizer, Roche Canada, Sanofi/Regeneron and Takeda; has received honoraria from Amgen, AstraZeneca, Bristol-Myers Squibb, Merck Sharp & Dohme, Novartis Pharmaceuticals Canada and Roche Canada; and has received research funding from AstraZeneca/MedImmune, Bristol-Myers Squibb, Debiopharm Group, Merck Sharp & Dohme, Novartis and Turnstone Bio. A.S.F. receives research funding from AstraZeneca and has served on advisory boards for Novartis. J.B. receives institutional grant support from Bristol-Myers Squibb and AstraZeneca; is an advisory board member for Bristol-Myers Squibb, Merck, AstraZeneca and Regeneron; and serves as a Data and Safety Monitoring Board member for Sanofi, GlaxoSmithKline and Johnson & Johnson. P.O.G. reports research/clinical trial funding from Stand Up to Cancer Canada–Canadian Cancer Society Breast Cancer Dream Team, AstraZeneca, Merck, BioAtla, Novartis and the Cancer Research Institute. A.S. reports research funding from Genentech/Roche, AstraZeneca and Bristol-Myers Squibb and serves as a consultant for Amgen, AstraZeneca and Genentech/Roche. P.A.B. has participated on advisory boards for Abbvie, Mirati, AstraZeneca and Boehringer Ingelheim and has received honoraria from Merck, Pfizer and Eli Lilly. B.L. is a consultant for AstraZeneca, Daiichi Sankyo, Janssen, Bristol-Myers Squibb, Novartis, Genentech, Eli Lilly, Pfizer, Guardant 360, Mirati, Amgen and Foundation One. J.D. reports research grants to her institution from Pfizer, Merck, Bristol-Myers Squibb, AstraZeneca, Seagen and Inivata. All other authors declare no conflicts of interest.

Figures

Fig. 1
Fig. 1. BR.36 trial schema.
a, The first stage of the BR.36 trial enrolled patients with advanced/metastatic NSCLC who did not harbor clinically actionable genomic alterations in EGFR or ALK and had a PD-L1 expression level of ≥1%. Patients received pembrolizumab as per local standard of care, and RECIST radiographic response assessments were performed every 6 weeks until week 12 and at longer intervals thereafter (Methods). Serial liquid biopsies were collected before treatment administration on C1D1 (baseline), C2D1 (3 weeks) and C3D1 (6 weeks), followed by ctDNA molecular response assessments at these timepoints. The primary endpoints of the trial were to determine the optimal timepoint of ctDNA molecular response and validate the concordance of ctDNA molecular response with radiographic RECIST version 1.1 response. b, BR.36 reached its target enrollment of 50 patients; for each individual, serial radiographic assessments and liquid biopsy analyses were performed. C1D1 plasma was collected for all 50 patients; C1D1 and C2D1 plasma samples were collected for 45 patients; and plasma samples were collected for all three timepoints for 39 patients. Five patients were deemed not evaluable because of missed plasma collection or non-evaluable RECIST assessments. Of the 45 evaluable patients, 10 had undetectable ctDNA at all timepoints (no tumor-specific plasma variants detected), resulting in 35 patients with evaluable ctDNA and RECIST responses.
Fig. 2
Fig. 2. CONSORT flow diagram.
Of the 50 patients enrolled, two were non-evaluable for RECIST response because of symptomatic progression/acute deterioration/death during cycle 1 without imaging (BR360020 and BR360021). The remaining 96% (48/50) of patients in the BR.36 study were evaluable for radiographic response assessment, which supports the feasibility of CT restaging in this population. Of the 48 patients with evaluable radiographic responses, three were non-evaluable because of missed plasma collection (BR360014, BR360016 and BR360029) due to withdrawn consent, rapid disease progression/death and protocol violation, respectively. Of the 45 patients evaluable for both radiographic and ctDNA responses, 22.2% (10/45) had undetectable ctDNA, which is consistent with previously reported ctDNA undetectable rate in patients with metastatic NSCLC (Anagnostou et al.) and was within the CI of the undetectable ctDNA rate that we factored in the sample size calculations for the BR.36 stage 1 cohort. adv, advanced; btw, between; met, metastatic; mut, mutation; q6w, once every 6 weeks; q9w, once every 9 weeks; q12w, once every 12 weeks; w, week.
Fig. 3
Fig. 3. Overview of plasma variants detected by NGS.
The total number, distribution and origin of variants detected by serial liquid biopsy analyses are shown for 45 patients with at least two serial liquid biopsies performed. A WBC DNA-informed approach allowed for classification of plasma variants by cellular origin and revealed that 17% of the plasma variants detected (14/82 variants) could be attributed to clonal hematopoiesis mutations. Frequently mutated genes included TP53, KRAS, ARID1A, ATM, NRAS and PDGFRA, which is consistent with the reported genomic landscape of NSCLC. Alteration prevalence for each gene is listed on the right. The mutation count per sample is displayed at the top, followed by rows indicating sample timepoint and ctDNA molecular response. Ten patients had undetectable tumor-derived mutations at all timepoints, rendering 35 patients evaluable for ctDNA molecular response. NE, not evaluable.
Fig. 4
Fig. 4. Representative ctDNA kinetics patterns.
ad, We identified four patterns of ctDNA kinetics: 13 patients showed ctDNA maxMAF clearance at C2D1, as shown here for patient BR360006 (a); two patients showed ctDNA maxMAF clearance at C3D1, as shown here for patient BR360015 (b); two patients had ctDNA reduction >85% but <100%, as shown here for patient BR360010 (c); and 18 patients showed ctDNA persistence throughout the timepoints analyzed, as shown here for patient BR360004 (d). Timepoints (C1D1, C2D1 and C3D1) are shown at the top of each panel, alongside the maxMAF of tumor-derived variants detected at each timepoint. Stacked area plots represent MAFs of individual tumor-specific variants as measured in liquid biopsies at baseline and on-therapy timepoints. Of note, the plot does not reflect the unknown hierarchical structure of tumor subclones harboring mutations, and, as such, the height of the area plot indicates the sum of MAFs from all mutations at each timepoint.
Fig. 5
Fig. 5. Analyses of PFS and OS by ctDNA molecular response.
a, Swimmer plot depicting the timing of radiographic response assessment, molecular response trajectory and OS for each evaluable patient in the BR.36 stage 1 cohort. The patients are grouped by radiographic response category and ordered by OS within each group, where the bar color indicates the assigned molecular response. The circles to the right of each bar depict detection of ctDNA in the three liquid biopsy samples analyzed from timepoints C1D1, C2D1 and C3D1, from left to right, respectively. The three annotation columns to the left of the bars indicate the value of maxMAF in the baseline sample and the ratio of maxMAF in the C2 and C3 timepoints compared to the baseline. Gray tiles mark timepoints with no sample available for analysis. Triangles at the edge of survival intervals indicate ongoing follow-up. b,c, Patients with ctDNA mR had a longer PFS and OS compared to patients with mPD (5.03 months versus 2.6 months and not reached versus 7.23 months for PFS and OS, respectively; HR = 0.55, 95% CI: 0.27–1.13 and HR = 0.16, 95% CI: 0.05–0.50 for PFS and OS, respectively). NA, not applicable.
Fig. 6
Fig. 6. Depth of ctDNA response in association with RECIST radiographic response.
a, All patients with complete radiographic response (CR) and six of nine patients with partial response (PR) showed ctDNA clearance (mR) during on-therapy timepoints (C2D1 and/or C3D1). In contrast, for patients with stable disease (SD) or progressive disease (PD), ctDNA clearance was much less frequent (two of 10 patients with SD and four of 14 patients with PD). The upper half of the vertical axis indicates the maxMAF observed in the baseline sample (green), whereas the lower half depicts the maxMAF in the on-therapy timepoints. maxMAF values are pseudo-log transformed for improved visual clarity. b,c, At each on-therapy timepoint, the fractional change in maxMAF compared to the baseline sample was used to predict the radiographic response at 12 weeks. Receiver operating characteristic (ROC) curves are shown, and point estimates for AUC along with 95% CIs are indicated. Change in maxMAF at C2D1 predicted RECIST response with an AUC of 0.77 (95% CI: 0.59–0.94), whereas change in maxMAF at C3D1 predicted RECIST response with an AUC of 0.81 (95% CI: 0.67–0.95). The dot sizes do not code for any data element displayed; rather, these are selected to visually maximize clarity, such that overlapping marks from distinct timepoints are not blocked and can be visually distinguished. LOD, limit of detection.
Extended Data Fig. 1
Extended Data Fig. 1. Trial schema for the interventional second stage of the BR.36 study.
Abbreviations: NSCLC; non-small cell lung cancer, ICB; immune checkpoint blockade, chemo; chemotherapy, pembro; pembrolizumab, wk; week, PD; disease progression.
Extended Data Fig. 2
Extended Data Fig. 2. Intersection of variants detected by plasma, WBC DNA and tumor next-generation sequencing for the BR.36 study participants.
UpSet plot for all plasma mutations detected (n = 82). From left to right the vertical bars represent the number of mutations that were detected only in the plasma (n = 55), detected in plasma and matched tumor (n = 18), detected in plasma and matched WBC DNA NGS (n = 8) and reported in plasma, tumor and matched WBC DNA NGS (n = 1). The horizontal bars on the right represent the total number of plasma mutations (n = 82), total plasma mutations in the tumor (n = 19) and total plasma mutations detected in the WBC DNA samples (n = 9).
Extended Data Fig. 3
Extended Data Fig. 3. ctDNA trends for patients with discordant molecular and radiographic RECIST responses.
(a) For patient BR360019, clearance of KRAS G12C at C2D1 signified ctDNA molecular response, which was discordant with the RECIST radiographic assessment of disease progression. (b) In contrast, patient BR360041 showed persistence of NRAS Q61L at C3D1 and was as such classified in the molecular disease progression category that while discrepant with a RECIST assessment of partial response, more accurately reflected a short progression-free survival of 1.47 months. (c) Notably, for patient BR360017 that had radiographically stable disease, clearance of KRAS G12V at C2D1 signified ctDNA molecular response and accurately captured the patient’s ongoing progression-free and overall survival of >13 months.
Extended Data Fig. 4
Extended Data Fig. 4. Progression-free and overall survival prognostication based on radiographic RECIST response for all patients on BR.36 with evaluable RECIST responses.
RECIST response at 12 weeks less clearly distinguished patients with complete/partial responses compared to patients with stable disease for progression-free (8.31 vs 4.27 months, shown in panel a) and overall survival (not reached vs 16.89 months, shown in panel b).
Extended Data Fig. 5
Extended Data Fig. 5. Heterogeneity of radiographic stable disease with respect to ctDNA response and long-term clinical outcomes.
To expand the post hoc analyses of differential outcomes based on ctDNA response for patients with radiographically stable disease on immune checkpoint blockade, we computed the concordance between radiographic and ctDNA responses from previously reported IO cohorts together with BR.36 (Anagnostou et al., Cancer Research, 2019, Bratman et al., Nature Cancer, 2020, Murray et al., Cancer Research, 2021, Sivapalan et al., Clin Cancer Research, 2023). (a) These analyses showed that the concordance between radiographic (CR/PR vs SD/PD) and ctDNA responses depends on the fraction of patients with stable disease, a group that shows heterogeneity with respect to ctDNA responses across all cohorts analyzed (b). (c) Looking at differences in progression-free and overall survival within the radiographically stable patients across studies, ctDNA response accurately captured longer progression-free and overall survival (Anagnostou et al.: median OS = 13.6 for mR vs 13.7 for mPD, logrank p > 0.05; median PFS = 12.3 for mR vs 5.2 for mPD, logrank p = 9.8e-3. Murray et al.: median OS = 23.0 for mR vs 5.9 for mPD, logrank p = 8.0e-4; median PFS = 23.01 for mR vs 2.7 for mPD, logrank p = 4.8e-3). Stable disease annotation was not available for patients from Bratman et al. cohort, while only one patient who received immunotherapy had stable disease in the Sivapalan et al. cohort, resulting in exclusion of these cohorts from panels b and c. Median survival estimates were derived using survival fit function.
Extended Data Fig. 6
Extended Data Fig. 6. ROC curves for ctDNA change from C1 to C2 and C1 to C3 and RECIST response.
MAF dynamics, computed from C1D1 to each on-therapy time point, were used to predict the radiographic response at 12 weeks by analyzing the maximum (a, d), mean (b,e), and median (c, f) MAF across all observed tumor-derived mutations. At each on-therapy time point, the change in MAF measure (maximum, mean, or median) compared to the baseline sample was calculated, and receiver operating characteristic (ROC) curves were drawn to assess performance. These analyses supported a slightly higher analytical performance of ctDNA molecular response at C3D1, with no significant differences noted when maximal, mean or median mutant allele frequencies of tumor-derived mutations were used to measure circulating tumor burden. Area under the curve along with 95% confidence intervals are reported.
Extended Data Fig. 7
Extended Data Fig. 7. Baseline levels of circulating tumor burden differences based on radiographic RECIST response.
There were no differences in MaxMAF values between patients with radiographic SD/PD (n = 24, non-responder group) compared to patients with radiographic CR/PR (n = 11, responder group) as assessed by the Wilcoxon test (two sided p = 0.43). Box plots depict the median value and hinges correspond to the first and third quartiles. The whiskers extend from the corresponding hinge to the furthest value within 1.5 * the interquartile range from the hinge.
Extended Data Fig. 8
Extended Data Fig. 8. Survival outcomes by detectable vs. undetectable ctDNA status at baseline.
(a) Patients with undetectable ctDNA at baseline (n = 10) had numerically longer PFS compared to patients with detectable ctDNA (n = 35, median PFS 8.31 vs 2.96 months). (b) Similar trends were noted for overall survival, such that patients with detectable ctDNA at baseline (n = 10) had numerically shorter OS compared to individuals with undetectable ctDNA at baseline (n = 35, median OS 10.94 vs. 16.89 months).

References

    1. Sivapalan, L. et al. Liquid biopsy approaches to capture tumor evolution and clinical outcomes during cancer immunotherapy. J. Immunother. Cancer 11, e005924 (2023). - PMC - PubMed
    1. Stewart, M. D. & Anagnostou, V. Liquid biopsies coming of age: biology, emerging technologies, and clinical translation—an introduction to the JITC expert opinion special review series on liquid biopsies. J. Immunother. Cancer11, e006367 (2023). - PMC - PubMed
    1. Anagnostou V, et al. Immuno-oncology trial endpoints: capturing clinically meaningful activity. Clin. Cancer Res. 2017;23:4959–4969. doi: 10.1158/1078-0432.CCR-16-3065. - DOI - PMC - PubMed
    1. Anagnostou V, Landon BV, Medina JE, Forde P, Velculescu VE. Translating the evolving molecular landscape of tumors to biomarkers of response for cancer immunotherapy. Sci. Transl. Med. 2022;14:eabo3958. doi: 10.1126/scitranslmed.abo3958. - DOI - PMC - PubMed
    1. Anagnostou V, Bardelli A, Chan TA, Turajlic S. The status of tumor mutational burden and immunotherapy. Nat. Cancer. 2022;3:652–656. doi: 10.1038/s43018-022-00382-1. - DOI - PubMed

Publication types

MeSH terms

Substances

Associated data