. 2023 Oct 9;24(1):225.
doi: 10.1186/s13059-023-03072-y.

scIBD: a self-supervised iterative-optimizing model for boosting the detection of heterotypic doublets in single-cell chromatin accessibility data

Affiliations

scIBD: a self-supervised iterative-optimizing model for boosting the detection of heterotypic doublets in single-cell chromatin accessibility data

Wenhao Zhang et al. Genome Biol. .

Abstract

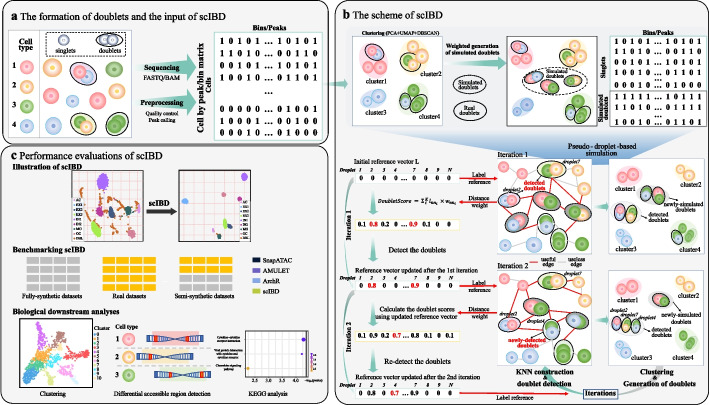
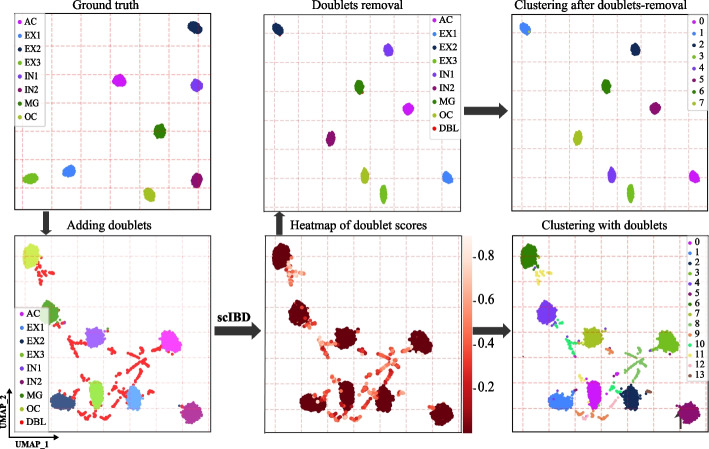
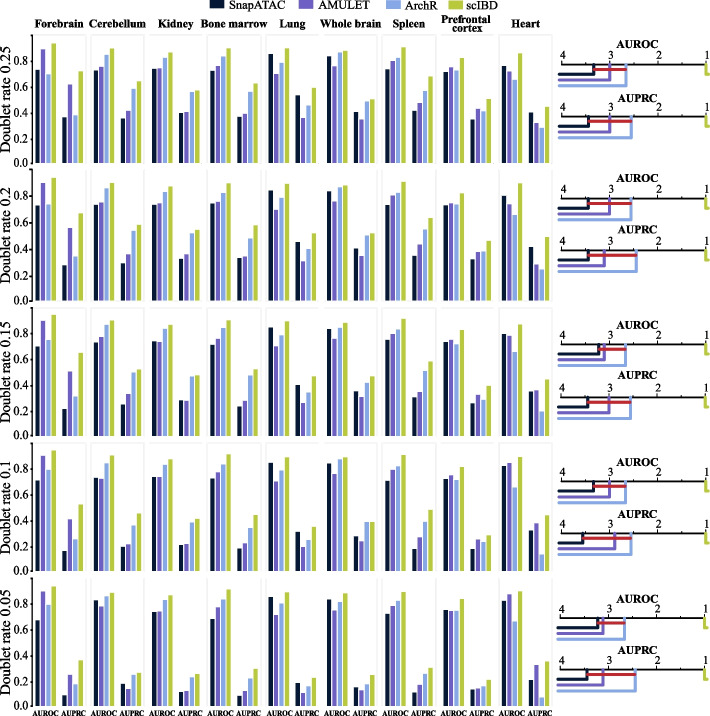
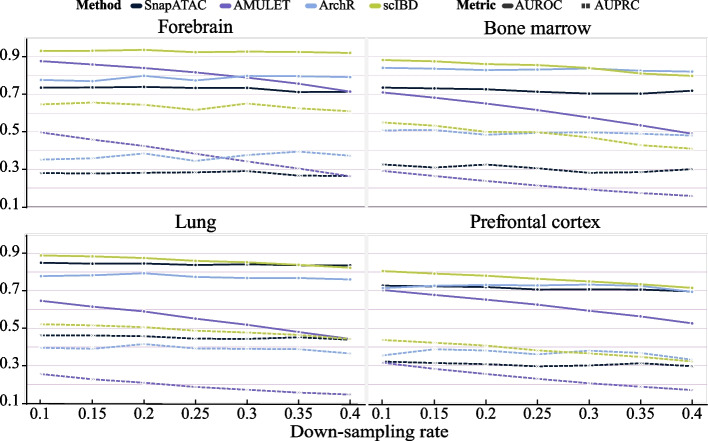
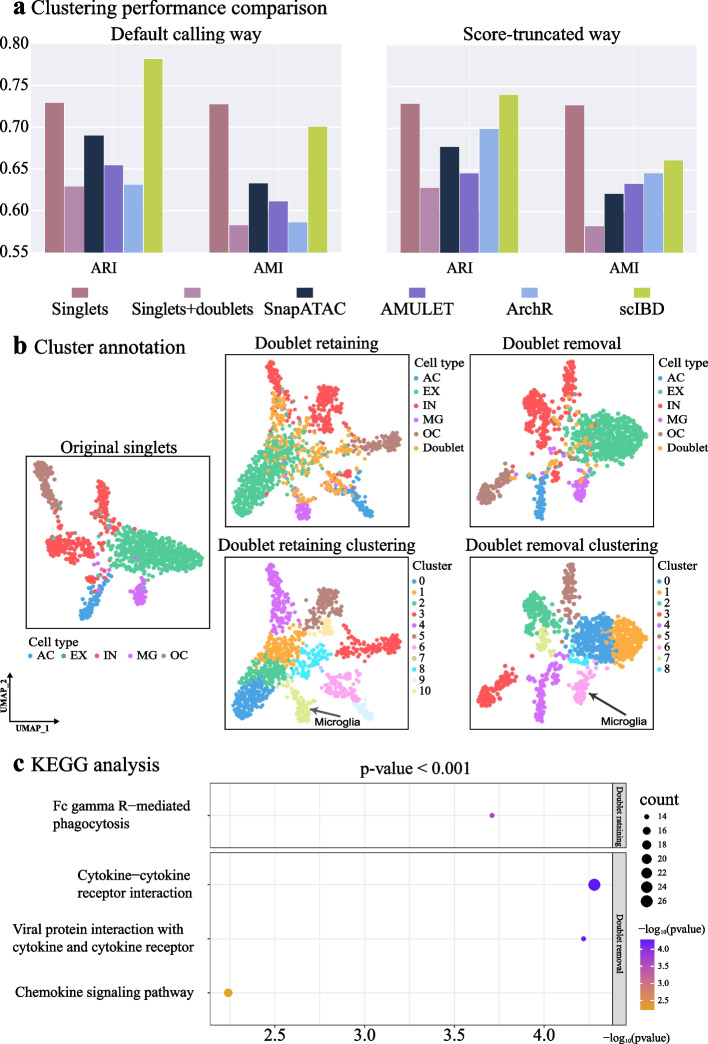
Application of the widely used droplet-based microfluidic technologies in single-cell sequencing often yields doublets, introducing bias to downstream analyses. Especially, doublet-detection methods for single-cell chromatin accessibility sequencing (scCAS) data have multiple assay-specific challenges. Therefore, we propose scIBD, a self-supervised iterative-optimizing model for boosting heterotypic doublet detection in scCAS data. scIBD introduces an adaptive strategy to simulate high-confident heterotypic doublets and self-supervise for doublet-detection in an iteratively optimizing manner. Comprehensive benchmarking on various simulated and real datasets demonstrates the outperformance and robustness of scIBD. Moreover, the downstream biological analyses suggest the efficacy of doublet-removal by scIBD.

Keywords: Chromatin accessibility; Detection; Doublets; Single-cell.


Conflict of interest statement

The authors declare no competing interests.

Figures

Fig. 1
Fig. 1
Overview of scIBD. a The formation of doublets in droplet-based scCAS. The input of scIBD is the cell by bin/peak matrix, which supports customized quality control and peak calling. b The scheme of scIBD. We present a pseudo-droplet simulation strategy where clustering is firstly performed, and then a bunch of artificial doublets are simulated, whose profiles are the union of the droplet profiles picked weighted by clusters. A reference vector of raw droplets is initialized with all values set to zero, indicating that all droplets have no contributions for detecting doublets primordially. In each iteration, scIBD computes doublet scores for all raw droplets based on their similarity to their nearest neighbors (KNN graph) and their previous scores (reference vector). The droplets with high doublet scores are detected as doublets, which no longer participate in the clustering in the following iterations. The artificial doublets are always re-created based on the newly clustering results in the current iteration. The reference vector is updated using the normalized doublet scores, which then influences the detection of doublets by participating in doublet score aggregating in the following iterations. c The performance evaluations of scIBD. We comprehensively benchmarked scIBD on three categories of datasets, including fully-synthetic, real, and semi-synthetic datasets derived from various scCAS data. Downstream biological analyses were conducted to further demonstrate the efficacy of scIBD
Fig. 2
Fig. 2
The overall illustration of scIBD on the fully-synthetic dataset. We visualized the fully-synthetic dataset in UMAP to illustrate the impact of doublets and the efficacy of doublet-removal by scIBD
Fig. 3
Fig. 3
Performance evaluation on real HMC datasets. a The UMAP visualization of the two datasets where the droplets are colored by Demuxlet-annotated labels, and the doublet scores produced by scIBD, respectively. b The AUROC and AUPRC comparison with baseline methods. c The performance comparison on the datasets sub-sampled from the original sets
Fig. 4
Fig. 4
Performance evaluation on the semi-synthetic datasets with different doublet ratios. Different simulation ratios of doublets ranging from 0.05 to 0.25 with an interval of 0.05, are implemented on nine datasets. The histograms and the critical difference diagram over the datasets demonstrate the outperformance of scIBD
Fig. 5
Fig. 5
Performance evaluation on the semi-synthetic datasets where doublets have different numbers of captured reads. Based on the semi-synthetic datasets, the reads used to form artificial doublets are down-sampled with a ratio ranging from 0.1 to 0.4 with an interval of 0.05. The AUROC (solid lines) and the AUPRC (dotted lines) show the trend of performance with the reads decrease of doublets
Fig. 6
Fig. 6
Performance evaluation on the rigorously quality-controlled semi-synthetic datasets of Islets and PBMC. a The AUROC and AUPRC comparison of scIBD and the baseline methods on the rigorously quality-controlled datasets of Islet1, Islet2, and PBMC, where the ground-truth singlets were strictly selected. b The performance evaluation on the read-down-sampled Islet1 and PBMC datasets. The reads of Islet1 dataset were down-sampled with a ratio ranging from 0.1 to 0.4 with an interval of 0.1; and the reads of PBMC dataset were down-sampled with a ratio ranging from 0.1 to 0.5 with an interval of 0.2. The AUROC (solid lines) and the AUPRC (dotted lines) show the trend of performance with the decrease in sequencing depth
Fig. 7
Fig. 7
Downstream biological analyses. a The performance comparison on clustering picked by the removal of doublets. b Using ground-truth labels (upper) as the reference to annotate the microglia cluster (lower), and a series of downstream biological analyses were performed. c The KEGG enrichment results using the differential accessible regions detected on the doublet-retaining dataset and the doublet-removal dataset, respectively
Fig. 8
Fig. 8
The specific strategies applied in scIBD. a Two cases that are suitable for different KNN-graphing strategies. Left panel illustrates the case where different cell types are distinguishable in UMAP based on PCA embeddings, and the doublets are also distinctly apart from the singlets, PCA-based graphing is applied. Right panel illustrates the case where the distinction of the cells is not clear by following PCA-based strategy, PCoA-based graphing is applied to further separate the doublets from singlets. b The distribution plot of the doublet scores during the iteration process. We separately show the doublet score distributions of three parts, the detected doublets in former iterations, the simulated doublets in each iteration, and the unlabeled droplets in raw sets. In each iteration, we aim at separating doublets from the unlabeled droplets. The doublet scores of the unlabeled droplets are modeled by the right side of a standard Gaussian. The scores of the simulated doublets (yellow) are used as the reference to obtain the threshold to determine the doublets in the unlabeled droplets. The scores of the doublets detected in former iterations (red) mostly locate at high intervals, showing their high confidence as the doublets

Similar articles

References

    1. Stuart T, Satija R. Integrative single-cell analysis. Nat Rev Genetics. 2019;20:257–272. - PubMed
    1. Zilionis R, Nainys J, Veres A, Savova V, Zemmour D, Klein AM, Mazutis L. Single-cell barcoding and sequencing using droplet microfluidics. Nat Protocols. 2017;12:44–73. - PubMed
    1. Guo MT, Rotem A, Heyman JA, Weitz DA. Droplet microfluidics for high-throughput biological assays. Lab Chip. 2012;12:2146–2155. - PubMed
    1. Kang HM, Subramaniam M, Targ S, Nguyen M, Maliskova L, McCarthy E, Wan E, Wong S, Byrnes L, Lanata CM, et al. Multiplexed droplet single-cell RNA-sequencing using natural genetic variation (vol 36, pg 89, 2018) Nat Biotechnol. 2020;38:1356–1356. - PubMed
    1. Wolock SL, Lopez R, Klein AM. Scrublet: computational identification of cell doublets in single-cell transcriptomic data. Cell Syst. 2019;8:281–291. - PMC - PubMed

Publication types

LinkOut - more resources