. 2023 Dec;29(23):6606-6619.
doi: 10.1111/gcb.16881. Epub 2023 Oct 10.

Climate change affects the distribution of diversity across marine food webs

Affiliations

Climate change affects the distribution of diversity across marine food webs

Murray S A Thompson et al. Glob Chang Biol. 2023 Dec.

Abstract

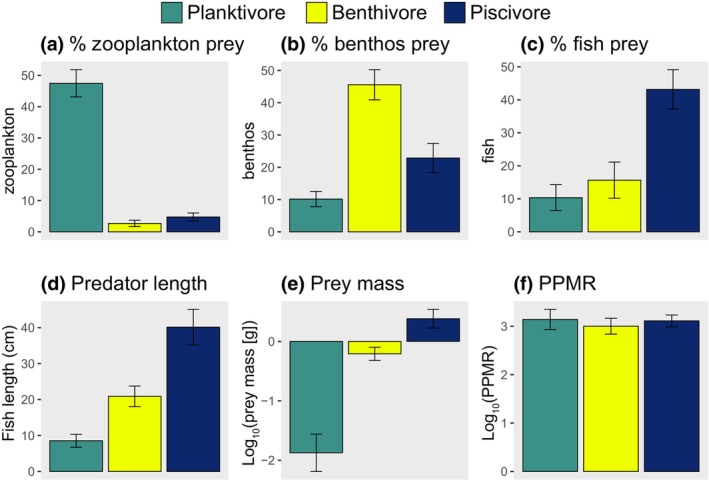
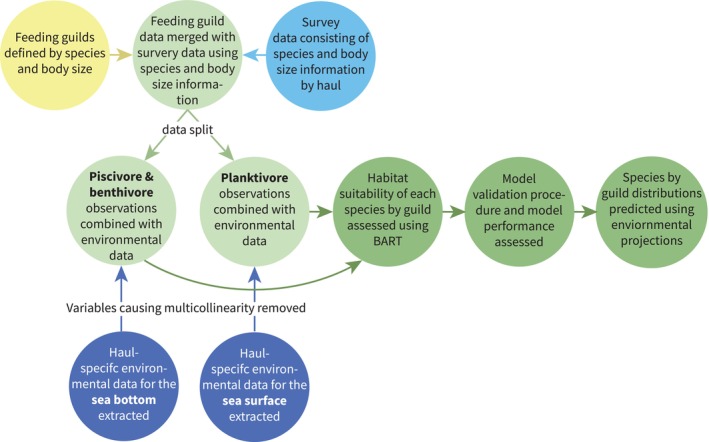
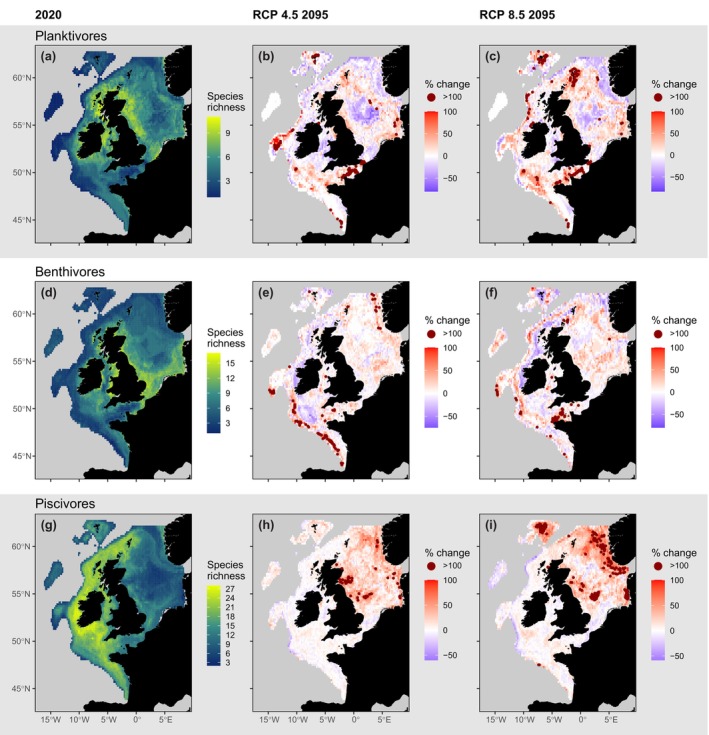
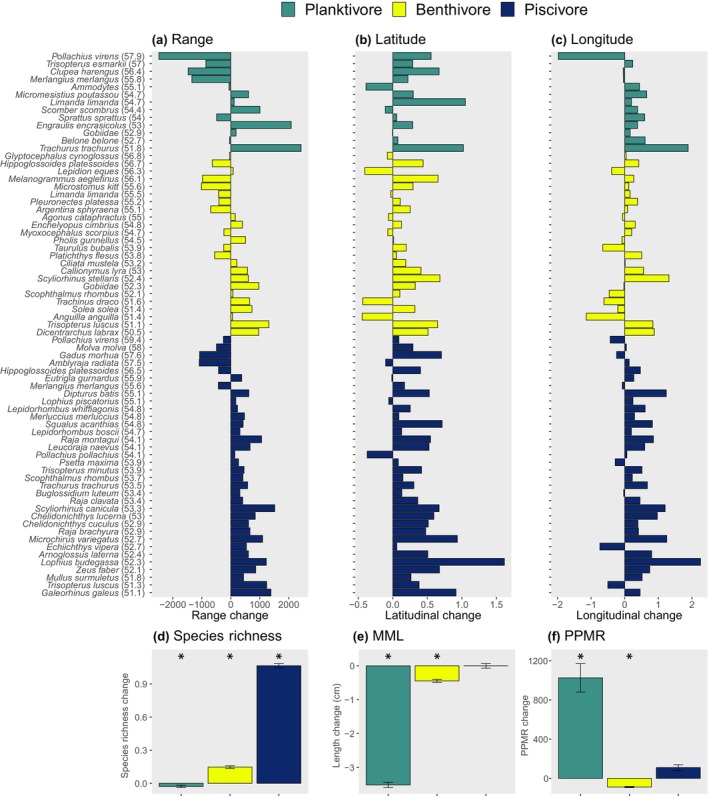
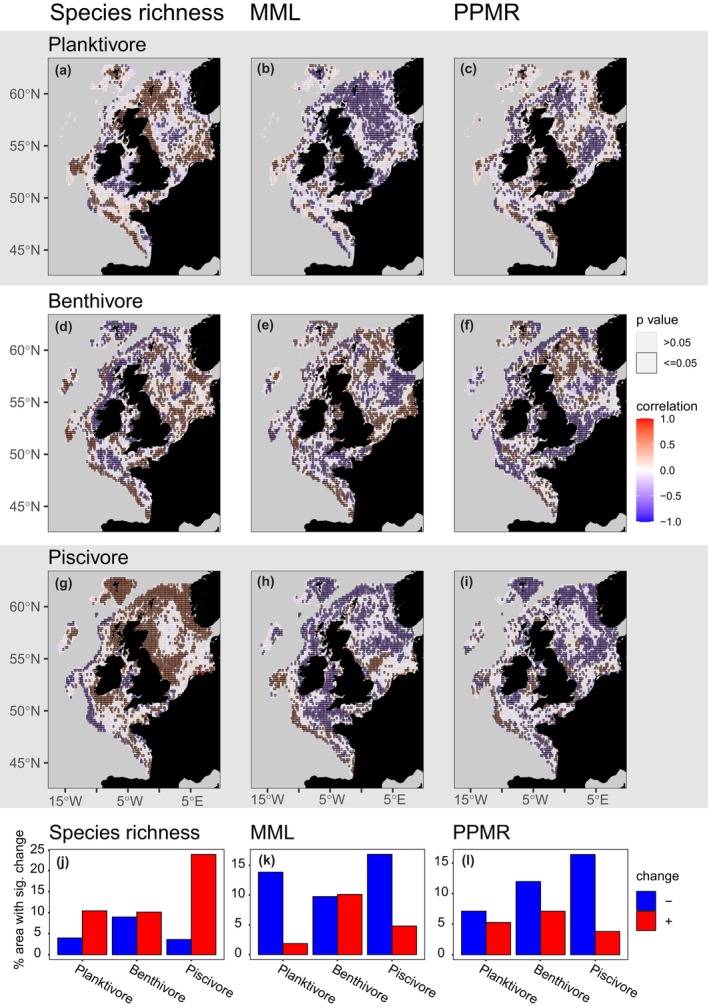
Many studies predict shifts in species distributions and community size composition in response to climate change, yet few have demonstrated how these changes will be distributed across marine food webs. We use Bayesian Additive Regression Trees to model how climate change will affect the habitat suitability of marine fish species across a range of body sizes and belonging to different feeding guilds, each with different habitat and feeding requirements in the northeast Atlantic shelf seas. Contrasting effects of climate change are predicted for feeding guilds, with spatially extensive decreases in the species richness of consumers lower in the food web (planktivores) but increases for those higher up (piscivores). Changing spatial patterns in predator-prey mass ratios and fish species size composition are also predicted for feeding guilds and across the fish assemblage. In combination, these changes could influence nutrient uptake and transformation, transfer efficiency and food web stability, and thus profoundly alter ecosystem structure and functioning.

Keywords: biodiversity; climate change scenarios; ecosystem structure and function; fish feeding guilds; habitat suitability; species distribution modelling.


Conflict of interest statement

The authors declare no conflict of interest.

Figures

FIGURE 1
FIGURE 1
Differences between feeding guilds in: % biomass contribution of zooplankton (a); benthos (b); and fish prey (c; see Figure S1 for remaining prey biomasses); predator length (d); individual prey mass (e); and biomass‐weighted predator–prey mass ratio (f). Values are based on feeding guild‐level means taken across species (Table S2), error bars represent standard error.
FIGURE 2
FIGURE 2
A step‐by‐step guide showing how different data were combined and analysed to predict species‐guild distributions.
FIGURE 3
FIGURE 3
Feeding guild species richness in 2020 (a, d, g) and % change in richness between 2020 and 2095 based on RCP 4.5 (b, e, h) and RCP 8.5 (c, f, i) generated using BART species distribution models. Particularly high values of increase by >100% are highlighted in dark red.
FIGURE 4
FIGURE 4
Predicted change in the distribution of species assigned to feeding guilds, feeding guild species richness, mean maximum length (MML) and predator‐prey mass ratios (PPMR) from 2020 to 2095 based on RCP 4.5. Top row: species are ordered along the y‐axis by feeding guild and then their mean latitudinal values (in parentheses). Change in range (a) represents change in the number of cells occupied across the study region, each cell corresponding to an area of 100 km2. Latitudinal (b) and longitudinal (c) change represent shifts in the mean latitudinal and longitudinal values of cells occupied by species respectively. Species which appear multiple times on the y‐axis switch guilds through ontogeny, such as juvenile planktivorous dab (Limanda limanda) which develop into benthivores at larger size classes and can have differing habitat requirements (note contrasting latitudinal changes). Bottom row: mean cell‐level change in feeding guild species richness (d), MML (e) and PPMR (f), with error bars showing standard error and * indicating significant change between 2020 and 2095 values based on Kruskal–Wallis tests.
FIGURE 5
FIGURE 5
Temporal correlations in feeding guild species richness (a, d, g), mean maximum length (MML; b, e, h) and predator–prey mass ratio (PPMR; c, f, i) over 5‐year intervals from 2020 to 2095 under RCP 4.5. Temporal increases are shown by red cells (Kendall's τ correlation values between 0 and +1), declines by blue cells (correlation values between 0 and −1), and cells with significant correlations have a black border. The bottom row shows the % of cells with a significant increasing (red) or significant decreasing (blue) correlation in species richness (j), MML (k) and PPMR (l).

Similar articles

Cited by

References

    1. Albouy, C. , Velez, L. , Coll, M. , Colloca, F. , Le Loc'h, F. , Mouillot, D. , & Gravel, D. (2014). From projected species distribution to food‐web structure under climate change. Global Change Biology, 20(3), 730–741. 10.1111/gcb.12467 - DOI - PubMed
    1. Barnes, C. , Maxwell, D. , Reuman, D. C. , & Jennings, S. (2010). Global patterns in predator‐prey size relationships reveal size dependency of trophic transfer efficiency. Ecology, 91(1), 222–232. 10.1890/08-2061.1 - DOI - PubMed
    1. Binzer, A. , Guill, C. , Rall, B. C. , & Brose, U. (2016). Interactive effects of warming, eutrophication and size structure: Impacts on biodiversity and food‐web structure. Global Change Biology, 22(1), 220–227. 10.1111/gcb.13086 - DOI - PubMed
    1. Brose, U. , Archambault, P. , Barnes, A. D. , Bersier, L. F. , Boy, T. , Canning‐Clode, J. , Conti, E. , Dias, M. , Digel, C. , Dissanayake, A. , Flores, A. A. V. , Fussmann, K. , Gauzens, B. , Gray, C. , Häussler, J. , Hirt, M. R. , Jacob, U. , Jochum, M. , Kéfi, S. , … Iles, A. C. (2019). Predator traits determine food‐web architecture across ecosystems. Nature Ecology and Evolution, 3(6), 919–927. 10.1038/s41559-019-0899-x - DOI - PubMed
    1. Butenschön, M. , Clark, J. , Aldridge, J. N. , Icarus Allen, J. , Artioli, Y. , Blackford, J. , Bruggeman, J. , Cazenave, P. , Ciavatta, S. , Kay, S. , Lessin, G. , Van Leeuwen, S. , Van Der Molen, J. , De Mora, L. , Polimene, L. , Sailley, S. , Stephens, N. , & Torres, R. (2016). ERSEM 15.06: A generic model for marine biogeochemistry and the ecosystem dynamics of the lower trophic levels. Geoscientific Model Development, 9(4), 1293–1339. 10.5194/gmd-9-1293-2016 - DOI