. 2024 Mar 1;147(3):1087-1099.
doi: 10.1093/brain/awad351.

Multimodal layer modelling reveals in vivo pathology in amyotrophic lateral sclerosis

Affiliations

Multimodal layer modelling reveals in vivo pathology in amyotrophic lateral sclerosis

Alicia Northall et al. Brain. .

Abstract

Amyotrophic lateral sclerosis (ALS) is a rapidly progressing neurodegenerative disease characterized by the loss of motor control. Current understanding of ALS pathology is largely based on post-mortem investigations at advanced disease stages. A systematic in vivo description of the microstructural changes that characterize early stage ALS, and their subsequent development, is so far lacking. Recent advances in ultra-high field (7 T) MRI data modelling allow us to investigate cortical layers in vivo. Given the layer-specific and topographic signature of ALS pathology, we combined submillimetre structural 7 T MRI data (qT1, QSM), functional localizers of body parts (upper limb, lower limb, face) and layer modelling to systematically describe pathology in the primary motor cortex (M1), in 12 living ALS patients with reference to 12 matched controls. Longitudinal sampling was performed for a subset of patients. We calculated multimodal pathology maps for each layer (superficial layer, layer 5a, layer 5b, layer 6) of M1 to identify hot spots of demyelination, iron and calcium accumulation in different cortical fields. We show preserved mean cortical thickness and layer architecture of M1, despite significantly increased iron in layer 6 and significantly increased calcium in layer 5a and superficial layer, in patients compared to controls. The behaviourally first-affected cortical field shows significantly increased iron in L6 compared to other fields, while calcium accumulation is atopographic and significantly increased in the low myelin borders between cortical fields compared to the fields themselves. A subset of patients with longitudinal data shows that the low myelin borders are particularly disrupted and that calcium hot spots, but to a lesser extent iron hot spots, precede demyelination. Finally, we highlight that a very slow progressing patient (Patient P4) shows a distinct pathology profile compared to the other patients. Our data show that layer-specific markers of in vivo pathology can be identified in ALS patients with a single 7 T MRI measurement after first diagnosis, and that such data provide critical insights into the individual disease state. Our data highlight the non-topographic architecture of ALS disease spread and the role of calcium, rather than iron accumulation, in predicting future demyelination. We also highlight a potentially important role of low myelin borders, that are known to connect to multiple areas within the M1 architecture, in disease spread. Finally, the distinct pathology profile of a very-slow progressing patient (Patient P4) highlights a distinction between disease duration and progression. Our findings demonstrate the importance of in vivo histology imaging for the diagnosis and prognosis of neurodegenerative diseases such as ALS.

Keywords: biomarker; disease prediction; individualised medicine; motor neuron disease; neurodegeneration.


Conflict of interest statement

The authors report no competing interests.

Figures

Figure 1
Figure 1
Microstructure profiles of the left primary motor cortex (M1) in ALS patients and matched controls. (A) ‘Raw qT1’ (i.e. not decurved; n = 12), decurved qT1 (n = 12), positive QSM (pQSM; n = 8) and negative QSM (nQSM; n = 8) data extracted across all cortical depths (n = 21) of left M1. The first and second columns show data for all controls and all patients, with the group mean plotted in bold black and red, respectively. The third column shows the mean group data of the controls and patients, with red lines representing the patients. Note that qT1 and pQSM are validated in vivo markers of myelin and iron, content, respectively, while nQSM is largely considered to reflect calcium content. Also note that the profiles here represent the data of the entire M1, while in other figures and statistics the data used were averaged across cortical fields. (B) According to a previously published approach, we identified four compartments (‘layers’) based on the ‘decurved qT1’ profile: Ls = superficial layer including layers 2–3; L5a = layer 5a; L5b = layer 5b; L6 = layer 6. Note that Ls does not include layer 1 as it is inaccessible with MRI or layer 4, as it is absent in M1. We show the layer definitions for healthy controls (n = 12) and ALS patients (n = 12) in the present study (centre), as well as for older adults (n = 18) in our previous study (left). L5a and L5b were distinguished based on the presence of two small qT1 dips at the plateau of ‘decurved qT1’ values (indicating L5), while L6 was identified based on a sharp decrease in values before a further plateau indicating the presence of white matter. We show our layer approximations over schematic depictions (right) of M1 myelin and cell histological staining. (C) Despite differences in the shape of the profile in the affected fields compared to the average across fields in patients, layers can be similarly identified in the affected fields.
Figure 2
Figure 2
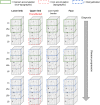
Multimodal in vivo pathology maps in ALS patients. Pathology maps were generated for each patient by thresholding the displayed value ranges at each layer to show increased qT1 and pQSM (+1 to +4 SD), and reduced nQSM (−1 to −4 SD), with respect to the mean M1 value of the matched control. Subject-specific cortical fields representing the lower limb, upper limb and face areas are outlined in yellow, red and blue, respectively. Pathology maps are shown for Patients P1, P2, P8, P12, P6, P7, P4 and P5 (left) and their corresponding matched controls C1, C2, C8, C12, C6, C7, C4 and C5 (right). Pathology maps: note that filled red and blue arrows indicate iron accumulation and demyelination in the first-affected cortical field, respectively. Unfilled red arrows indicate iron accumulation in cortical fields other than the first-affected field. Body maps: note that red-outlined circles on the body maps indicate the onset site (i.e. first-affected body part) of the patient. Filled red and green circles indicate impaired or better motor function in the circled body part compared to the matched control, respectively. The stage indicates the King’s College (KC) stage of disease progression based on ALSFRS-R score: stage 2A reflects the involvement of one body part and that a clinical diagnosis has taken place, while stage 2B and stage 3 reflect the subsequent involvement of second and third body parts, respectively. L6 = layer 6; L5b = layer 5b; L5a = layer 5a; Ls = superficial layer; nQSM = negative QSM; pQSM = positive QSM; qT1 = quantitative T1.
Figure 3
Figure 3
Layer-specific differences in QSM between ALS patients (n = 8) and matched healthy controls (n = 8). One-tailed paired-samples t-tests were used to investigate matched patient-control pair differences in microstructure (pQSM, nQSM, qT1) for each cortical layer (see Table 3 for statistics). Positive effect sizes indicate ‘more substance’ in patients compared to controls. Effect sizes (Cohen’s d) > 0.5 indicate medium effects, while effect sizes > 0.8 indicate large effects. L6 = layer 6; L5b = layer 5b; L5a = layer 5a; Ls = superficial layer; nQSM = negative QSM; pQSM = positive QSM; qT1 = quantitative T1.
Figure 4
Figure 4
Longitudinal multimodal in vivo pathology maps in ALS patients. Individualized in vivo pathology maps were generated by thresholding the displayed value ranges at each layer to show increased qT1 and pQSM (+1 to +4 SD), and reduced nQSM (−1 to −4 SD), with respect to the mean M1 value of the matched control at baseline. Row 1 shows the pathology maps for Patient P1 at T1 (time point 1) and T2 (time point 2), row 2 shows the pathology maps for Patient P2 at T1 and T2 and row 3 shows the pathology maps for Patient P4 at T1, T2 and T3 (time point 3). Pathology maps: red and blue arrows on the pathology maps indicate iron accumulation and demyelination in the cortical field corresponding to symptom onset site, respectively. Body maps: red-outlined circles on the body maps indicate the onset site of the patient, while filled red and green circles indicate impaired or better motor function in the circled body part compared to the matched control, respectively. QSM data were excluded at T2 for Patients P1 and P2 due to severe artefacts. Clinical information: ALS Functional Rating Scale—Revised (ALSFRS-R) indicates disease severity, where lower values indicate greater impairment, with subscores for fine, gross and bulbar motor function. The Penn Upper Motor Neuron Scale (PUMNS) score indicates clinical signs of upper motor neuron involvement, with higher scores indicating greater impairment. The King’s College (KC) stage indicates disease progression based on ALSFRS-R score: stage 2A reflects the involvement of one body part and that a clinical diagnosis has taken place, while stage 2B and stage 3 reflect the subsequent involvement of second and third body parts, respectively. L6 = layer 6; L5b = layer 5b; L5a = layer 5a; Ls = superficial layer; nQSM = negative QSM; pQSM = positive QSM; qT1 = quantitative T1; LL = lower limb; UL = upper limb; F = face.
Figure 5
Figure 5
Model of in vivo M1 pathology progression in ALS. Schematic depiction of the layer-specific pathology features shown in ALS patients compared to matched healthy controls in the present study. In the early pathology stage, we demonstrate topographic (i.e. most in first-affected cortical field—example upper limb shown here) iron accumulation in L6 and non-topographic (i.e. more widespread) calcium accumulation in Ls and L5a (see Table 3 and Figs 2 and 3). With disease progression, we highlight increasing demyelination (Supplementary Table 4), particularly in Ls and L5a and in the low-myelin borders between adjacent cortical fields (see Fig. 4, based on visual inspection), corresponding to calcium accumulation at earlier time points (Supplementary Table 5). L6 = layer 6; L5b = layer 5b; L5a = layer 5a; Ls = superficial layer.

References

    1. Al-Chalabi A, Hardiman O, Kiernan MC, Chiò A, Rix-Brooks B, van den Berg LH. Amyotrophic lateral sclerosis: Moving towards a new classification system. Lancet Neurol. 2016;15:1182–1194. - PubMed
    1. Norris F, Shepherd R, Denys E, et al. Onset, natural history and outcome in idiopathic adult motor neuron disease. J Neurol Sci. 1993;118:48–55. - PubMed
    1. Ravits JM, La Spada AR. ALS Motor phenotype heterogeneity, focality, and spread: Deconstructing motor neuron degeneration. Neurology. 2009;73:805–811. - PMC - PubMed
    1. Chio A, Logroscino G, Hardiman O, et al. Prognostic factors in ALS: A critical review. Amyotroph Lateral Scler. 2009;10:310–323. - PMC - PubMed
    1. Hammer RP, Tomiyasu U, Scheibel AB. Degeneration of the human Betz cell due to amyotrophic lateral sclerosis. Exp Neurol. 1979;63:336–346. - PubMed

Publication types