. 2023 Oct 26;8(5):e0126122.
doi: 10.1128/msystems.01261-22. Epub 2023 Oct 10.

Metabolite diversity among representatives of divergent Prochlorococcus ecotypes

Affiliations

Metabolite diversity among representatives of divergent Prochlorococcus ecotypes

Elizabeth B Kujawinski et al. mSystems. .

Erratum in

Abstract

Approximately half of the annual carbon fixation on Earth occurs in the surface ocean through the photosynthetic activities of phytoplankton such as the ubiquitous picocyanobacterium Prochlorococcus. Ecologically distinct subpopulations (or ecotypes) of Prochlorococcus are central conduits of organic substrates into the ocean microbiome, thus playing important roles in surface ocean production. We measured the chemical profile of three cultured ecotype strains, observing striking differences among them that have implications for the likely chemical impact of Prochlorococcus subpopulations on their surroundings in the wild. Subpopulations differ in abundance along gradients of temperature, light, and nutrient concentrations, suggesting that these chemical differences could affect carbon cycling in different ocean strata and should be considered in models of Prochlorococcus physiology and marine carbon dynamics.

Keywords: DNA methylation; Prochlorococcus; metabolomics.


Conflict of interest statement

The authors declare no conflict of interest.

Figures

Fig 1
Fig 1
Metabolites detected in three strains of Prochlorococcus within intracellular and extracellular phases. Metabolites are presented in alphabetical order with concentrations in attomoles per cell; ‡ indicates metabolites whose biosynthesis genes were not found in the genome, and # indicates a metabolite whose biosynthesis genes are present only in MIT9313. Extracellular metabolites with ¥ have an extraction efficiency below 1% and cannot be reliably quantified in the method used here. Intracellular concentrations of oxidized glutathione are not available due to interference by an unknown compound. Columns refer to MIT9301 (HLII) light intensity 50 µmol photons m−2 s−1, MIT9301 light intensity 10 µmol photons m−2 s−1, MIT0801 (LLI) light intensity 10 µmol photons m−2 s−1, MIT9313 (LLIV) light intensity 10 µmol photons m−2 s−1, and MIT9313 light intensity 5 µmol photons m−2 s−1. PL are the phosphate-limited cultures; R is phosphate replete.
Fig 2
Fig 2
S-adenosyl methionine (SAM) to S-adenosyl-homocysteine (SAH) ratios in three strains of Prochlorococcus under different culture conditions. The light intensities used in this study are in Table 1 and are 5, 10, or 50 µmol photons m−2 s−1. The box-plots represent replicate cultures within each treatment; gray dots indicate individual measurements. Letters above each treatment indicate statistically significant differences (two-way analysis of variance followed by post-hoc test using Fisher’s least significant difference; P-value <<0.0001).
Fig 3
Fig 3
Aromatic amino acids pathway. Squares are log values of mean from Fig. 1 (top bar for each compound, intracellular; bottom bar, extracellular). Light intensities are shown as well as whether the cultures were P-limited (PL) or replete (R). A bar graph representation of these data is provided in Fig. S2.
Fig 4
Fig 4
Intracellular cell-specific concentrations of metabolites associated with the urea cycle (A and C), compared to metabolites associated with inorganic nitrogen acquisition (B and D). Box plots show mean concentrations and standard deviation of experimental triplicates, with gray dots representing individual samples (orange, MIT9301; blue, MIT0801; red, MIT9313).
Fig 5
Fig 5
Branched-chain amino acid pathway figure with intermediates and BCAAs. Squares are log values of mean from Fig. 1 (top, intracellular; bottom, extracellular). A bar graph representation of these data is provided in Fig. S2.
Fig 6
Fig 6
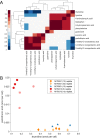
(A) Clustergram of correlations for extracellular (dissolved) metabolites occurring in at least three of five treatments. The complete set of correlations for dissolved metabolites is provided in Fig. S4. Statistically significant positive (red) and negative (blue) correlations are Pearson correlations with P-values adjusted using a false discovery rate of 5%. (B) Dissolved pantothenic acid plotted against dissolved thymidine, which are significantly negatively correlated (orange, MIT9301; blue, MIT0801; red, MIT9313).

References

    1. Flombaum P, Gallegos JL, Gordillo RA, Rincón J, Zabala LL, Jiao N, Karl DM, Li WKW, Lomas MW, Veneziano D, Vera CS, Vrugt JA, Martiny AC. 2013. Present and future global distributions of the marine cyanobacteria Prochlorococcus and Synechococcus. Proc Natl Acad Sci USA 110:9824–9829. doi:10.1073/pnas.1307701110 - DOI - PMC - PubMed
    1. Hansell DA. 2013. Recalcitrant dissovled organic carbon fractions. Ann Rev Mar Sci 5:421–445. doi:10.1146/annurev-marine-120710-100757 - DOI - PubMed
    1. Moran MA, Kujawinski EB, Schroer WF, Amin SA, Bates NR, Bertrand EM, Braakman R, Brown CT, Covert MW, Doney SC, Dyhrman ST, Edison AS, Eren AM, Levine NM, Li L, Ross AC, Saito MA, Santoro AE, Segrè D, Shade A, Sullivan MB, Vardi A. 2022. Microbial metabolites in the marine carbon cycle. Nat Microbiol 7:508–523. doi:10.1038/s41564-022-01090-3 - DOI - PubMed
    1. Rocap G, Larimer FW, Lamerdin J, Malfatti S, Chain P, Ahlgren NA, Arellano A, Coleman M, Hauser L, Hess WR, Johnson ZI, Land M, Lindell D, Post AF, Regala W, Shah M, Shaw SL, Steglich C, Sullivan MB, Ting CS, Tolonen A, Webb EA, Zinser ER, Chisholm SW. 2003. Genome divergence in two Prochlorococcus ecotypes reflects oceanic niche differentiation. Nat 424:1042–1047. doi:10.1038/nature01947 - DOI - PubMed
    1. Moore LR, Chisholm SW. 1999. Photophysiology of the marine cyanobacterium Prochlorococcus: ecotypic differences among cultured isolates. Limnol Oceanogr 44:628–638. doi:10.4319/lo.1999.44.3.0628 - DOI