Observational Study
. 2023 Oct;309(1):e231092.
doi: 10.1148/radiol.231092.

Repeatability of MRI Biomarkers in Nonalcoholic Fatty Liver Disease: The NIMBLE Consortium

Affiliations
Observational Study

Repeatability of MRI Biomarkers in Nonalcoholic Fatty Liver Disease: The NIMBLE Consortium

Kathryn J Fowler et al. Radiology. 2023 Oct.

Abstract

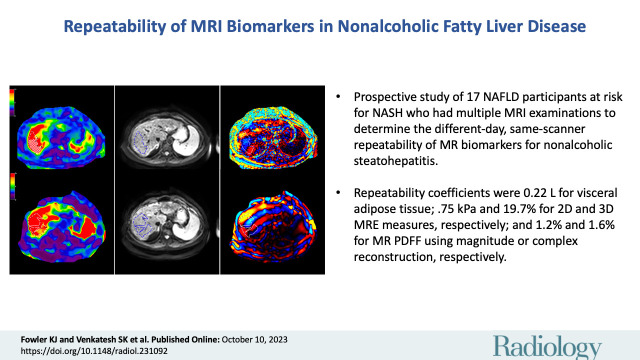
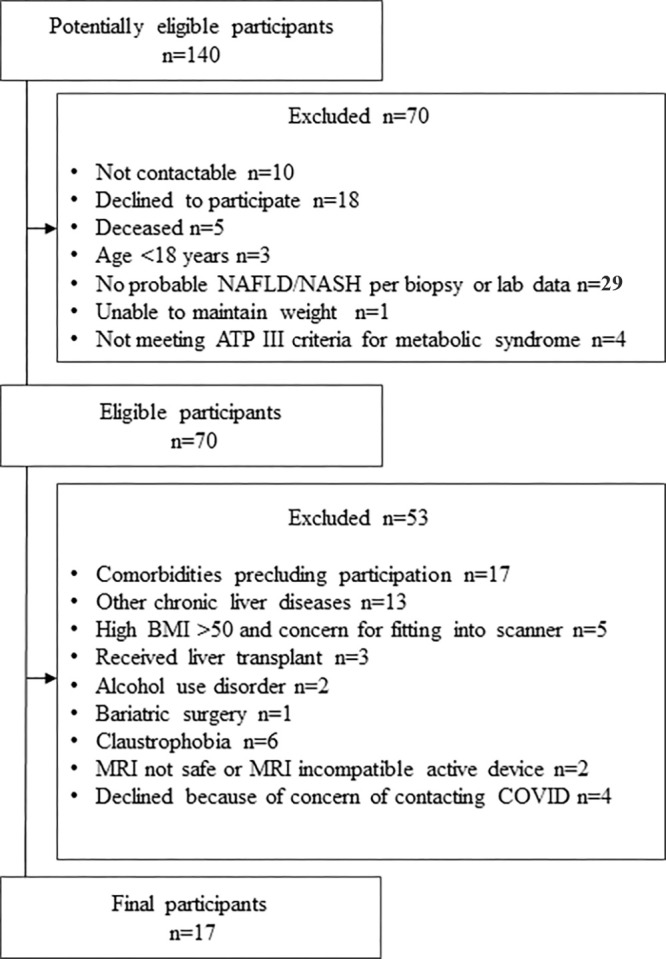
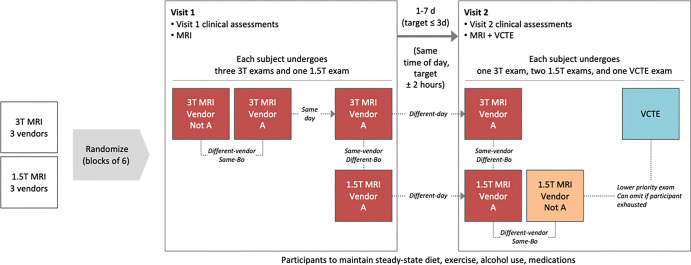
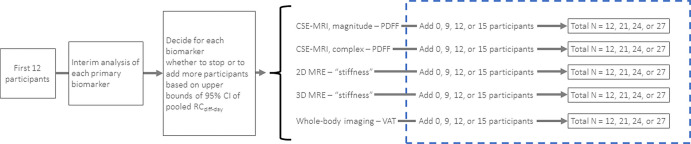
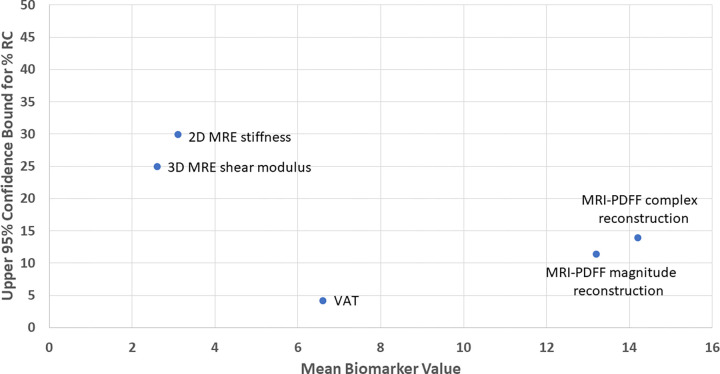
Background There is a need for reliable noninvasive methods for diagnosing and monitoring nonalcoholic fatty liver disease (NAFLD). Thus, the multidisciplinary Non-invasive Biomarkers of Metabolic Liver disease (NIMBLE) consortium was formed to identify and advance the regulatory qualification of NAFLD imaging biomarkers. Purpose To determine the different-day same-scanner repeatability coefficient of liver MRI biomarkers in patients with NAFLD at risk for steatohepatitis. Materials and Methods NIMBLE 1.2 is a prospective, observational, single-center short-term cross-sectional study (October 2021 to June 2022) in adults with NAFLD across a spectrum of low, intermediate, and high likelihood of advanced fibrosis as determined according to the fibrosis based on four factors (FIB-4) index. Participants underwent up to seven MRI examinations across two visits less than or equal to 7 days apart. Standardized imaging protocols were implemented with six MRI scanners from three vendors at both 1.5 T and 3 T, with central analysis of the data performed by an independent reading center (University of California, San Diego). Trained analysts, who were blinded to clinical data, measured the MRI proton density fat fraction (PDFF), liver stiffness at MR elastography (MRE), and visceral adipose tissue (VAT) for each participant. Point estimates and CIs were calculated using χ2 distribution and statistical modeling for pooled repeatability measures. Results A total of 17 participants (mean age, 58 years ± 8.5 [SD]; 10 female) were included, of which seven (41.2%), six (35.3%), and four (23.5%) participants had a low, intermediate, or high likelihood of advanced fibrosis, respectively. The different-day same-scanner mean measurements were 13%-14% for PDFF, 6.6 L for VAT, and 3.15 kPa for two-dimensional MRE stiffness. The different-day same-scanner repeatability coefficients were 0.22 L (95% CI: 0.17, 0.29) for VAT, 0.75 kPa (95% CI: 0.6, 0.99) for MRE stiffness, 1.19% (95% CI: 0.96, 1.61) for MRI PDFF using magnitude reconstruction, 1.56% (95% CI: 1.26, 2.07) for MRI PDFF using complex reconstruction, and 19.7% (95% CI: 15.8, 26.2) for three-dimensional MRE shear modulus. Conclusion This preliminary study suggests that thresholds of 1.2%-1.6%, 0.22 L, and 0.75 kPa for MRI PDFF, VAT, and MRE, respectively, should be used to discern measurement error from real change in patients with NAFLD. ClinicalTrials.gov registration no. NCT05081427 © RSNA, 2023 Supplemental material is available for this article. See also the editorial by Kozaka and Matsui in this issue.


Conflict of interest statement

Disclosures of conflicts of interest: K.J.F. Grants or contracts from Bayer, GE HealthCare, Median; consulting fees from Bayer, Ascelia Pharma, GE HealthCare; lecture payment from CME science; payment for expert testimony; travel and/or meeting support from Bayer; data safety monitoring board for Ascelia Pharma; chair, American College of Radiology Appropriateness panel; director, Society of Abdominal Radiology education portfolio; senior deputy editor for Radiology. S.K.V. Grants from NIH (R01 EB001981), U.S. Department of Defense (W81XWH-19-1-0583-01); textbook royalties from Springer; patent for nonalcoholic fatty liver disease activity score system using MRE (licensee, Mayo Foundation for Medical Education and Research). N.O. Institutional contracts for statistical support with the NIMBLE and Quantitative Imaging Biomarker Alliance (QIBA) studies. M.S.M. No relevant relationships. J.C. Salaries from Mayo Clinic, Resoundant; royalties from Resoundant; patents planned, issued, or pending via Mayo Clinic; stockholder, Resoundant; financial interest related to the intellectual properties of MRE. K.P. Employee, Resoundant. J.M. No relevant relationships. K.J.B. No relevant relationships. D.B. No relevant relationships. W.C.H. No relevant relationships. S.S.S. No relevant relationships. T.N.K. No relevant relationships. A.P. No relevant relationships. R.A.C. Member of the American Diabetes Association Community Leaders Board for New England; co-chair, Metabolic Disorders Steering Committee of the Foundation of the NIH Biomarkers Consortium; stockholder, Regeneron Pharmaceuticals, Pfizer. A.J.S. Grants or contracts from Intercept, Pfizer, Merck, Bristol-Myers Squibb, Eli Lilly, Novo Nordisk, Boehringer Ingelheim, AstraZeneca, Novartis; institutional grant from Madrigal Research and institutional collaborative agreement with Avant Sante; royalties from Elsevier, UpToDate; consulting fees from Path AI, Histoindex, Fibronest, BioCellvia, Merck, Pfizer, Eli Lily, Novo Nordisk, Boehringer Ingelheim, AstraZeneca, Akero, Intercept, Madrigal, Northsea, Takeda, Regeneron, Genetich, Alnylam, Roche, Glaxo Smith Kline, Novartis, Tern, Fractyl, Invventiva, Gilead, Target Pharmasolutions. R.L. Grants or contracts from Arrowhead Pharmaceuticals, AstraZeneca, Boehringer-Ingelheim, Bristol-Myers Squibb, Eli Lilly, Galectin Therapeutics, Galmed Pharmaceuticals, Gilead, Hanmi, Intercept, Inventiva, Ionis, Janssen, Madrigal Pharmaceuticals, Merck, NGM Biopharmaceuticals, Novo Nordisk, Pfizer, Sonic Incytes, Terns Pharmaceuticals; consulting fees from Aardvark Therapeutics, Altimmune, Anylam/Regeneron, Amgen, Arrowhead Pharmaceuticals, AstraZeneca, Bristol-Myers Squibb, CohBar, Eli Lilly, Galmed, Gilead, Glympse bio, Hightide, Inipharma, Intercept, Inventiva, Ionis, Janssen, Madrigal, Metacrine, NGM Biopharmaceuticals, Novartis, Novo Nordisk, Merck, Pfizer, Sagimet, Theratechnologies, 89 bio, Terns Pharmaceuticals, Viking Therapeutics. R.E. Institutional grants from NIH as principal investigator (R37 EB001981) and other NIH grants as co-investigator; sponsored research contract with Resoundant; shared royalties from Mayo Clinic; patents planned, issued, or pending via Mayo Clinic; Mayo Clinic–assigned role as CEO of Resoundant, a Mayo Clinic owned company; stockholder, Resoundant; financial interest related to the intellectual properties of MRE. A.E.S. Grant and consultant payment from GE HealthCare; patent pending for US beamforming and shear wave elastography. C.B.S. Institutional research grants from ACR, Bayer, FNIH, GE HealthCare, Gilead, Pfizer, Philips, Siemens Healthineers; lab service agreements with Enanta, Gilead, ICON, Intercept, Nusirt, Shire, Synageva, Takeda; royalty payments to institution from Medscape, Wolters Kluwer; personal consulting payments from Altimmune, Ascelia Pharma, Blade, Boehringer, Epigenomics, Guerbet; institutional consulting representative for AMRA, BMS, Exact Sciences, IBM-Watson, Pfizer; lecture payments from Japanese Society of Radiology, Stanford, MD Anderson; meeting and/or travel support from Fundacion Santa Fe, CADI, Stanford, Jornada Paulista de Radiologia, Ascelia Pharma; unpaid advisor for Quantix Bio; stockholder, Livivos; equipment loan to institution from GE HealthCare; institutional payments for academic co-chair position of Imaging Workstream, NIMBLE; volunteer in working groups, QIBA. S.P.S. Employee, Pfizer; unpaid leadership position as co-chair for the FNIH consortium that led to this work; stockholder, Pfizer.

Figures

None
Graphical abstract
Flowchart shows study enrollment. ATP = adult treatment panel, BMI =
body mass index, NAFLD = nonalcoholic fatty liver disease, NASH =
nonalcoholic steatohepatitis.
Figure 1:
Flowchart shows study enrollment. ATP = adult treatment panel, BMI = body mass index, NAFLD = nonalcoholic fatty liver disease, NASH = nonalcoholic steatohepatitis.
Schematic shows study procedures, including randomization to different
blocks to ensure spread of participant data across all vendors and field
strengths relatively equally. Each participant also underwent
vibration-controlled transient elastography (VCTE) as part of the study.
Imaging examinations were performed at approximately the same time each day
and within 7 days of each other. B0 = field strength.
Figure 2:
Schematic shows study procedures, including randomization to different blocks to ensure spread of participant data across all vendors and field strengths relatively equally. Each participant also underwent vibration-controlled transient elastography (VCTE) as part of the study. Imaging examinations were performed at approximately the same time each day and within 7 days of each other. B0 = field strength.
Schematic shows adaptive enrollment for determining the stopping rule
for the interim analysis after enrollment of 12 participants, the results of
which are used to determine if more participants need to be included in the
final analysis. If the a priori upper bound 95% confidence threshold is met
for each biomarker, no additional participants would be recruited. If a
single biomarker or multiple biomarkers failed to meet the threshold,
additional participants would be enrolled with another interim analysis
planned upon enrollment of 21 and 24 participants. CSE = chemical shift
encoding, MRE = MR elastography, PDFF = proton density fat fraction,
RCdiff-day = different-day repeatability coefficient, 3D =
three-dimensional, 2D = two-dimensional, VAT = visceral adipose
tissue.
Figure 3:
Schematic shows adaptive enrollment for determining the stopping rule for the interim analysis after enrollment of 12 participants, the results of which are used to determine if more participants need to be included in the final analysis. If the a priori upper bound 95% confidence threshold is met for each biomarker, no additional participants would be recruited. If a single biomarker or multiple biomarkers failed to meet the threshold, additional participants would be enrolled with another interim analysis planned upon enrollment of 21 and 24 participants. CSE = chemical shift encoding, MRE = MR elastography, PDFF = proton density fat fraction, RCdiff-day = different-day repeatability coefficient, 3D = three-dimensional, 2D = two-dimensional, VAT = visceral adipose tissue.
Point estimate graph of the upper 95% confidence bounds for
different-day repeatability coefficient percentages (%RC) for all imaging
biomarkers shows the relative spread between biomarkers. MRE = MR
elastography, PDFF = proton density fat fraction, 3D = three-dimensional, 2D
= two-dimensional, VAT = visceral adipose tissue.
Figure 4:
Point estimate graph of the upper 95% confidence bounds for different-day repeatability coefficient percentages (%RC) for all imaging biomarkers shows the relative spread between biomarkers. MRE = MR elastography, PDFF = proton density fat fraction, 3D = three-dimensional, 2D = two-dimensional, VAT = visceral adipose tissue.
MRI in a 65-year-old male participant with low likelihood of advanced
fibrosis according to the fibrosis based on four factors (FIB-4) index. (A)
Axial MRI proton density fat fraction map shows regions of interest (green
circles) drawn in each Couinaud segment while avoiding any vessels or
lesions, as per the study protocol. (B) Coronal image shows body composition
with autosegmented visceral (pink) and subcutaneous (blue) adipose tissue.
(C) Left to right: Axial elastogram, magnitude, and wave images obtained at
two-dimensional MR elastography (MRE) show placement of the region of
interest (dotted outline) in the region of parallel wave propagation,
avoiding the outer edge of the liver. (D) Left to right: Axial elastogram,
magnitude, and wave images obtained at three-dimensional MRE similarly show
the region of interest (dotted outline) in a region of parallel wave
propagation, avoiding the outer margin of the liver. Color bars alongside
elastograms indicate a range of kilopascals from low (purple) to high
(red).
Figure 5:
MRI in a 65-year-old male participant with low likelihood of advanced fibrosis according to the fibrosis based on four factors (FIB-4) index. (A) Axial MRI proton density fat fraction map shows regions of interest (green circles) drawn in each Couinaud segment while avoiding any vessels or lesions, as per the study protocol. (B) Coronal image shows body composition with autosegmented visceral (pink) and subcutaneous (blue) adipose tissue. (C) Left to right: Axial elastogram, magnitude, and wave images obtained at two-dimensional MR elastography (MRE) show placement of the region of interest (dotted outline) in the region of parallel wave propagation, avoiding the outer edge of the liver. (D) Left to right: Axial elastogram, magnitude, and wave images obtained at three-dimensional MRE similarly show the region of interest (dotted outline) in a region of parallel wave propagation, avoiding the outer margin of the liver. Color bars alongside elastograms indicate a range of kilopascals from low (purple) to high (red).
Axial MRI in a 57-year-old female participant with a high likelihood
of advanced fibrosis according to the fibrosis based on four factors (FIB-4)
index. (A) Left to right: Elastogram, magnitude, and wave images obtained at
three-dimensional MR elastography (MRE) show the region of interest (dotted
outline) in a region of parallel wave propagation, avoiding the outer margin
of the liver. (B) Left to right: Elastogram, magnitude, and wave images
obtained at two-dimensional MRE show placement of the region of interest
(dotted outline) in the region of parallel wave propagation, avoiding the
outer edge of the liver. (C) MRI proton density fat fraction map shows
placement of regions of interest (green circles) within different segments
of the liver. Color bars alongside elastograms indicate a range of
kilopascals from low (purple) to high (red).
Figure 6:
Axial MRI in a 57-year-old female participant with a high likelihood of advanced fibrosis according to the fibrosis based on four factors (FIB-4) index. (A) Left to right: Elastogram, magnitude, and wave images obtained at three-dimensional MR elastography (MRE) show the region of interest (dotted outline) in a region of parallel wave propagation, avoiding the outer margin of the liver. (B) Left to right: Elastogram, magnitude, and wave images obtained at two-dimensional MRE show placement of the region of interest (dotted outline) in the region of parallel wave propagation, avoiding the outer edge of the liver. (C) MRI proton density fat fraction map shows placement of regions of interest (green circles) within different segments of the liver. Color bars alongside elastograms indicate a range of kilopascals from low (purple) to high (red).

Comment in

References

    1. Younossi ZM , Koenig AB , Abdelatif D , Fazel Y , Henry L , Wymer M . Global epidemiology of nonalcoholic fatty liver disease-Meta-analytic assessment of prevalence, incidence, and outcomes . Hepatology 2016. ; 64 ( 1 ): 73 – 84 . - PubMed
    1. Bondini S , Kleiner DE , Goodman ZD , Gramlich T , Younossi ZM . Pathologic assessment of non-alcoholic fatty liver disease . Clin Liver Dis 2007. ; 11 ( 1 ): 17 – 23, vii . - PubMed
    1. Younossi Z , Anstee QM , Marietti M , et al. . Global burden of NAFLD and NASH: trends, predictions, risk factors and prevention . Nat Rev Gastroenterol Hepatol 2018. ; 15 ( 1 ): 11 – 20 . - PubMed
    1. Khalifa A , Rockey DC . The utility of liver biopsy in 2020 . Curr Opin Gastroenterol 2020. ; 36 ( 3 ): 184 – 191 . - PMC - PubMed
    1. Seeff LB , Everson GT , Morgan TR , et al. . Complication rate of percutaneous liver biopsies among persons with advanced chronic liver disease in the HALT-C trial . Clin Gastroenterol Hepatol 2010. ; 8 ( 10 ): 877 – 883 . - PMC - PubMed

Publication types

Associated data