. 2023 Nov 22;8(22):e157956.
doi: 10.1172/jci.insight.157956.

Heterogeneous cardiac sympathetic innervation gradients promote arrhythmogenesis in murine dilated cardiomyopathy

Affiliations

Heterogeneous cardiac sympathetic innervation gradients promote arrhythmogenesis in murine dilated cardiomyopathy

Al-Hassan J Dajani et al. JCI Insight. .

Abstract

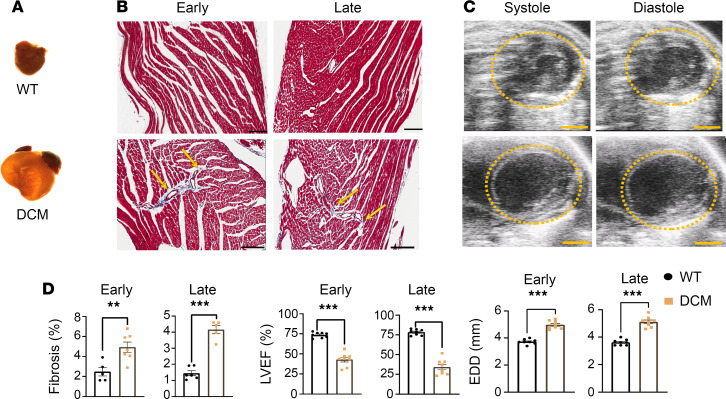
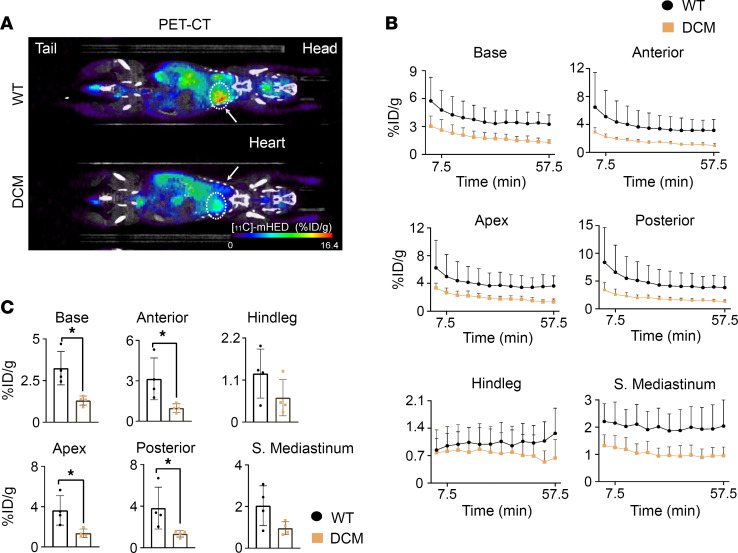
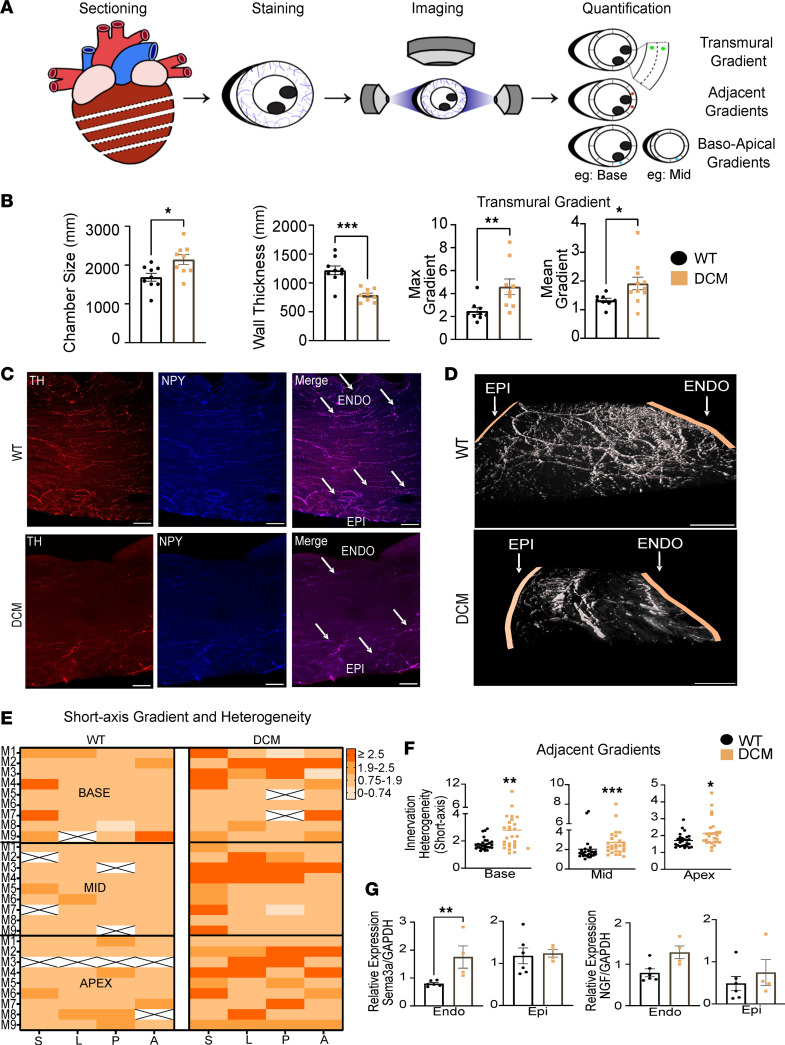
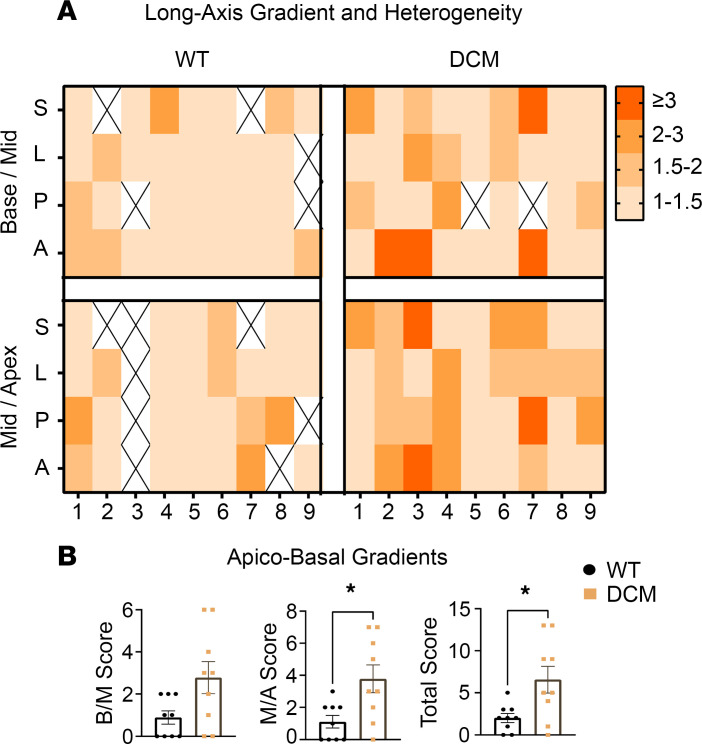
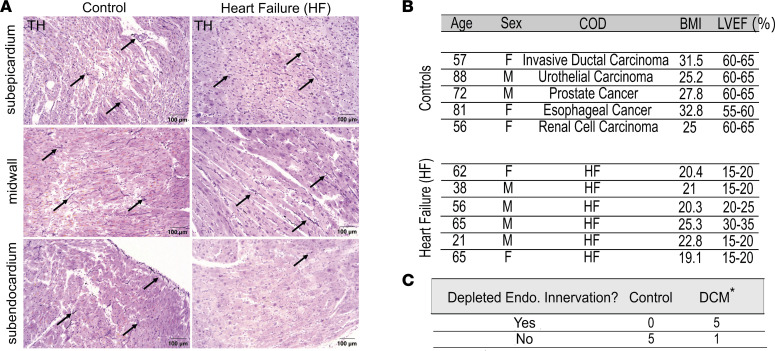
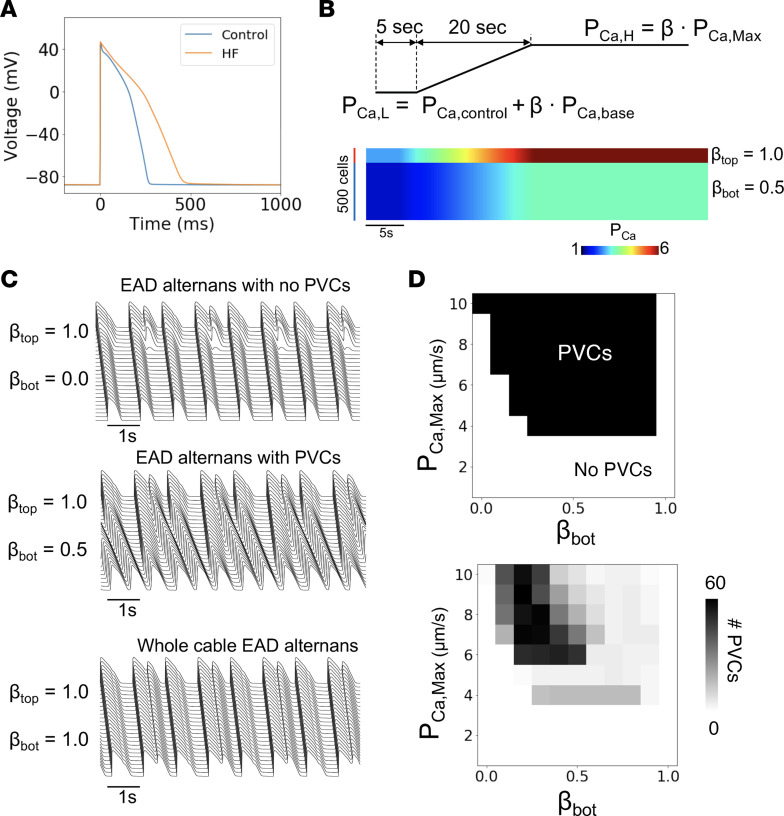
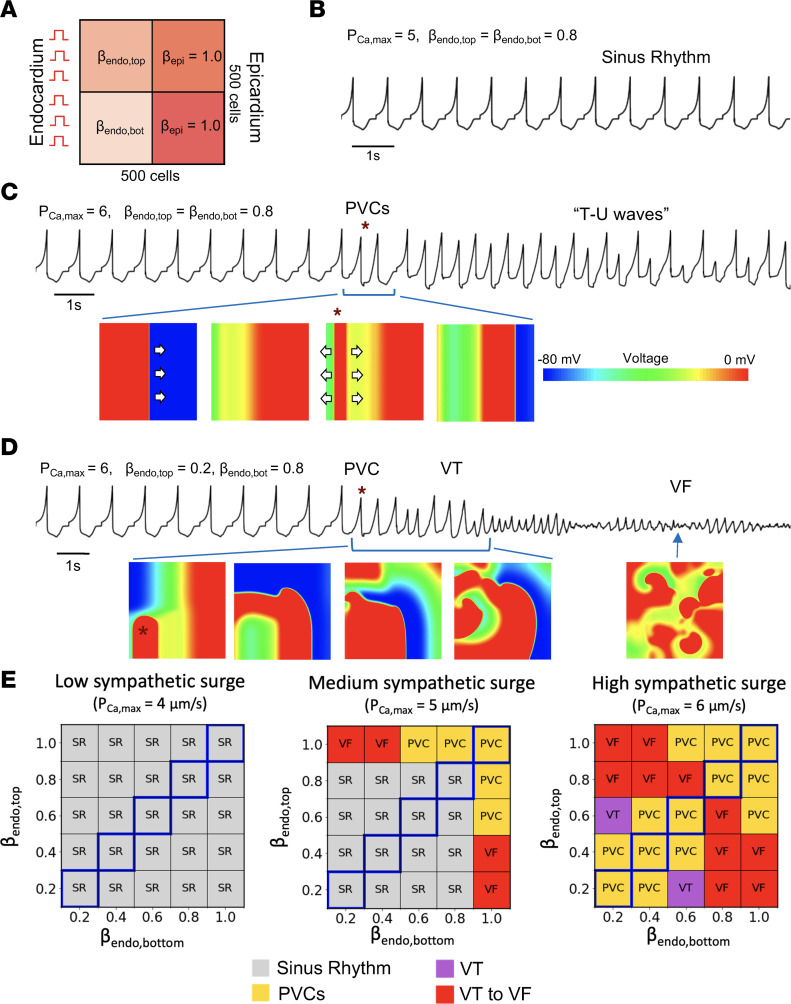
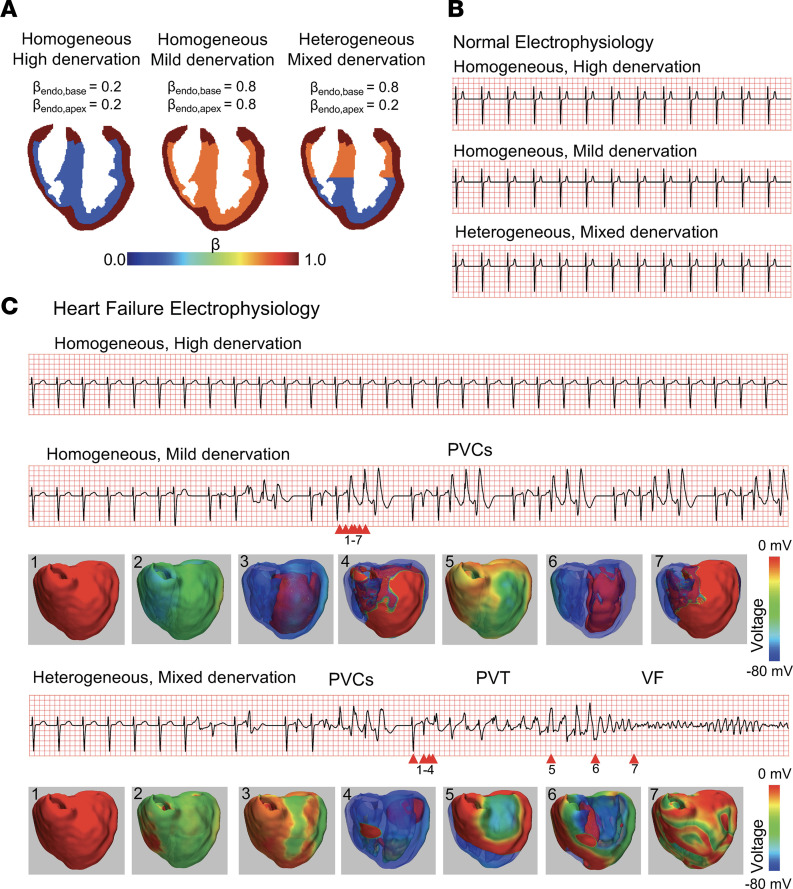
Ventricular arrhythmias (VAs) in heart failure are enhanced by sympathoexcitation. However, radiotracer studies of catecholamine uptake in failing human hearts demonstrate a proclivity for VAs in patients with reduced cardiac sympathetic innervation. We hypothesized that this counterintuitive finding is explained by heterogeneous loss of sympathetic nerves in the failing heart. In a murine model of dilated cardiomyopathy (DCM), delayed PET imaging of sympathetic nerve density using the catecholamine analog [11C]meta-Hydroxyephedrine demonstrated global hypoinnervation in ventricular myocardium. Although reduced, sympathetic innervation in 2 distinct DCM models invariably exhibited transmural (epicardial to endocardial) gradients, with the endocardium being devoid of sympathetic nerve fibers versus controls. Further, the severity of transmural innervation gradients was correlated with VAs. Transmural innervation gradients were also identified in human left ventricular free wall samples from DCM versus controls. We investigated mechanisms underlying this relationship by in silico studies in 1D, 2D, and 3D models of failing and normal human hearts, finding that arrhythmogenesis increased as heterogeneity in sympathetic innervation worsened. Specifically, both DCM-induced myocyte electrical remodeling and spatially inhomogeneous innervation gradients synergistically worsened arrhythmogenesis. Thus, heterogeneous innervation gradients in DCM promoted arrhythmogenesis. Restoration of homogeneous sympathetic innervation in the failing heart may reduce VAs.

Keywords: Arrhythmias; Cardiology; Heart failure; Neurodegeneration.


Conflict of interest statement

Conflict of interest: OAA is a cofounder of NeuCures.

Figures

Figure 1
Figure 1. Transgenic DCM mouse model recapitulates human heart failure.
(A) Control (top row) and DCM (bottom row) mouse hearts imaged using a light microscope. (B) Digitally scanned images of transmural myocardial sections from control and DCM mice in early (left) and late (right) stages stained with Masson’s trichrome to indicate fibrosis. Image scale bars are 100 μm. (C) Images of left ventricular end systolic diameter (ESD, left) and end diastolic diameter (EDD, right) taken using echocardiography for control and DCM mice. Image scale bars are 2 mm. (D) Fibrosis levels in WT vs. DCM in myocardium of left ventricle in early (left, n = 5 for control, n = 7 for DCM, **P = 0.0045, Shapiro-Wilk test, Welch’s t test) and late stages (right, n = 6 for control, n = 5 DCM, ***P < 0.0001, Shapiro-Wilk test, Welch’s t test). LVEF (%) in control and DCM mice in early (left, n = 8 for control, n = 8 for DCM, ***P < 0.0001, Shapiro-Wilk test, Welch’s t test) and late stages (right, n = 8 for control, n = 8 for DCM, ***P < 0.0001, Shapiro-Wilk test, Welch’s t test). EDD in WT vs. DCM mice in early (left, n = 8 for control, n = 8 for DCM, ***P < 0.0001, Shapiro-Wilk test, Welch’s t test) and late stages (right, n = 8 for control, n = 8 for DCM, ***P < 0.0001, Shapiro-Wilk test, Welch’s t test). “Early” refers to mice less than or equal to 8 weeks of age, while “late” refers to mice older than 8 weeks.
Figure 2
Figure 2. DCM model shows decreased cardiac sympathetic innervation.
(A) Representative [11C]meta-Hydroxyephedrine PET-CT images taken at the 60-minute time point of WT (top) and DCM (bottom) mouse models scaled to units of percentage injected dose per gram of tissue (% ID/g) (head, heart, and tail labeled for orientation). (B) [11C]meta-Hydroxyephedrine time-activity curves (0–60 minutes) showing uptake in adrenergic nerve terminals of various tissues in control and DCM mice. (C) Quantification at 60 minutes to show uptake of [11C]meta-Hydroxyephedrine in adrenergic nerve terminals of various tissues in control and DCM mice: cardiac base (n = 4 for control, n = 4 for DCM, *P = 0.0286, Mann-Whitney test), cardiac apex (n = 4 for control, n = 4 for DCM, *P = 0.0286, Mann-Whitney test), cardiac ant. wall (n = 4 for control, n = 4 for DCM, *P = 0.0286, Mann-Whitney test), cardiac post. wall (n = 4 for control, n = 4 for DCM, *P = 0.0286, Mann-Whitney test), hind leg (n = 4 for control, n = 4 for DCM, P = 0.3429, Mann-Whitney test), and superior mediastinum (n = 4 for control, n = 4 for DCM, P = 0.1143, Mann-Whitney test).
Figure 3
Figure 3. DCM model shows a sympathetic innervation gradient and heterogeneity in innervation in the short-axis orientation.
(A) Schematic illustrating calculation of innervation gradients. (B) Comparisons of left ventricule (LV) internal diameter (n = 9 control, n = 9 DCM, *P = 0.0135, Shapiro-Wilk test, Welch’s t test), LV wall thickness (n = 9 control, n = 9 DCM, ***P = 0.0003, Shapiro-Wilk test, Welch’s t test), maximum epicardial to endocardial innervation gradient (n = 9 for control, n = 9 for DCM, **P = 0.0019, Shapiro-Wilk test, Mann-Whitney test), and mean apical epicardial to endocardial gradient (n = 9 control, n = 11 DCM, *P = 0.0260, Shapiro-Wilk test, Welch’s t test). (C) Immunohistochemical staining of WT (top) and DCM (bottom) heart sections. White arrows highlight innervation levels in epicardium and endocardium (1 arrow = low innervation, 3 arrows = high innervation). Scale bars are 100 μm. (D) Imaris 3D reconstruction of sympathetic innervation of heart sections from WT (top) and DCM (bottom) mice. (E) Summary heatmap of innervation gradient by level (base, mid, apex) and region (S, septal; L, lateral; A, anterior; P, posterior). (F) Short-axis innervation heterogeneity in WT and DCM mouse sections across base (n = 9 for control, n = 9 DCM, **P = 0.005, Shapiro-Wilk test, Mann-Whitney test), mid (n = 9 control, n = 9 DCM, ***P = 0.0003, Shapiro-Wilk test, Mann-Whitney test), and apex (n = 9 control, n = 9 DCM, *P = 0.0146, Shapiro-Wilk test, Mann-Whitney test) regions. (G) Reverse transcription quantitative PCR (RT-qPCR) comparing relative mRNA levels of Sema3a between WT and DCM mice in endocardial (left, n = 6 control, n = 4 DCM, **P = 0.0092, 2-way ANOVA/Tukey’s multiple comparisons test) and epicardial regions (right, n = 6 control, n = 4 DCM). Relative mRNA levels of NGF in endocardial (left, n = 6 control, n = 4 DCM) and epicardial regions (right, n = 6 control, n = 4 DCM).
Figure 4
Figure 4. DCM model shows increased heterogeneity of sympathetic innervation gradients in the long-axis orientation.
(A) Summary heatmap showing ratios of sympathetic innervation gradients by long-axis level comparison (Base/Mid, Mid/Apex) and region (S, septal; L, lateral; A, anterior; P, posterior). (B) Long-axis heterogeneity scores based on ratios of sympathetic innervation gradients between base/mid (B/M, n = 9 for control, n = 9 for DCM, P = 0.0644, Shapiro-Wilk test, Mann-Whitney test), mid/apex (M/A, n = 9 for control, n = 9 for DCM, *P = 0.0232, Shapiro-Wilk test, Mann-Whitney test), and total (scores of B/M and M/A combined, n = 9 for control, n = 9 for DCM, *P = 0.0216, Shapiro-Wilk test, Welch’s t test). Higher scores indicate increased heterogeneity in sympathetic innervation. Please refer to Figure 3A for visualization of the quantification method.
Figure 5
Figure 5. DCM model shows an increased gradient and heterogeneity in cardiac adrenergic innervation, as well as increased arrhythmogenesis.
(A) Schematic of norepinephrine (NE) injections used to induce VAs in WT and DCM mice. (B) Arrhythmias (PVCs, premature ventricular contractions [**P = 0.0091]; couplets [*P = 0.0171]; NSVT, nonsustained ventricular tachycardia [*P = 0.0350]) from ECG recordings of control and DCM mice (n = 8 for control, n = 12 for DCM, χ2 test). (C) Examples of arrhythmias in DCM mice including individual PVCs, couplets, bigeminy, and NSVT (scale bar is 100 ms). (D) PVC count after NE injection (left, n = 8 for control, n = 12 for DCM, *P = 0.0308, Shapiro-Wilk test, Mann-Whitney test). Arrhythmogenicity index (right, n = 8 for control, n = 12 for DCM, *P = 0.0113, Shapiro-Wilk test, Welch’s t test) based on ECG recordings of WT and DCM mice. (E) Correlation between arrhythmogenicity index score and mean gradient of mice with a mean epicardial-to-endocardial sympathetic innervation gradient greater than 1.4 (R2 = 0.56, simple linear regression).
Figure 6
Figure 6. Human samples of DCM show a heightened sympathetic innervation gradient.
(A) Digital imaging (original magnification, 20×) of IHC staining with TH on samples from patient controls (left, n = 5) and patients with HF (right, n = 6). Arrows indicate representative nerve fibers. (B) Patient demographic information (from left to right: age, sex [male or female], cause of death [COD], body mass index [BMI], and LVEF %). (C) Results from blind testing categorizing images as control or HF based on the presence of significantly depleted innervation in the endocardium (*P = 0.0152, n = 5 for control, n = 6 for HF, Fisher’s exact test).
Figure 7
Figure 7. 1D cable HF simulations with a gradient in β sympathetic innervation.
(A) Voltage action potential of the control ORd model (blue) and the HF ORd model (orange). (B) Top: Schematic of L-type Ca current conductance (PCa) ramp increase during a simulated β sympathetic surge. The increase in PCa is proportional to a β factor, which is the percentage of sympathetic innervation to that cell. Bottom: 500-cell cable with the top 100 cells having βtop = 1.0 and the bottom 400 cells having a variable βbot. Line scan shows an example with βbot = 0.5. (C) Three types of behaviors observed in HF simulation. Top: EAD alternans only in top part of the cable, middle: PVCs propagate out of the gradient region, bottom: whole-cable EAD alternans. (D) Top: Phase diagram of PVCs when varying PCa,Max vs. βbot. Bottom: Same phase diagram except with number of PVCs during the simulation.
Figure 8
Figure 8. 2D tissue HF simulations of cardiac tissue with heterogeneity in endocardial sympathetic innervation.
(A) Schematic of 2D simulation setup. A 500 × 500 cell tissue is divided into 3 regions. The epicardial region is always fully innervated with βepi = 1.0. The endocardial region has 2 subregions with varying βendo,top and βendo,bot values to simulate varying degrees of denervation. PCa is ramped up as shown in B to simulate a sympathetic surge. (B) Pseudo-ECG where PCa,max = 5, βendo,top = βendo,bot = 0.8 with normal sinus rhythm. (C) Pseudo-ECG and voltage snapshots where PCa,max = 6, βendo,top = βendo,bot = 0.8, resulting in PVCs (example marked with *) and T-wave repolarization abnormalities but no reentrant arrhythmias. (D) Same where PCa,max = 6, βendo,top = 0.2, and βendo,bot = 0.8, resulting in PVCs, ventricular tachycardia (VT) reentrant arrhythmia, and eventually ventricular fibrillation (VF). (E) Phase diagram of observed behaviors for different βendo,top versus βendo,bot values at PCa,max = 4, 5, 6, respectively. The blue bolded diagonal corresponds to cases of homogeneous innervation gradients.
Figure 9
Figure 9. Whole-ventricle simulations with varying heterogeneity in endocardial sympathetic innervation.
(A) Schematic of the epicardial and 2 endocardial regions that have varying degrees of sympathetic innervation. βepi = 1.0 for all cases. βendo,base and βendo,apex vary to form a gradient in sympathetic response. PCa is ramped up as shown in B to simulate a sympathetic surge. (B) ECGs under normal (non-HF) electrophysiology for 3 cases of different endocardial denervation patterns during a sympathetic surge. Stable sinus rhythm without arrhythmias is maintained. (C) ECGs under HF electrophysiology for the same 3 cases of different endocardial denervation patterns. Top ECG: High denervation but no gradient (βendo,base = 0.2, βendo,base = 0.2) results in sinus rhythm. Middle ECG: Low denervation but no gradient (βendo,base = 0.8, βendo,base = 0.8) results in repeating PVCs. Voltage snapshots of the whole ventricle are shown below, numbered to correspond to the arrows on the ECG. Bottom ECG: Mixed denervation with a strong gradient (βendo,base = 0.8, βendo,base = 0.2) results in a polymorphic VT to VF arrhythmia. Voltage snapshots shown below, numbered corresponding to the arrows.

References

    1. Zipes DP, Rubart M. Neural modulation of cardiac arrhythmias and sudden cardiac death. Heart Rhythm. 2006;3(1):108–113. doi: 10.1016/j.hrthm.2005.09.021. - DOI - PMC - PubMed
    1. Fukuda K, et al. Cardiac innervation and sudden cardiac death. Circ Res. 2015;116(12):2005–2019. doi: 10.1161/CIRCRESAHA.116.304679. - DOI - PMC - PubMed
    1. Ieda M, Fukuda K. New aspects for the treatment of cardiac diseases based on the diversity of functional controls on cardiac muscles: the regulatory mechanisms of cardiac innervation and their critical roles in cardiac performance. J Pharmacol Sci. 2009;109(3):348–353. doi: 10.1254/jphs.08R25FM. - DOI - PubMed
    1. Franciosi S, et al. The role of the autonomic nervous system in arrhythmias and sudden cardiac death. Auton Neurosci. 2017;205:1–11. doi: 10.1016/j.autneu.2017.03.005. - DOI - PubMed
    1. Packer M, et al. The effect of carvedilol on morbidity and mortality in patients with chronic heart failure. U.S. Carvedilol Heart Failure Study Group. N Engl J Med. 1996;334(21):1349–1355. doi: 10.1056/NEJM199605233342101. - DOI - PubMed

Publication types