. 2023 Nov 22;8(22):e171772.
doi: 10.1172/jci.insight.171772.

GADD45A is a mediator of mitochondrial loss, atrophy, and weakness in skeletal muscle

Affiliations

GADD45A is a mediator of mitochondrial loss, atrophy, and weakness in skeletal muscle

George R Marcotte et al. JCI Insight. .

Abstract

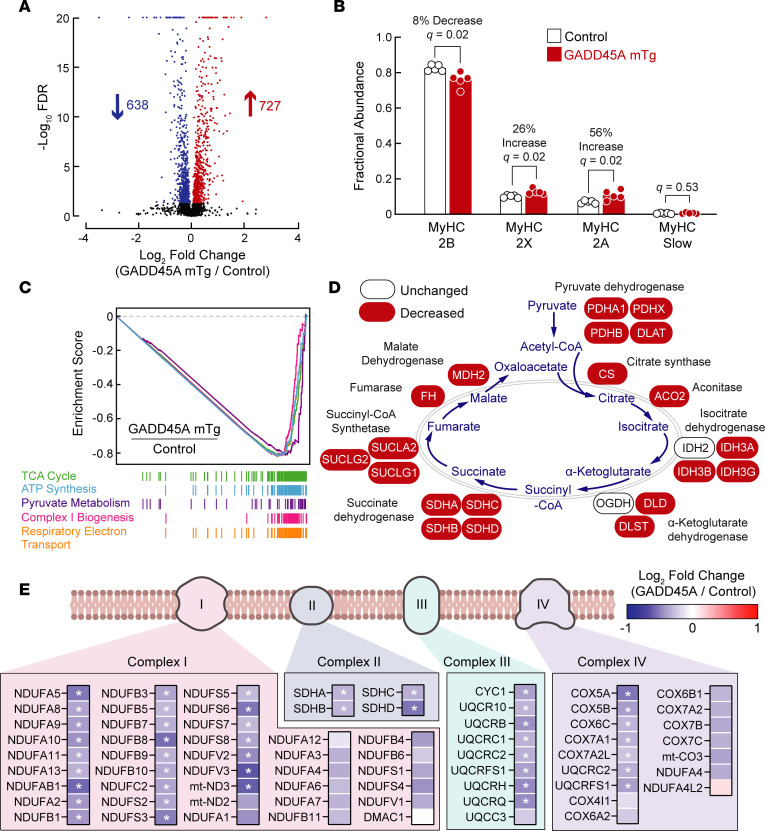
Aging and many illnesses and injuries impair skeletal muscle mass and function, but the molecular mechanisms are not well understood. To better understand the mechanisms, we generated and studied transgenic mice with skeletal muscle-specific expression of growth arrest and DNA damage inducible α (GADD45A), a signaling protein whose expression in skeletal muscle rises during aging and a wide range of illnesses and injuries. We found that GADD45A induced several cellular changes that are characteristic of skeletal muscle atrophy, including a reduction in skeletal muscle mitochondria and oxidative capacity, selective atrophy of glycolytic muscle fibers, and paradoxical expression of oxidative myosin heavy chains despite mitochondrial loss. These cellular changes were at least partly mediated by MAP kinase kinase kinase 4, a protein kinase that is directly activated by GADD45A. By inducing these changes, GADD45A decreased the mass of muscles that are enriched in glycolytic fibers, and it impaired strength, specific force, and endurance exercise capacity. Furthermore, as predicted by data from mouse models, we found that GADD45A expression in skeletal muscle was associated with muscle weakness in humans. Collectively, these findings identify GADD45A as a mediator of mitochondrial loss, atrophy, and weakness in mouse skeletal muscle and a potential target for muscle weakness in humans.

Keywords: Metabolism; Mitochondria; Muscle Biology; Skeletal muscle.


Conflict of interest statement

Conflict of interest: SME, CMA, BBR, and ARJ are shareholders in Emmyon, Inc. SME and CMA serve as officers at Emmyon, Inc., and BBR and ARJ serve as consultants.

Figures

Figure 1
Figure 1. Transgenic mice with constitutive expression of GADD45A in skeletal muscle.
(A) Schematic illustration of skeletal muscle–specific GADD45A-transgenic mice (GADD45A-mTg mice), which express a mouse Gadd45a cDNA under control of the skeletal muscle–specific (human ACTA1 [HSA]) promoter. In GADD45A-mTg mice, a skeletal muscle–specific Cre recombinase transgene (HSA-MerCreMer) excises a Lox-STOP-Lox cassette upstream of the Gadd45a cDNA. In our studies of GADD45A-mTg mice, the control mice were littermates who lacked the HSA-MerCreMer transgene and thus retained the Lox-STOP-Lox cassette. (B) Heart, kidney, liver, soleus, triceps brachii (Triceps), and quadriceps femoris (Quad.) were collected from 15-month-old male littermate control and GADD45A-mTg mice, then subjected to quantitative PCR (qPCR) analysis of Gadd45a mRNA. Each circle represents the value from 1 animal, and bars indicate mean values. (C) Protein from quadriceps muscles of 15-month-old male littermate control (Ctrl) and GADD45A-mTg mice was subjected to tandem mass tag (TMT) labeling and mass spectrometry, followed by quantification of the relative abundance of GADD45A protein. Each circle represents the value from 1 animal, and bars indicate mean values. (D) Quadriceps and kidneys were harvested from littermate control and GADD45A-mTg mice at 2, 4, 6, and 8 weeks of age, then subjected to qPCR analysis of Gadd45a mRNA. Data are means ± SD from 2–3 control mice and 3–4 GADD45A-mTg mice per time point. Some error bars are too small to see. (E) Fractional abundance and rank order of all detected proteins, including GADD45A, in quadriceps muscle of 15-month-old male littermate control and GADD45A-mTg mice, as assessed by TMT-mass spectrometry.
Figure 2
Figure 2. GADD45A expression in skeletal muscle reduces skeletal muscle mass and skeletal muscle function.
(A and B) Grip strength in 15-month-old male (A) and 17-month-old female (B) littermate control and GADD45A-mTg mice. (C and D) Wet weights of bilateral quadriceps (Quad.), gastrocnemius (Gastroc.), triceps brachii (Triceps), tibialis anterior (TA), and soleus muscles in 15-month-old male (C) and 17-month-old female (D) littermate control and GADD45A-mTg mice. (E) Maximal treadmill running distance in 15-month-old male littermate control and GADD45A-mTg mice. (F) Ex vivo specific force in the extensor digitorum longus muscles of 15-month-old male littermate control and GADD45A-mTg mice. (AF) Each circle represents the value from 1 animal, and horizontal bars indicate mean values. P values were determined with unpaired 2-tailed t tests.
Figure 3
Figure 3. Chronic expression of GADD45A in skeletal muscle induces atrophy of large glycolytic MyHC-2B–positive muscle fibers and increases the size and relative amount of small MyHC-2A–positive muscle fibers.
(A) MyHC nomenclature and typical characteristics of skeletal muscle fiber types that contain specific MyHC isoforms. (BG) Quadriceps and TA muscles from 15-month-old male littermate control and GADD45A-mTg mice were sectioned and subjected to immunofluorescence microscopy using antibodies targeting laminin (white), MyHC-slow (red), MyHC-2A (yellow), and MyHC-2B (blue). Muscle fibers without MyHC-slow, MyHC-2A, and MyHC-2B were assigned to the unstained MyHC isoform (MyHC-2X). (BD) Representative images (B), relative amounts of muscle fibers expressing MyHC-2B or MyHC-2A (C), and average minimal Feret diameters of muscle fibers expressing MyHC-2B or MyHC-2A (D) in the quadriceps. (EG) Representative images (E), relative amounts of muscle fibers expressing MyHC-2B or MyHC-2A (F), and average minimal Feret diameters of muscle fibers expressing MyHC-2B or MyHC-2A (G) in the TA. (HJ) Soleus muscles from 15-month-old male littermate control and GADD45A-mTg mice were sectioned and subjected to immunofluorescence microscopy using antibodies targeting laminin (white), MyHC-slow (red), MyHC-2A (yellow), and MyHC-2X (blue). Muscle fibers without MyHC-slow, MyHC-2A, and MyHC-2X were assigned to the unstained MyHC isoform (MyHC-2B). Representative images (H), relative amounts of muscle fibers expressing MyHC-slow or MyHC-2A (I), and average minimal Feret diameters of muscle fibers expressing MyHC-slow or MyHC-2A (J). In C, D, F, G, I, and J, each data point represents the mean value from 1 muscle, horizontal bars indicate mean values from each group, and P values were determined with unpaired 2-tailed t tests.
Figure 4
Figure 4. Acute expression of GADD45A in skeletal muscle induces atrophy of large, glycolytic muscle fibers and increases the size and relative amount of small MyHC-2A–positive muscle fibers.
TA muscles of 8-week-old male C57BL/6 mice were transfected with plasmid DNA. One TA per mouse was transfected with 2.5 mg empty plasmid (control), and the contralateral TA in each mouse was transfected with 2.5 mg plasmid encoding mouse GADD45A. Seven days later, bilateral TAs were sectioned and subjected to immunofluorescence microscopy using antibodies targeting laminin, MyHC-2B, and MyHC-2A. (A) Representative images of entire TA muscle. MyHC-2B staining is blue, and MyHC-2A staining is yellow. (B) Relative amounts of muscle fibers expressing MyHC-2B or MyHC-2A. (C) Average minimal Feret diameters of muscle fibers expressing MyHC-2B or MyHC-2A. (D) Higher magnification images showing laminin staining (white), MyHC-2B staining (blue), MyHC-2A staining (yellow), and fibers expressing both MyHC-2B and MyHC-2A (green). (E) Relative amounts of muscle fibers expressing both MyHC-2B and MyHC-2A. (F) Average minimal Feret diameters of muscle fibers expressing both MyHC-2B and MyHC-2A. In B, C, E, and F, each data point represents the mean value from 1 muscle, horizontal bars indicate mean values from each group, and P values were determined with paired 2-tailed t tests.
Figure 5
Figure 5. GADD45A reduces levels of numerous proteins that are required for oxidative metabolism in skeletal muscle.
Protein from quadriceps muscles of 15-month-old male littermate control and GADD45A-mTg mice was subjected to TMT labeling and mass spectrometry, followed by quantification of the relative abundance of 5,206 proteins. Data are from 5 muscles per genotype. (A) Volcano plot showing log2 fold-changes of all identified proteins in GADD45A-mTg muscles relative to levels in control muscles versus statistical significance of those changes. At FDR < 0.05, levels of 638 proteins were decreased in GADD45A-mTg muscles, and levels of 727 proteins were increased. Complete proteomic data are shown in Supplemental Table 1. (B) Fractional abundance of MyHC-2B, MyHC-2X, MyHC-2A, and MyHC-slow, calculated from data in Supplemental Table 2. Each data point represents the value from 1 muscle, and bars indicate mean values. q values were determined with multiple unpaired 2-tailed t tests. (C) Enrichment plots of the 5 most significantly affected Reactome pathways, based on gene set enrichment analysis (GSEA) of the proteomic data. All 5 pathways were downregulated with FDR < 10–5. Complete GSEA results are shown in Supplemental Table 3. (D) Schematic illustrating detected proteins involved in the TCA cycle and effect of GADD45A on levels of those proteins. GADD45A significantly decreased 20 of the 22 detected proteins (FDR < 0.05). (E) Schematic of mitochondrial electron transport chain complexes I, II, III, and IV, with an underlying heatmap showing detected proteins in those complexes, and the effect of GADD45A on levels of those proteins. Asterisks indicate FDR < 0.05.
Figure 6
Figure 6. GADD45A reduces oxidative capacity in glycolytic and oxidative skeletal muscle fibers.
Quadriceps and TA muscles from 15-month-old male littermate control and GADD45A-mTg mice were cryosectioned. Muscle cross sections were stained for succinate dehydrogenase (SDH) activity and then labeled with antibodies targeting MyHC isoforms and laminin. Cross sections were then imaged by bright-field and fluorescence microscopy to capture SDH activity and immunostaining, respectively. Captured images were then overlaid, and SDH activity and MyHC expression were quantitated in every fiber in the muscle, in order to determine SDH activity as a function of MyHC expression, as further illustrated in Supplemental Figure 7. (A) Quantification of MyHC expression versus SDH activity in quadriceps. (B) Representative SDH and MyHC/laminin stains of quadriceps cross sections from littermate control and GADD45A-mTg mice. (C) Quantification of MyHC and laminin expression versus SDH activity in TA. (D) Representative SDH and MyHC/laminin stains of TA cross sections from littermate control and GADD45A-mTg mice. In A and C, each data point represents the mean value from 1 muscle, bars indicate mean values from each group, and P values were determined with unpaired 2-tailed t tests.
Figure 7
Figure 7. GADD45A reduces skeletal muscle oxidative capacity in an MEKK4-dependent manner.
TA muscles of 8-week-old male C57BL/6 mice were transfected with plasmid DNA. (AE) One TA per mouse was transfected with 2.5 mg empty plasmid (control), and the contralateral TA in each mouse was transfected with 2.5 mg GADD45A plasmid. (AC) Seven days posttransfection, mitochondria from bilateral TAs were isolated and used for quantification of mitochondrial protein (A), mitochondrial respiration normalized to the amount of skeletal muscle (B), and mitochondrial respiration normalized to the amount of mitochondrial protein (C). (D and E) Seven days posttransfection, bilateral TAs were sectioned and subjected to immunohistochemical analysis of SDH activity. (D) Quantification of total SDH activity in entire muscle cross sections. (E) Representative images. (F and G) One TA per mouse was transfected with 2.5 mg GADD45A plasmid + 10 mg nontargeting control RNAi plasmid (control), and the contralateral TA in each mouse was transfected with 2.5 mg GADD45A plasmid + 10 mg RNAi plasmid targeting MEKK4. Seven days later, bilateral TAs were sectioned and subjected to immunohistochemical analysis of SDH activity. (F) Quantification of total SDH activity in entire muscle cross sections. (G) Representative images. (H and I) One TA per mouse was transfected with 7.5 mg empty plasmid (control), and the contralateral TA in each mouse was transfected with 7.5 mg plasmid encoding MEKK4ΔN. (H and I) Fourteen days posttransfection, bilateral TAs were sectioned and subjected to immunohistochemical analysis of SDH activity. (H) Quantification of total SDH activity in entire muscle cross sections. (I) Representative images. In AD, F, and H, each data point represents the value from 1 muscle and bars indicate mean values. P values were determined with paired 2-tailed t tests. In AC, **P < 0.01 and *P < 0.05.
Figure 8
Figure 8. A constitutively active MEKK4 construct (MEKK4ΔN) decreases MyHC-2B, increases MyHC-2A, and decreases mitochondrial proteins in skeletal muscle.
TA muscles of 8-week-old male C57BL/6 mice were transfected with plasmid DNA. One TA per mouse was transfected with 7.5 mg empty plasmid (control), and the contralateral TA in each mouse was transfected with 7.5 mg plasmid encoding MEKK4ΔN. Seven days posttransfection, bilateral TAs were harvested, and TA protein was subjected to TMT-mass spectrometry, followed by quantification of the relative abundance of 6,870 proteins. Data are from 4 muscles per genotype. (A) Quantification of MEKK4 (MAP3K4) protein. Each data point represents the value from 1 muscle, and bars indicate mean values. Detailed proteomic data are shown in Supplemental Table 5. (B) Fractional abundance of MyHC-2B, MyHC-2X, MyHC-2A, and MyHC-slow, calculated from data in Supplemental Table 6. Each data point represents the value from 1 muscle, and bars indicate mean values. q values were determined with multiple unpaired 2-tailed t tests. (C) Enrichment plots of Reactome pathways that were strongly repressed by MEKK4ΔN, based on GSEA of the proteomic data. All 5 pathways were downregulated with FDR < 10–5. Complete GSEA results are shown in Supplemental Table 7. (D) Schematic illustrating detected proteins involved in the TCA cycle and effect of MEKK4ΔN on levels of those proteins. MEKK4ΔN significantly decreased all the detected proteins (FDR < 0.05). (E) Schematic of mitochondrial electron transport chain complexes I, II, III, and IV, with an underlying heatmap showing detected proteins in those complexes, and the effect of MEKK4ΔN on levels of those proteins. Asterisks indicate FDR < 0.05.
Figure 9
Figure 9. Skeletal muscle GADD45A expression is associated with muscle weakness in humans.
(AE) Human participants who were 20 to 35 years old (young) or 65 to 85 years old (old) volunteered for a study in which GADD45A mRNA levels in the vastus lateralis muscle were assessed by RNA sequencing and muscle function was assessed by measurement of maximal knee extensor strength and peak power. Each data point represents the value from 1 participant. See Supporting Data Values file. (A) GADD45A mRNA levels. (B) Maximal leg strength, assessed via 1 repetition maximum (1 RM) leg extension, a dynamic movement through a full range of motion of knee extension. (C) Peak leg power production. (AC) Horizontal bars indicate mean values, and P values were determined with unpaired 2-tailed t tests. (D and E) Correlation of GADD45A mRNA levels to maximal leg strength (D) and peak leg power (E). (FH) Human participants aged 50 to 63 years old volunteered for a study using a model of disuse muscle atrophy. In each participant, one leg was immobilized with a leg brace for 7 days, and the contralateral leg remained mobile and served as an intra-individual control. In both legs, maximal leg strength and GADD45A mRNA in the vastus lateralis muscle were quantified at baseline (day 0, prior to unilateral leg immobilization) and again on day 7 (after unilateral leg immobilization). Each data point represents the fold change (day 7/day 0) from the mobile or immobile leg, as indicated. (F and G) Fold-change in GADD45A mRNA levels (F) and maximal leg strength (G). Horizontal bars indicate mean values. P values were determined with paired 2-tailed t tests. (H) Correlation of GADD45A mRNA to maximal leg strength. (D, E, and H) Pearson’s correlation coefficient and P value were determined with simple linear regression. RPKM, reads per kilobase million.
Figure 10
Figure 10. Schematic illustrating biochemical mechanisms upstream and downstream of GADD45A in skeletal muscle fibers and their cellular and phenotypic effects.
The NMR structure of GADD45A was identified in ref. .

References

    1. Larsson L, et al. Sarcopenia: aging-related loss of muscle mass and function. Physiol Rev. 2019;99(1):427–511. doi: 10.1152/physrev.00061.2017. - DOI - PMC - PubMed
    1. Sartori R, et al. Mechanisms of muscle atrophy and hypertrophy: implications in health and disease. Nat Commun. 2021;12(1):330. doi: 10.1038/s41467-020-20123-1. - DOI - PMC - PubMed
    1. Ebert SM, et al. Skeletal muscle atrophy: discovery of mechanisms and potential therapies. Physiology (Bethesda) 2019;34(4):232–239. - PMC - PubMed
    1. Ebert SM, et al. Biology of activating transcription factor 4 (ATF4) and its role in skeletal muscle atrophy. J Nutr. 2022;152(4):926–938. doi: 10.1093/jn/nxab440. - DOI - PMC - PubMed
    1. Sacheck JM, et al. Rapid disuse and denervation atrophy involve transcriptional changes similar to those of muscle wasting during systemic diseases. FASEB J. 2007;21(1):140–155. doi: 10.1096/fj.06-6604com. - DOI - PubMed

Publication types