. 2023 Dec 1;133(23):e170771.
doi: 10.1172/JCI170771.

Claudin-2 protects against colitis-associated cancer by promoting colitis-associated mucosal healing

Affiliations

Claudin-2 protects against colitis-associated cancer by promoting colitis-associated mucosal healing

Rizwan Ahmad et al. J Clin Invest. .

Abstract

Patients with inflammatory bowel disease (IBD) are susceptible to colitis-associated cancer (CAC). Chronic inflammation promotes the risk for CAC. In contrast, mucosal healing predicts improved prognosis in IBD and reduced risk of CAC. However, the molecular integration among colitis, mucosal healing, and CAC remains poorly understood. Claudin-2 (CLDN2) expression is upregulated in IBD; however, its role in CAC is not known. The current study was undertaken to examine the role for CLDN2 in CAC. The AOM/DSS-induced CAC model was used with WT and CLDN2-modified mice. High-throughput expression analyses, murine models of colitis/recovery, chronic colitis, ex vivo crypt culture, and pharmacological manipulations were employed in order to increase our mechanistic understanding. The Cldn2KO mice showed significant inhibition of CAC despite severe colitis compared with WT littermates. Cldn2 loss also resulted in impaired recovery from colitis and increased injury when mice were subjected to intestinal injury by other methods. Mechanistic studies demonstrated a possibly novel role of CLDN2 in promotion of mucosal healing downstream of EGFR signaling and by regulation of Survivin expression. An upregulated CLDN2 expression protected from CAC and associated positively with crypt regeneration and Survivin expression in patients with IBD. We demonstrate a potentially novel role of CLDN2 in promotion of mucosal healing in patients with IBD and thus regulation of vulnerability to colitis severity and CAC, which can be exploited for improved clinical management.

Keywords: Colorectal cancer; Gastroenterology; Inflammatory bowel disease; Tight junctions.


Conflict of interest statement

Conflict of interest: The authors have declared that no conflict of interest exists.

Figures

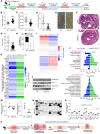
Figure 1
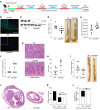
Figure 1. Colitis-associated cancer is significantly inhibited in Cldn2KO mice.
(A) Schematic of the experimental strategy to induce colitis-associated colon cancer. (B and C) Representative immunofluorescence and immunoblot analysis confirming loss of CLDN2 expression in Cldn2KO mice. (D) Representative images of colons and colon length in AOM/DSS-treated Cldn2KO and WT mice (n = 8/group). (E) Colon edema (g/cm; n = 8/group). (FH) Percentage of colon involved by inflammation (n = 8/group), representative H&E images, and mucosal injury score (WT/Cldn2KO: n = 10/6 mice). (I and J) Tumor growth and representative H&E analysis of the colons from AOM/DSS-treated Cldn2KO (n = 10) and WT (n = 6) mice. (K and L) Size of the colon polyps and dysplasia in Cldn2KO (n = 6) versus WT (n = 10) mice. Data in DF, H and I are presented as the mean ± SEM. *P < 0.05, **P < 0.01 by 2-tailed unpaired t test. Data in K and L are presented as percentage number. ****P < 0.0001 by χ2 and Fisher’s exact test. Scale bar: 100 μM (B and G); 200 μM (J).
Figure 2
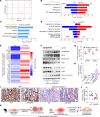
Figure 2. Cldn2 loss-of-expression promotes proinflammatory and proapoptotic transcriptional programs in mice subjected to colitis-associated cancer.
(A) Scatter plot depicting the comparative transcriptomic profile (RNA-Seq) between Cldn2KO and WT mice subjected to colitis-associated cancer (CAC) (n = 3/group). (BD) KEGG pathway and GO biological function analysis based on differentially expressed genes (DEGs) in RNA-Seq analysis using colon RNA from AOM/DSS-treated Cldn2KO and WT mice (n = 3/group). (E) Heatmap showing selected DEGs (n = 3/group). (FH) Immunoblotting and densitometric analysis of proteins involved in inflammation, proliferation, cell survival, and apoptosis in AOM/DSS-treated Cldn2KO and WT mice (n = 4/group). (I and J) Representative images of Ki67 and cleaved caspase-3 expression, and proliferation index (Ki67/cleaved caspase-3 expression) in AOM/DSS-treated mice (n = 4/group; 3 images/mice). (K) Graphical modeling representing the overall outcome of Cldn2KO mice when subjected to CAC. Data in G, H, and J are presented as the mean ± SEM. *P < 0.05, **P < 0.01, ***P < 0.001, ****P < 0.0001 by 2-tailed unpaired t test. Scale bar: 100 μM.
Figure 3
Figure 3. Colitis-mediated regulation of CLDN2 expression is context dependent and biphasic.
(A and B) Epithelial enriched fractions of WT mouse colon that were untreated, subjected to DSS-induced colitis and recovery, or chronic DSS-induced colitis (n = 3/group). (C and D) Representative images and IHC intensity analysis using anti-CLDN2 antibody (n = 5/group). (E) Coimmunofluorescence image analysis for CLDN2 and SCA-1 in colon Swiss roll of mice subjected to acute DSS-induced colitis, DSS-induced colitis/recovery, or chronic DSS-induced colitis (n = 5/group). (F and G) Coimmunofluorescence and quantitative analysis using anti-CLDN2 and -Ki67 antibodies (n = 6/group). (H and I) MTT assay and RT-qPCR analysis using Caco2 cells subjected to DSS-induced injury and subsequent recovery (n = 3 independent experiments). (J) Immunoblot analysis for CLDN2, ECAD, c-Myc, and P27/Kip1 (n = 3 independent experiments). (K) Model depicting regulation of CLDN2 during colitis (injury phase) and recovery (repair/regeneration phase). Data in B, D, G, and HJ are presented as the mean ± SEM. *P < 0.05, **P < 0.01, ***P < 0.001, ****P < 0.0001, $$$$P < 0.0001 by 1-way ANOVA with Tukey’s test. Scale bar: 100 μM (C, E, and F); 200 μM (C).
Figure 4
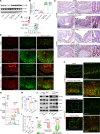
Figure 4. Cldn2KO mice show impaired recovery and mucosal healing following DSS-induced colitis.
(A) Schematic illustration of experimental design. (B) Percentage weight change in Cldn2KO and WT mice subjected to DSS-induced colitis and recovery (Cldn2KO/WT: n = 8/7). (C) Km plot depicting mouse mortality during colitis/recovery (Cldn2KO/WT: n = 8/7). (D) Colon thickness (g/cm; Cldn2KO/WT: n = 8/7). (E and F) Mucosal injury score and representative H&E analysis (Cldn2KO/WT: n = 8/7). (G) Quantitation of epithelial regeneration by a pathologist in Cldn2KO and WT mice during recovery from colitis (Cldn2KO/WT: n = 8/7). (H) Representative images showing colonoscopic evaluation of colonic inflammation in Cldn2KO mice compared with WT mice. (I) Coimmunofluorescence image analysis for SCA-1 in colon Swiss roll of Cldn2KO and WT mice subjected to recovery from colitis. (J) Wound healing assay using colonoscope-assisted wounding. (K) Quantitative image analysis shows delayed mucosal healing in Cldn2KO mice compared with that in WT mice (n = 5/group). Data in B, D, E, G, and K are presented as the mean ± SEM. *P < 0.05, **P < 0.01, ***P < 0.001 by 2-tailed unpaired t test. Survival data in C was assessed by log-rank (Mantel-Cox) test. Scale bar: 100 μM.
Figure 5
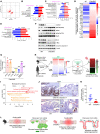
Figure 5. Loss of Cldn2 results in a defective mucosal healing transcriptomic response, which differs from the conserved gene expression profile between WT mice recovering from IBD and patients with IBD.
(A) Scatter graph showing differential gene expression between Cldn2KO and WT mice recovering from colitis (n = 3/group). (B and C) Most prominent KEGG pathways and GO biological processes based on gene expression upregulated in Cldn2KO mice versus WT mice during recovery from colitis (n = 3/group). (D) Heatmap depicting differential gene expression, which was primarily associated with cell cycle, apoptosis, inflammation, and immune homeostasis (Cldn2KO versus WT mice; n = 3/group). (E) Most prominent downregulated KEGG pathways in Cldn2KO mice compared with WT mice (n = 3/group). (F and G) Immunoblotting and densitometric analysis of proteins involved in inflammation, proliferation, survival, and apoptosis in mice recovering from colitis (Cldn2KO; n = 5) and WT (n = 4) mice. (H) The gene profile in Cldn2KO mice recovering from colitis differs from the conserved profile between mice and humans. (I) Significant dysregulation of GO biological processes that are associated with mucosal healing in Cldn2KO mice versus WT mice. (J and K) Immunohistochemical analysis for cleaved caspase-3 and Ki67, and proliferation index (WT/Cldn2KO: n = 4/5 mice; 3 fields in each mice Swiss role). (L) Schematics showing that loss of CLDN2 results in impaired mucosal healing. Data in G and K are presented as the mean ± SEM. *P < 0.05, ***P < 0.001, ****P < 0.0001 by 2-tailed unpaired t test. Scale bar: 100 μM.
Figure 6
Figure 6. Inhibiting EGFR signaling in WT mice recovering from DSS-induced colitis inhibits CLDN2 upregulation and impairs mucosal healing.
(A) Differentially expressed genes (DEGs; RNA-Seq analysis) in mice recovering from DSS-induced colitis show upregulated Cldn2 expression, along with Egf and Ereg (EGFR ligands) (n = 3/group). (B) Immunoblot analysis using Caco-2 cells subjected to DSS-induced injury/repair with or without inhibitors of EGFR activation (n = 3 independent experiments). (C) Km analysis for survival in mice receiving EGFR inhibitor (gefitinib) during recovery from colitis (vehicle/gefitinib: n = 9/13). (D) Colon thickness (g/cm; vehicle/gefitinib: n = 8/11). (E) H&E images showing profound mucosal injury/impaired regeneration in gefitinib-treated mice and (F) mucosal injury score (vehicle/gefitinib: n = 8/9). (G and H) Immunoblot analysis using total colon lysate. pErk1/2/Erk1/2 and CLDN2 expression served as a marker of EGFR activation (water/DSS/vehicle/gefitinib: n = 2/3/3/3). (IK) Immunoblot analysis for the markers of inflammation, cell survival, and apoptosis in gefitinib- and vehicle-treated mice during recovery from colitis (vehicle/gefitinib: n = 4/5). (L) Proliferative index (vehicle/gefitinib: n = 4/5). (M) Epithelial regenerative index in gefitinib-treated mice versus vehicle-treated WT mice (vehicle/gefitinib: n = 8/9). (N) Graphical summary depicting integration between EGFR and CLDN2 in colitis-associated epithelial restitution/healing. Survival data in C were assessed by log-rank (Mantel-Cox) test. Data in D, F, and KM are presented as the mean ± SEM. *P < 0.05, **P < 0.01, ***P < 0.001, ****P < 0.0001 by 2-tailed unpaired t test. Scale bar: 100 μM.
Figure 7
Figure 7. CLDN2 overexpression in the intestinal epithelium protects mice from colitis-associated cancer.
(A) Graphical illustration of AOM/DSS tumorigenesis in Villin-Cldn2TG and WT mice. (B) Colon length (cm; WT/Villin-Cldn2TG: n = 24/31). (C) Colon edema (g/cm; WT/Villin-Cldn2TG: n = 24/31). (D and E) Tumor growth in the colon and representative images of the AOM/DSS-treated Villin-Cldn2TG and WT mouse colon (WT/Villin-Cldn2TG: n = 24/31). (F and G) H&E analysis and mucosal injury score (WT/Villin-Cldn2TG: n = 24/37). (H) Percentage of dysplasia in mice treated with AOM/DSS. (I) RNA-Seq analysis (differentially regulated genes [DEGs]) in mice subjected to AOM/DSS treatment (n = 3/group). (J) Significantly altered KEGG pathways and GO biological function in AOM/DSS-treated Villin-Cldn2TG and WT mice (n = 3/group). (K) Heatmap depicting the DEGs associated with cell cycle, apoptosis, inflammation, and immune homeostasis (n = 3/group). (L and M) Immunoblotting and densitometric analysis for Stat3 and NF-κB activation in mice subjected to AOM/DSS (n = 4/group). (N and O) High-throughput analysis for cytokine expression using total colon lysate and densitometry evaluations (n = 3/group). (P) Cartoon summarizing the role of upregulated CLDN2 in CAC. Data in BD, G, and M are presented as the mean ± SEM. **P < 0.01, ***P < 0.001, ****P < 0.0001 by 2-tailed unpaired t test. Data in H are presented as percentage number. ****P < 0.0001 by Fisher’s exact test. Data in O are presented as the mean ± SEM. ****P < 0.0001 by 1-way ANOVA with Dunnett’s multiple comparisons. Scale bar: 200 μM.
Figure 8
Figure 8. CLDN2 expression promotes colitis-associated epithelial repair/regeneration in Survivin-dependent manner.
(AC) Coimmunofluorescence and quantitative analysis for CLDN2 and Survivin expression in WT mice recovering from DSS-induced colitis (n = 6/group). (D and E) Immunoblot analysis using lysates from the DSS-treated colonic epithelial cells and ex vivo 3D culture of the colon crypts from control and Cldn2KD cells and WT and Villin-Cldn2TG mice (n = 3 independent experiments). (F) Immunoblots analysis using lysate from colon epithelial cells of Cldn2KO and WT mice subjected to the DSS-induced injury/repair (n = 3 independent experiments). (G) Caco-2 cells subjected to DSS-induced injury/repair with or without inhibitors of the Survivin(n = 3 independent experiments). (H and I) Immunoblotting and densitometry analysis of Survivin in Cldn2KO (n = 3) and Villin-Cldn2TG (n = 3) mice versus WT (n = 3 and 3) mice subjected to recovery from colitis, chronic colitis, and CAC tumorigenesis (WT/Cldn2KO: n = 3/3; WT/Villin-Cldn2TG: n = 4/4). (J) Schematic illustration depicting the role of CLDN2 and Survivin in mucosal repair/regeneration. Data in C are presented as the mean ± SEM. **P < 0.01, $$P < 0.01, ****P < 0.0001, $$$$P < 0001 by 1-way ANOVA with Tukey’s test. Scale bar: 100 μM (A); 200 μM (B).
Figure 9
Figure 9. In patients with IBD, colitis-associated CLDN2 upregulation is concentrated primarily in the regenerative crypts and correlates with Ki67 and Survivin expression.
(A) In silico analysis of published transcriptome data from patients with IBD (–65) (n = 360) demonstrating significantly upregulated CLDN2 expression compared with that in normal individuals (n = 153). (B and C) Immunohistochemical analysis of CLDN2 expression in biopsy samples from patients with IBD versus normal colon and intensity scoring. The pathological evaluation demonstrated significantly higher CLDN2 expression in the regenerative crypts (normal: n = 12; chronically injured crypts: n = 18; regenerative crypts: n = 21). (DF) Coimmunofluorescence analysis of CLDN2 and Ki67 expression, along with in silico correlation analysis between CLDN2 and MKI67 in published data sets from patients with IBD (–65) (n = 10/group). (G and H) Survivin and CLDN2 expression in IBD biopsy samples compared with normal samples (12/group). (I) In silico analysis of the correlation between CLDN2 and BIRC5 expression in published data sets from patients with IBD (–65) (normal/IBD: n = 153/360). Data in C are presented as the mean ± SEM. *P < 0.05, ****P < 0.0001 by 1-way ANOVA with Tukey’s test. Data in E and H are presented as the mean ± SEM. *P < 0.05, **P < 0.01, ***P < 0.001 by 2-tailed unpaired t test. Pearson’s correlation analysis was performed in F and I. Scale bar: 100 μM.

References

    1. Fumery M, et al. Incidence, risk factors, and outcomes of colorectal cancer in patients with ulcerative colitis with low-grade dysplasia: a systematic review and meta-analysis. Clin Gastroenterol Hepatol. 2017;15(5):665–674.e5. doi: 10.1016/j.cgh.2016.11.025. - DOI - PMC - PubMed
    1. Jess T, et al. Increased risk of intestinal cancer in Crohn’s disease: a meta-analysis of population-based cohort studies. Am J Gastroenterol. 2005;100(12):2724–2729. doi: 10.1111/j.1572-0241.2005.00287.x. - DOI - PubMed
    1. Harpaz N, Polydorides AD. Colorectal dysplasia in chronic inflammatory bowel disease: pathology, clinical implications, and pathogenesis. Arch Pathol Lab Med. 2010;134(6):876–895. doi: 10.5858/134.6.876. - DOI - PubMed
    1. Robles AI, et al. Whole-exome sequencing analyses of inflammatory bowel disease-associated colorectal cancers. Gastroenterology. 2016;150(4):931–943. doi: 10.1053/j.gastro.2015.12.036. - DOI - PMC - PubMed
    1. Korelitz BI, et al. Histological healing favors lower risk of colon carcinoma in extensive ulcerative colitis. World J Gastroenterol. 2014;20(17):4980–4986. doi: 10.3748/wjg.v20.i17.4980. - DOI - PMC - PubMed

Publication types