. 2023 Dec 15;133(24):e171797.
doi: 10.1172/JCI171797.

SARS-CoV-2 mRNA vaccination-induced immunological memory in human nonlymphoid and lymphoid tissues

Affiliations

SARS-CoV-2 mRNA vaccination-induced immunological memory in human nonlymphoid and lymphoid tissues

Vanessa Proß et al. J Clin Invest. .

Abstract

Tissue-resident lymphocytes provide organ-adapted protection against invading pathogens. Whereas their biology has been examined in great detail in various infection models, their generation and functionality in response to vaccination have not been comprehensively analyzed in humans. We therefore studied SARS-CoV-2 mRNA vaccine-specific T cells in surgery specimens of kidney, liver, lung, bone marrow, and spleen compared with paired blood samples from largely virus-naive individuals. As opposed to lymphoid tissues, nonlymphoid organs harbored significantly elevated frequencies of spike-specific CD4+ T cells compared with blood showing hallmarks of tissue residency and an expanded memory pool. Organ-derived CD4+ T cells further exhibited increased polyfunctionality over those detected in blood. Single-cell RNA-Seq together with T cell receptor repertoire analysis indicated that the clonotype rather than organ origin is a major determinant of transcriptomic state in vaccine-specific CD4+ T cells. In summary, our data demonstrate that SARS-CoV-2 vaccination entails acquisition of tissue memory and residency features in organs distant from the inoculation site, thereby contributing to our understanding of how local tissue protection might be accomplished.

Keywords: Adaptive immunity; Immunology; T cells; Vaccines.


Figures

Figure 1
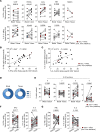
Figure 1. Quantification of SARS-CoV-2 vaccine–induced CD4+ Th cells in nonlymphoid and lymphoid organs.
(A) Summary of all specimens included for analysis of vaccine-specific T cells. (B) Schematic workflow overview. (C) Exemplary plots showing vaccine-specific CD137+CD40L+ CD4+ T cells from the indicated organs as identified by FACS. (D) Proportions of individuals showing spike-specific CD4+ T cell responses within the depicted organs. Statistically significant differences were tested with 2-sided Fisher’s exact test with n as in A. (E) Proportions of individuals with spike S1 domain–specific IgG responses, stratified for cellular responders and nonresponders. Statistically significant differences were tested with 2-sided Fisher’s exact test. (F) Simple linear regression analysis between frequencies of spike-specific Th cells and time since last vaccination with n as in A. (G) Pairwise comparison of spike-specific CD4+ T cell frequencies in peripheral blood–derived and organ-derived specimens as indicated. Liver: n = 8, Wilcoxon’s test; kidney: n = 8, paired t test; lung: n = 7, paired t test; bone marrow: n = 10, Wilcoxon’s test; spleen: n = 3, paired t test. (H and I) Simple linear regression analysis between frequencies of specific Th cells in nonlymphoid organs and spike S1 domain–specific IgG levels (H) or paired blood samples (I). BAU, binding antibody units. (J) Simple linear regression analysis between specific blood-derived and paired nonlymphoid organ–derived T cell frequencies and age. Red symbols identify vaccinated individuals with a history of SARS-CoV-2 infection that were excluded from statistics.
Figure 2
Figure 2. Enrichment of specific memory-type CD4+ T cells in nonlymphoid tissues.
(A and B) Exemplary plots (A) for FACS-based identification of CD45RO+CD62L memory (Tm) and CD45ROCD62L effector-type (Teff) T cells within the spike-specific compartment of different paired samples as summarized in B. Liver: n = 8, paired t test; kidney: n = 8, paired t test for Tm and Wilcoxon’s test for Teff; lung: n = 7, paired t test; bone marrow: n = 10, paired t test; spleen: n = 3, paired t test. (C) Simple linear regression analysis between specific blood-derived and paired nonlymphoid organ–derived Tm cell frequencies and age. Red symbols identify vaccinated individuals with a history of SARS-CoV-2 infection that were excluded from statistics.
Figure 3
Figure 3. Tissue adaptation signatures of vaccine-specific CD4+ T cells.
(A and B) Exemplary plots (A) and summary (B) for FACS-based identification of the tissue residency/retention–associated molecules CD69, CD103, and CD49a among vaccine-specific CD4+ T cells in the indicated specimen types. Liver: n = 5, paired t test for CD69 and Wilcoxon’s test for CD103/CD49a; kidney: n = 8, Wilcoxon’s test for CD69/CD103 and paired t test for CD49a; lung: n = 7, paired t test for CD69/CD49a and Wilcoxon’s test for CD103; bone marrow: n = 10, Wilcoxon’s test for CD69/CD103 and paired t test for CD49a; spleen: n = 3, Wilcoxon’s test for CD69 and paired t test for CD103/CD49a. Red symbols identify vaccinated individuals with a history of SARS-CoV-2 infection that were excluded from statistics.
Figure 4
Figure 4. Enhanced polyfunctionality as a feature of specific organ-derived Th cells.
Cytokine expression was assessed in spike-specific Th cells intracellularly by FACS. (A) Frequencies of IFN-γ– or IL-2–positive cells among the indicated paired samples. Liver: n = 8, paired t test; kidney: n = 8, paired t test for IFN-γ and Wilcoxon’s test for IL-2; lung: n = 7, paired t test; bone marrow: n = 10, paired t test; spleen: n = 3, paired t test. (B and C) Simple linear regression analysis of frequencies of specific IFN-γ–expressing (B) or IL-2–expressing (C) Th cells from nonlymphoid tissues versus paired blood. (D and E) Mean frequencies (D) and paired analyses (E) of spike-specific polyfunctional Th cells expressing 3, 2, 1, or 0 of the cytokines IFN-γ, IL-2, and/or IL-4 at a time. Statistically significant differences were tested with paired t test (0–2 cytokines) or with Wilcoxon’s test (3 cytokines). (F and G) Differential IFN-γ or IL-2 expression in spike-specific Th cells from nonlymphoid organs after pre-gating on CD69+ or CD69 (F) and CD49a+ or CD49a (G) expressing or nonexpressing subsets. Liver: n = 8; kidney: n = 8; lung: n = 7. Statistically significant differences were tested with paired t test (IL-2) or with Wilcoxon’s test (IFN-γ). For DG, only tissue samples from nonlymphoid organs were included. Red symbols identify vaccinated individuals with a history of SARS-CoV-2 infection that were excluded from statistics.
Figure 5
Figure 5. scRNA-Seq analysis of spike-specific Th cells from organs and blood.
(A and B) Summary of specimens included (A) and workflow for transcriptome analysis of spike-specific CD4+ Th cells (B). (C) Unsupervised clustering based on transcriptomes derived from n = 1,985 cells identified 3 major populations when visualized by UMAP. (D) Heatmap showing expression patterns of selected characteristic genes for clusters 0, 1, and 2. (E) Violin plots displaying selection of genes that are differentially regulated in clusters 0 (first panel), 1 (second panel), and 2 (third panel) and those that are similarly regulated over all clusters (fourth panel).
Figure 6
Figure 6. Cell clustering is not primarily driven by tissue-specific features.
(A) UMAP plot as in Figure 5C with overlay of specimen origins. (B) Expression of selected tissue residency/retention–associated or –nonassociated genes in cells derived from distinct cluster/tissue combinations. Expression values are shown as z scores. (C) Grid representation of RNA velocities for the various tissues calculated using velocyto. Data sets were split according to tissue before velocity calculation, and cells are color-coded by cluster.
Figure 7
Figure 7. Shared TCR clonotypes between tissues.
(A) Heatmap depicting the overlap in absolute numbers of CDR3 sequences in different samples. (B) Percentage of cells with at least 1 of the 10 most frequent clonotypes per sample, colored by organ. Total cell numbers with known clonotype are indicated above the bars. Blood and liver samples from donors 1–4 were paired, whereas samples 5–12 were from different donors. (C) Association of clonotypes with gene expression. UMAP plots with cells that have a shared clonotype highlighted in red. Separate graphs for all 9 different clonotypes with at least 4 cells (inclusion criterion) are shown. (D) Impact of shared versus different metadata on the cell-cell Spearman’s correlation coefficient for highly variable genes. Mean change and 95% confidence intervals were obtained using Tukey’s honestly significant difference test, considering all individual variables as well as their interactions. (E) log2 odds ratio for clonotypes or CDR3 sequences shared between blood and liver in liver-derived cells positive versus negative for CD49a (top) or CD103 (bottom). Positivity for these markers was defined as the presence of at least 1 count of the respective molecule. Whiskers extend to the 95% confidence interval.

References

    1. Haas EJ, et al. Impact and effectiveness of mRNA BNT162b2 vaccine against SARS-CoV-2 infections and COVID-19 cases, hospitalisations, and deaths following a nationwide vaccination campaign in Israel: an observational study using national surveillance data. Lancet. 2021;397(10287):1819–1829. doi: 10.1016/S0140-6736(21)00947-8. - DOI - PMC - PubMed
    1. Polack FP, et al. Safety and efficacy of the BNT162b2 mRNA Covid-19 vaccine. N Engl J Med. 2020;383(27):2603–2615. doi: 10.1056/NEJMoa2034577. - DOI - PMC - PubMed
    1. Sahin U, et al. COVID-19 vaccine BNT162b1 elicits human antibody and TH1 T cell responses. Nature. 2020;586(7830):594–599. doi: 10.1038/s41586-020-2814-7. - DOI - PubMed
    1. Sattler A, et al. Impaired humoral and cellular immunity after SARS-CoV-2 BNT162b2 (tozinameran) prime-boost vaccination in kidney transplant recipients. J Clin Invest. 2021;131(14):e150175. doi: 10.1172/JCI150175. - DOI - PMC - PubMed
    1. Choi WS, Cheong HJ. COVID-19 vaccination for people with comorbidities. Infect Chemother. 2021;53(1):155–158. doi: 10.3947/ic.2021.0302. - DOI - PMC - PubMed

Publication types