. 2023 Oct 9;41(10):1788-1802.e10.
doi: 10.1016/j.ccell.2023.09.003.

Systematic investigation of mitochondrial transfer between cancer cells and T cells at single-cell resolution

Affiliations

Systematic investigation of mitochondrial transfer between cancer cells and T cells at single-cell resolution

Hongyi Zhang et al. Cancer Cell. .

Abstract

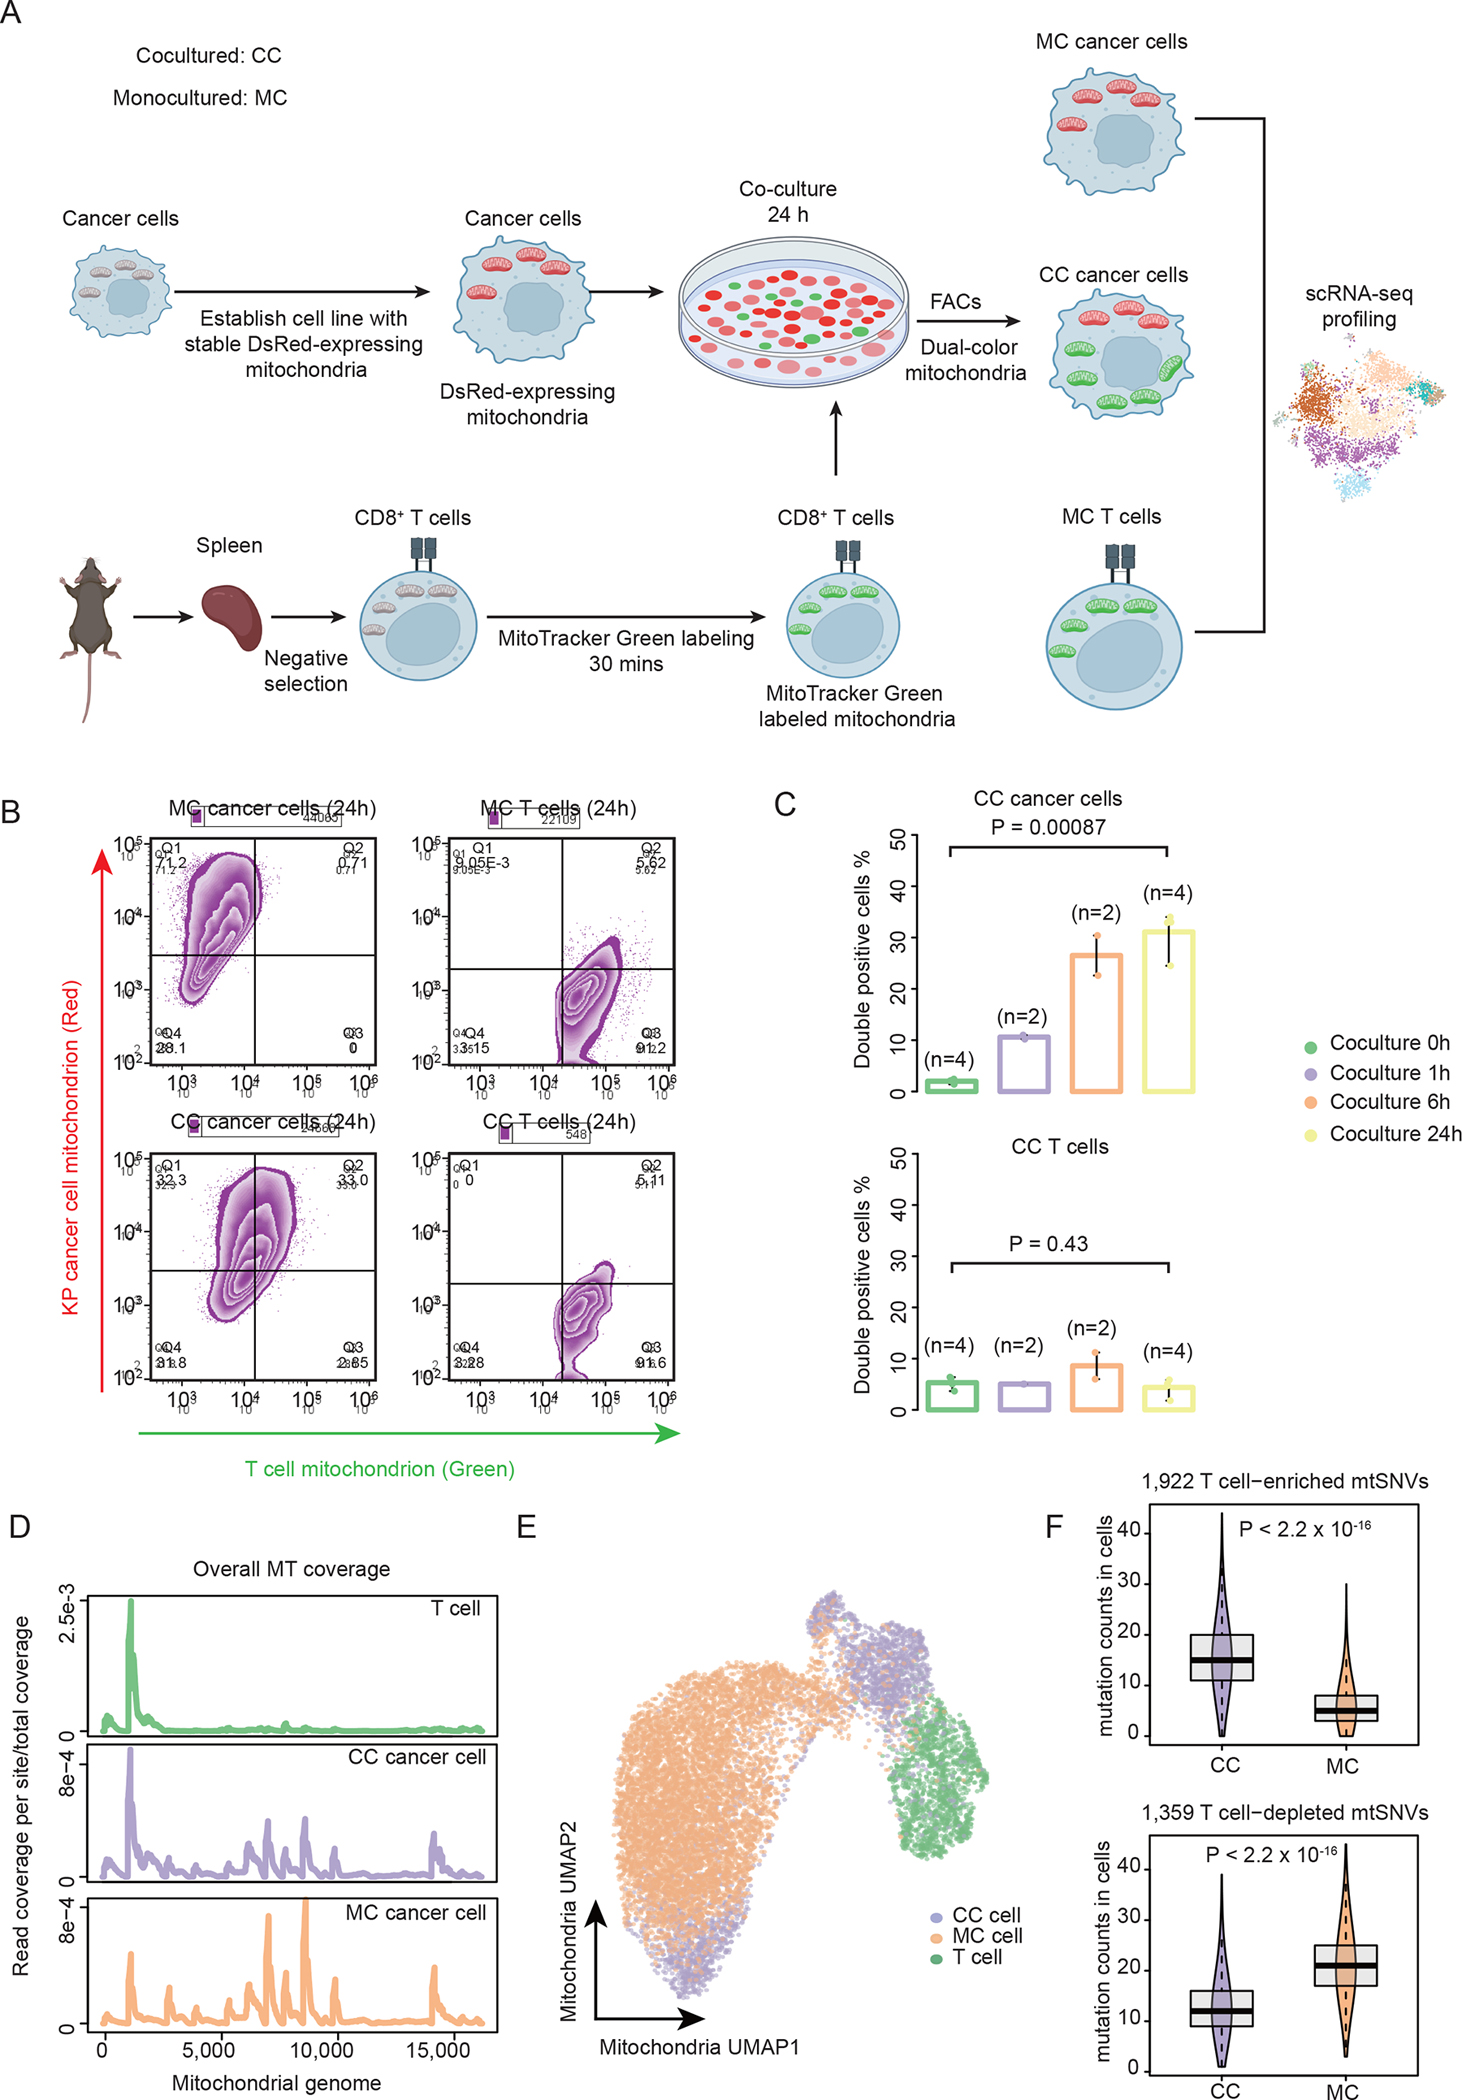
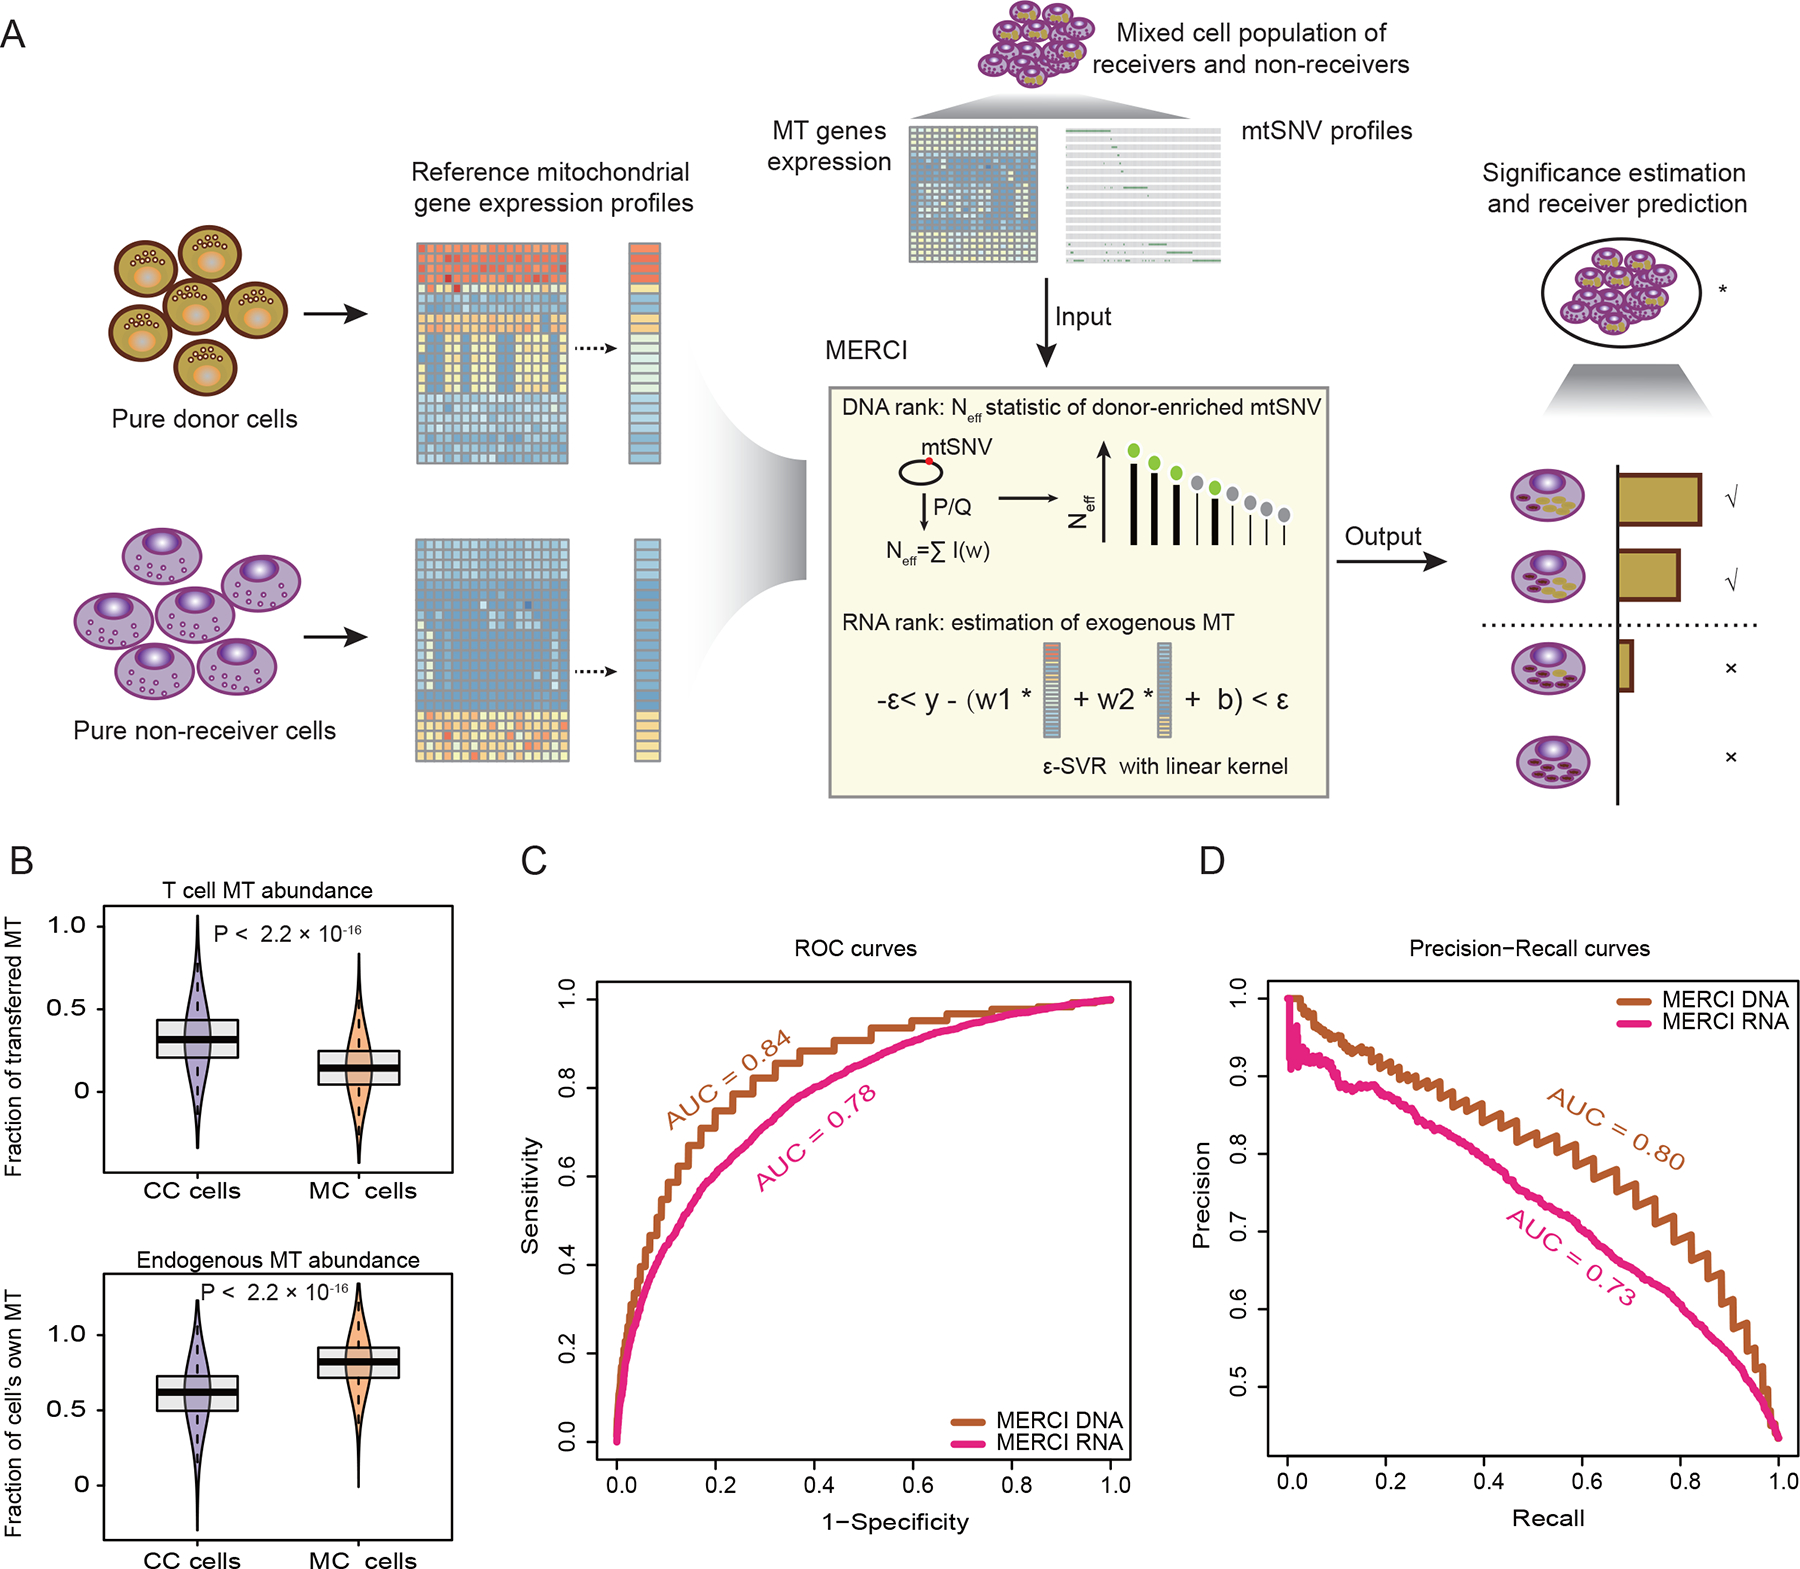
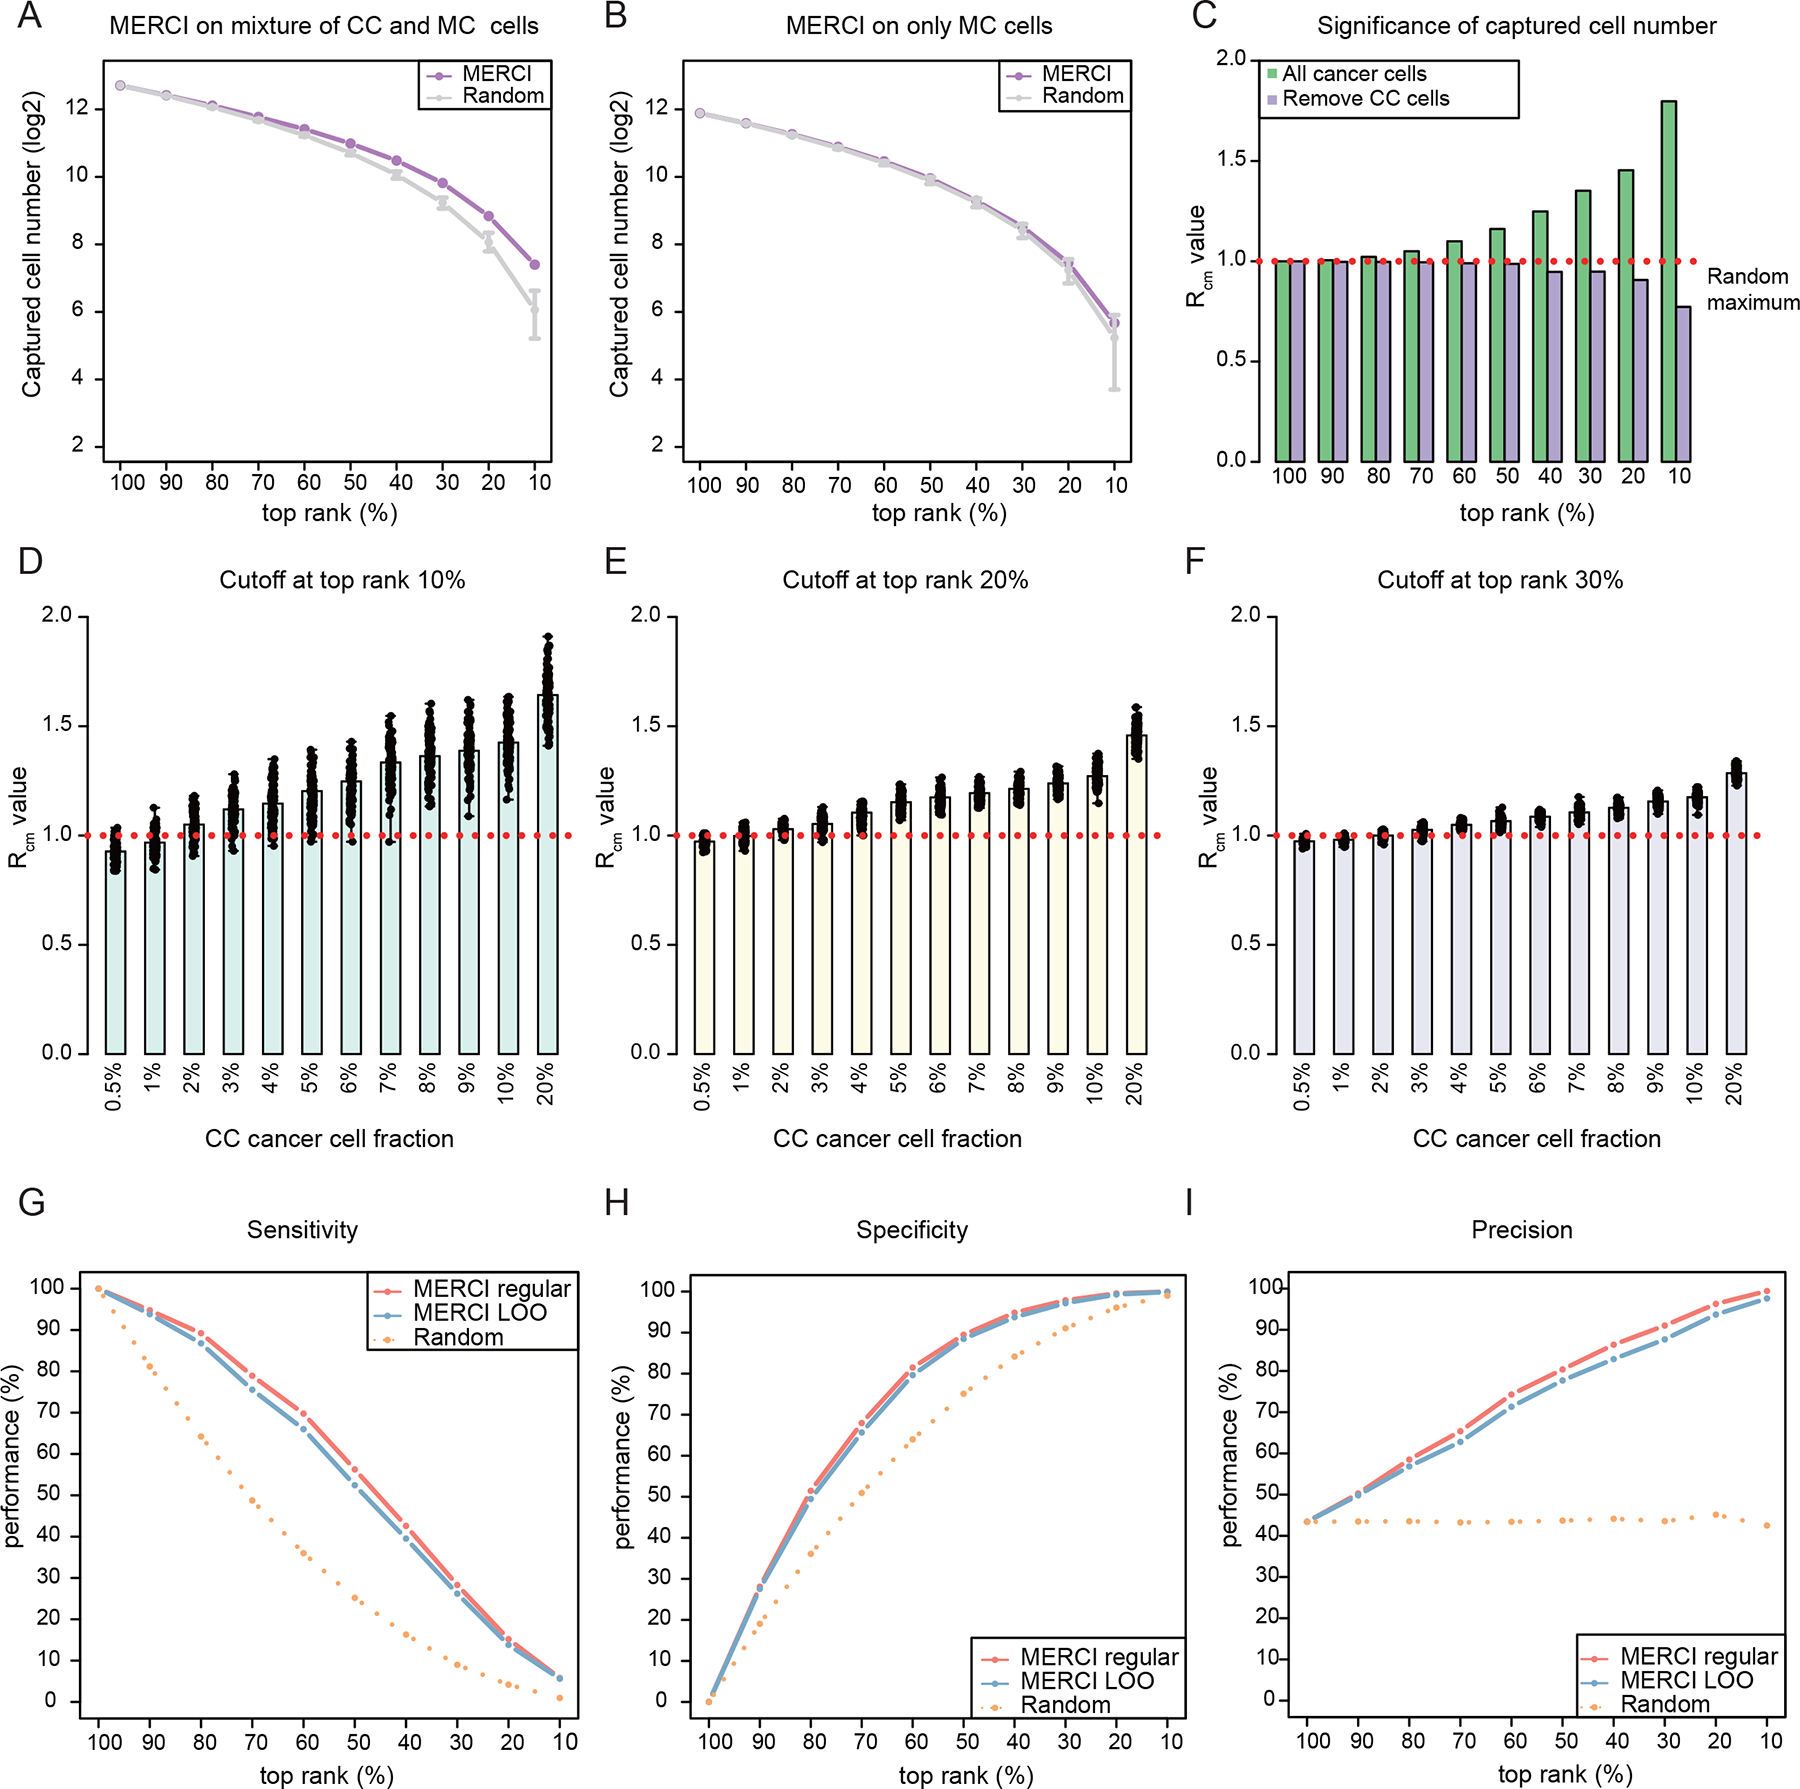
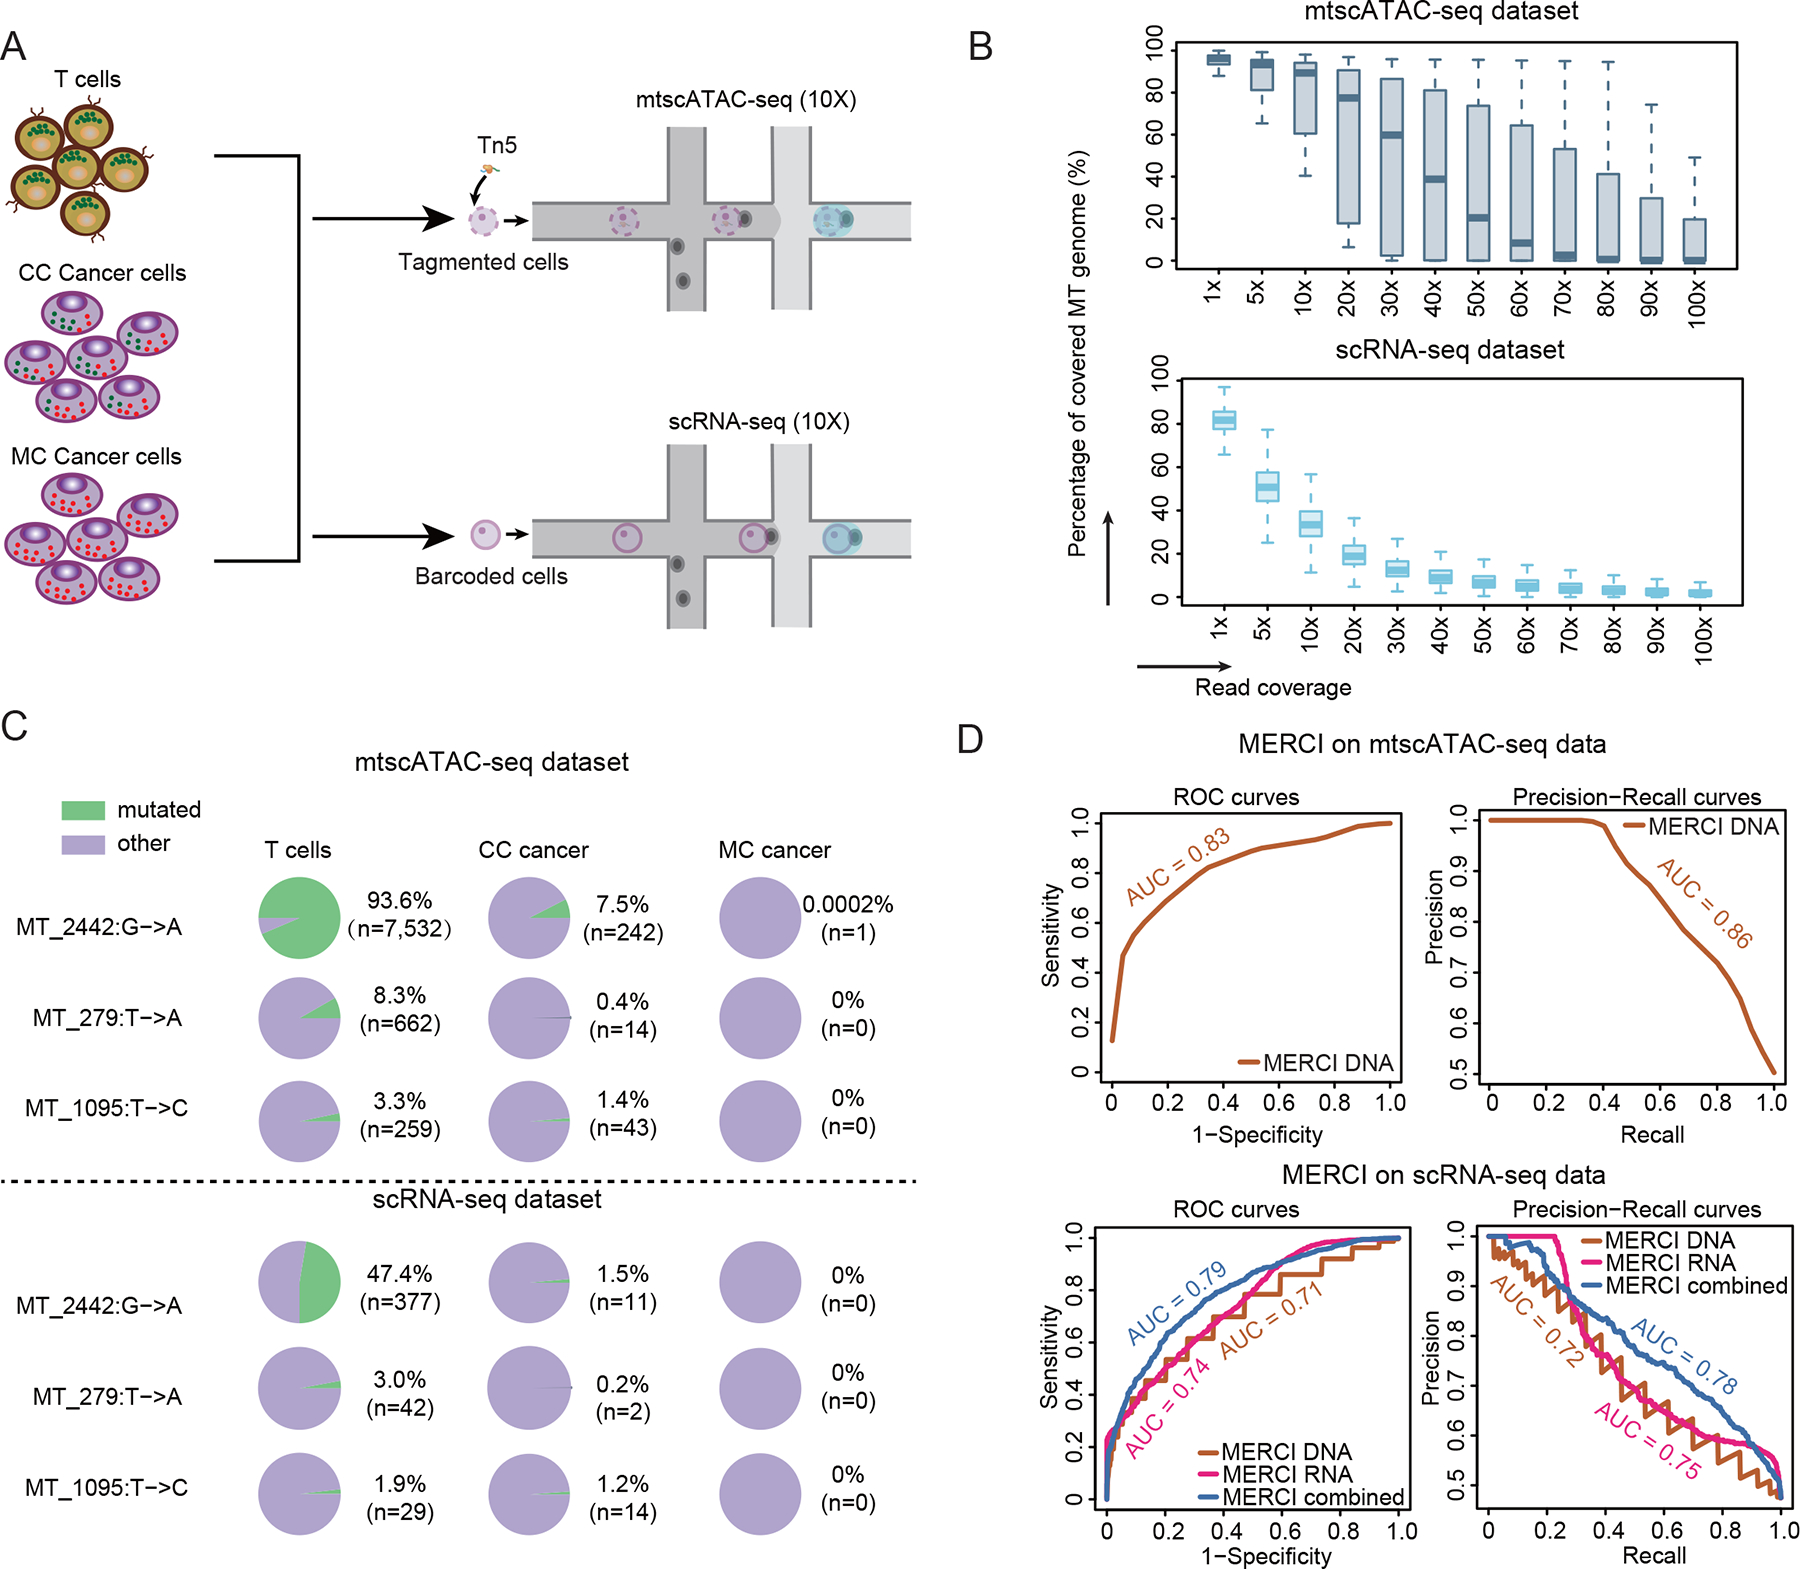
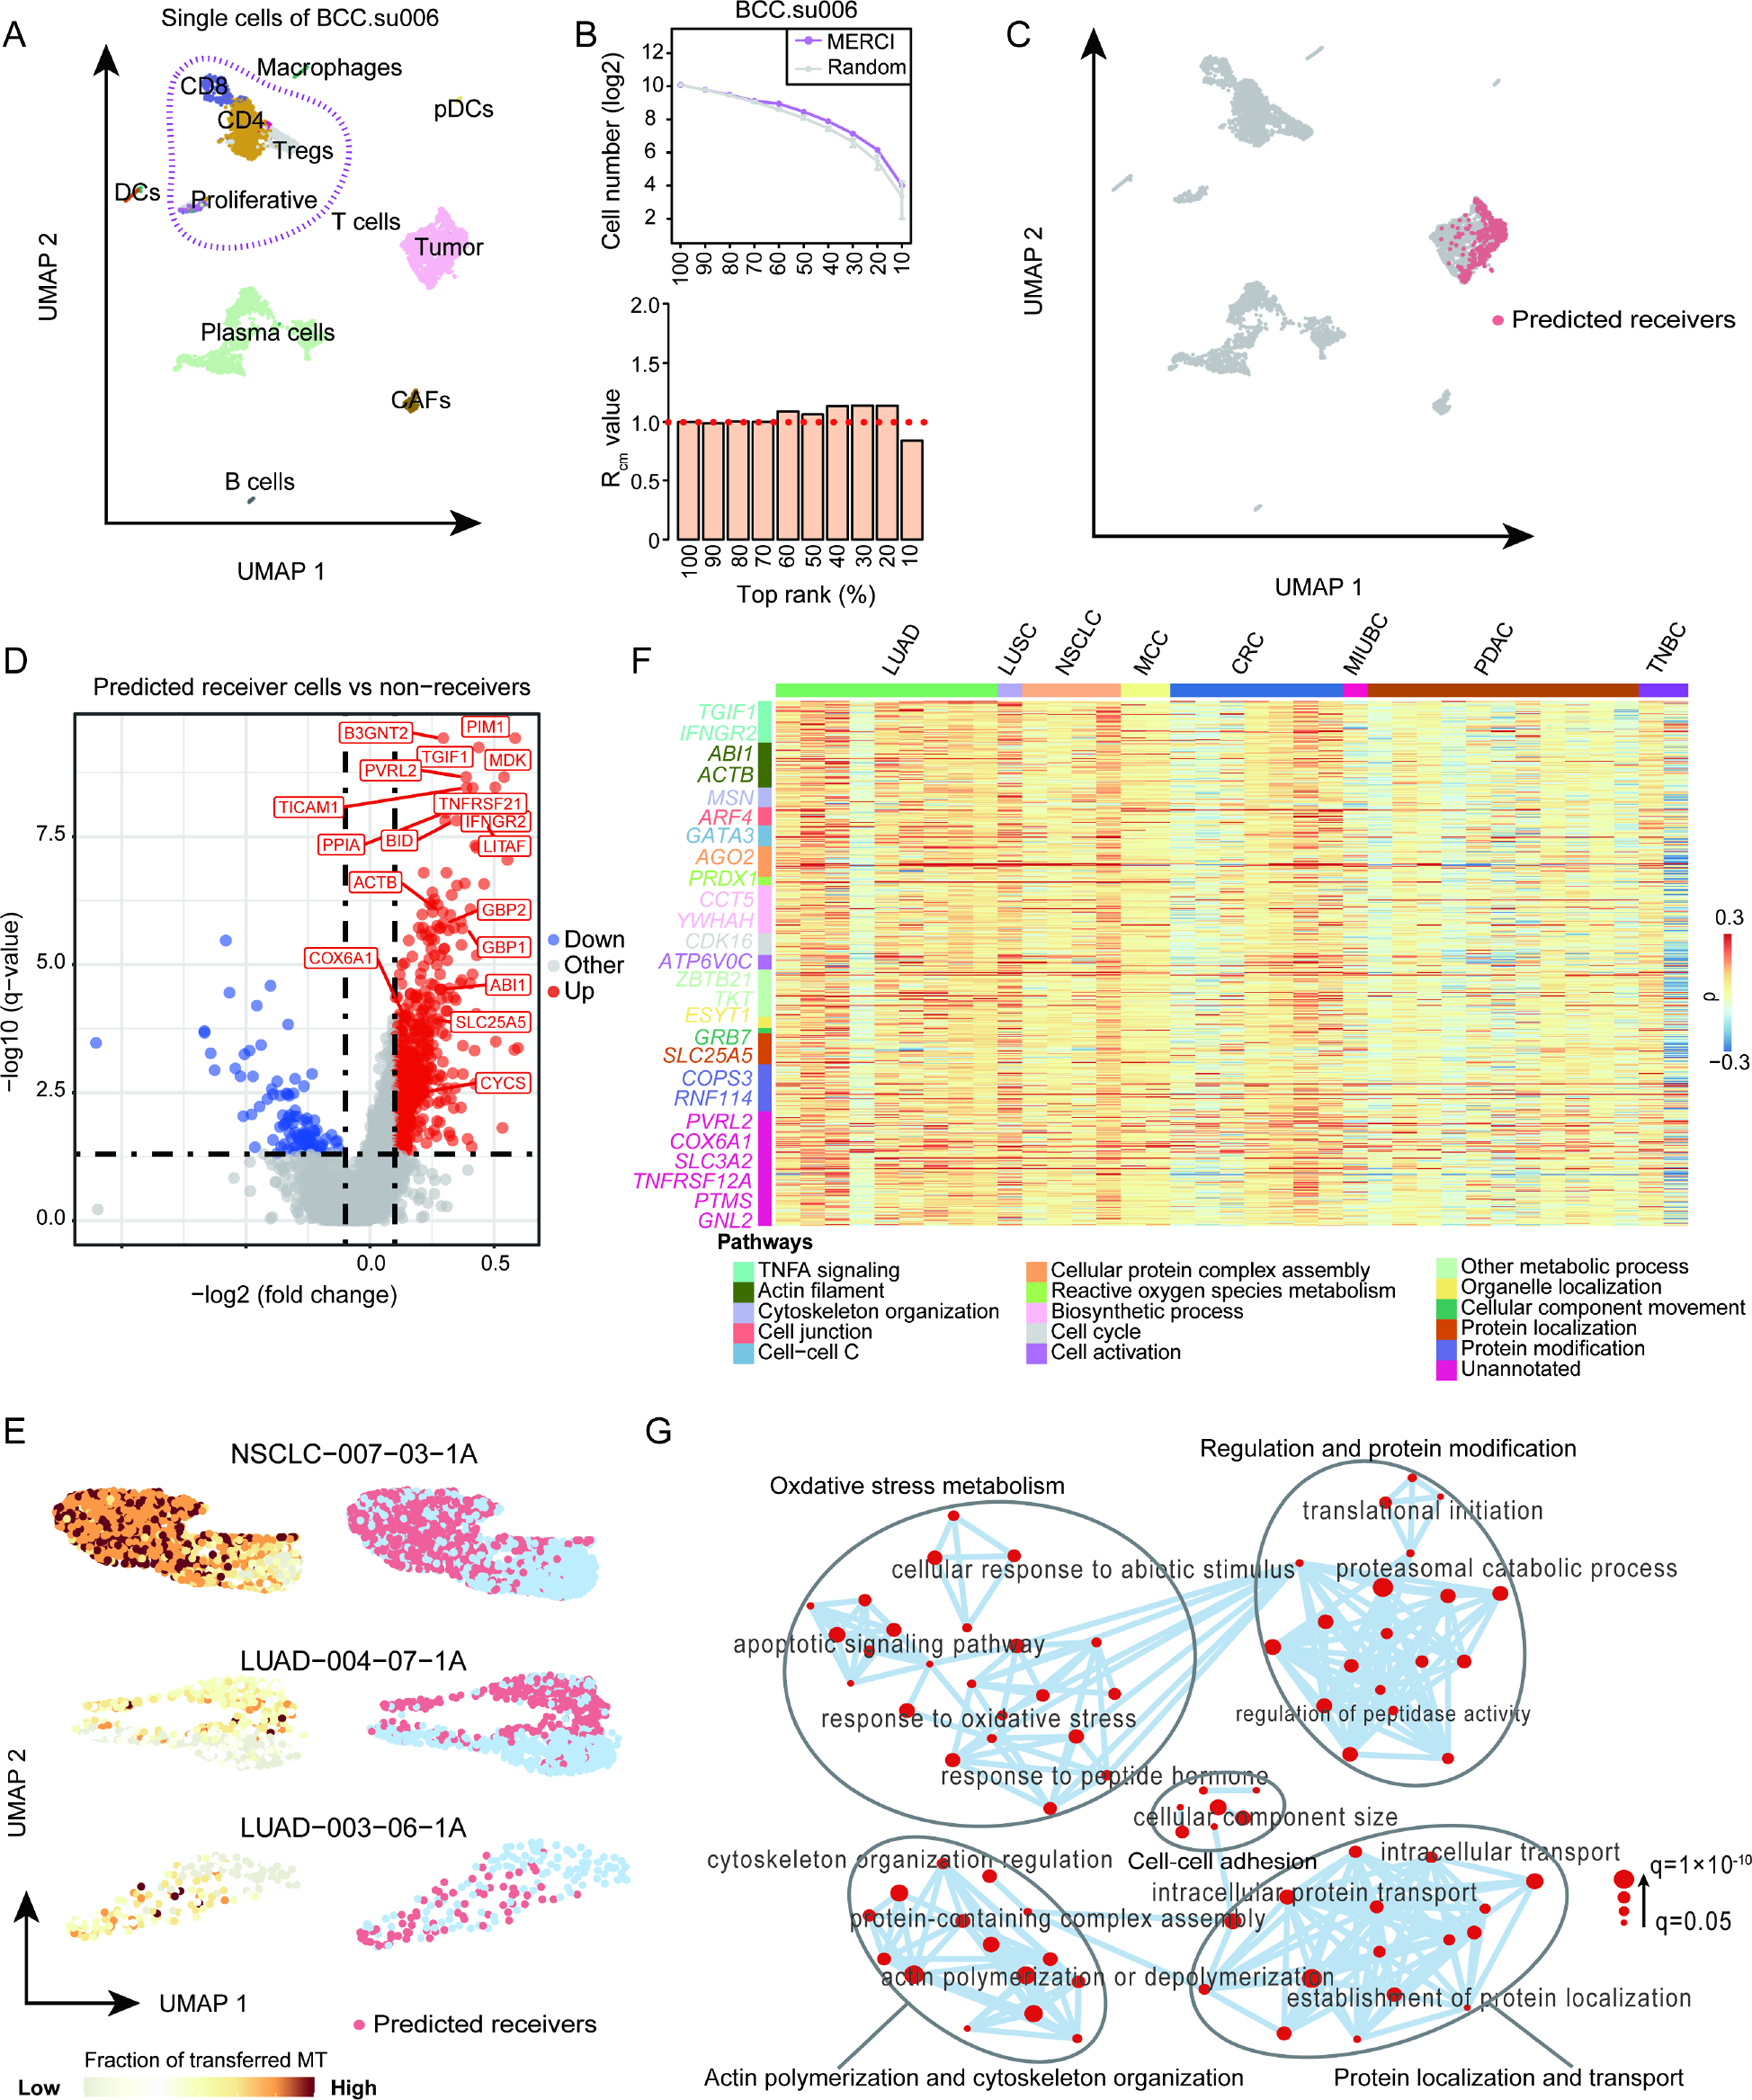
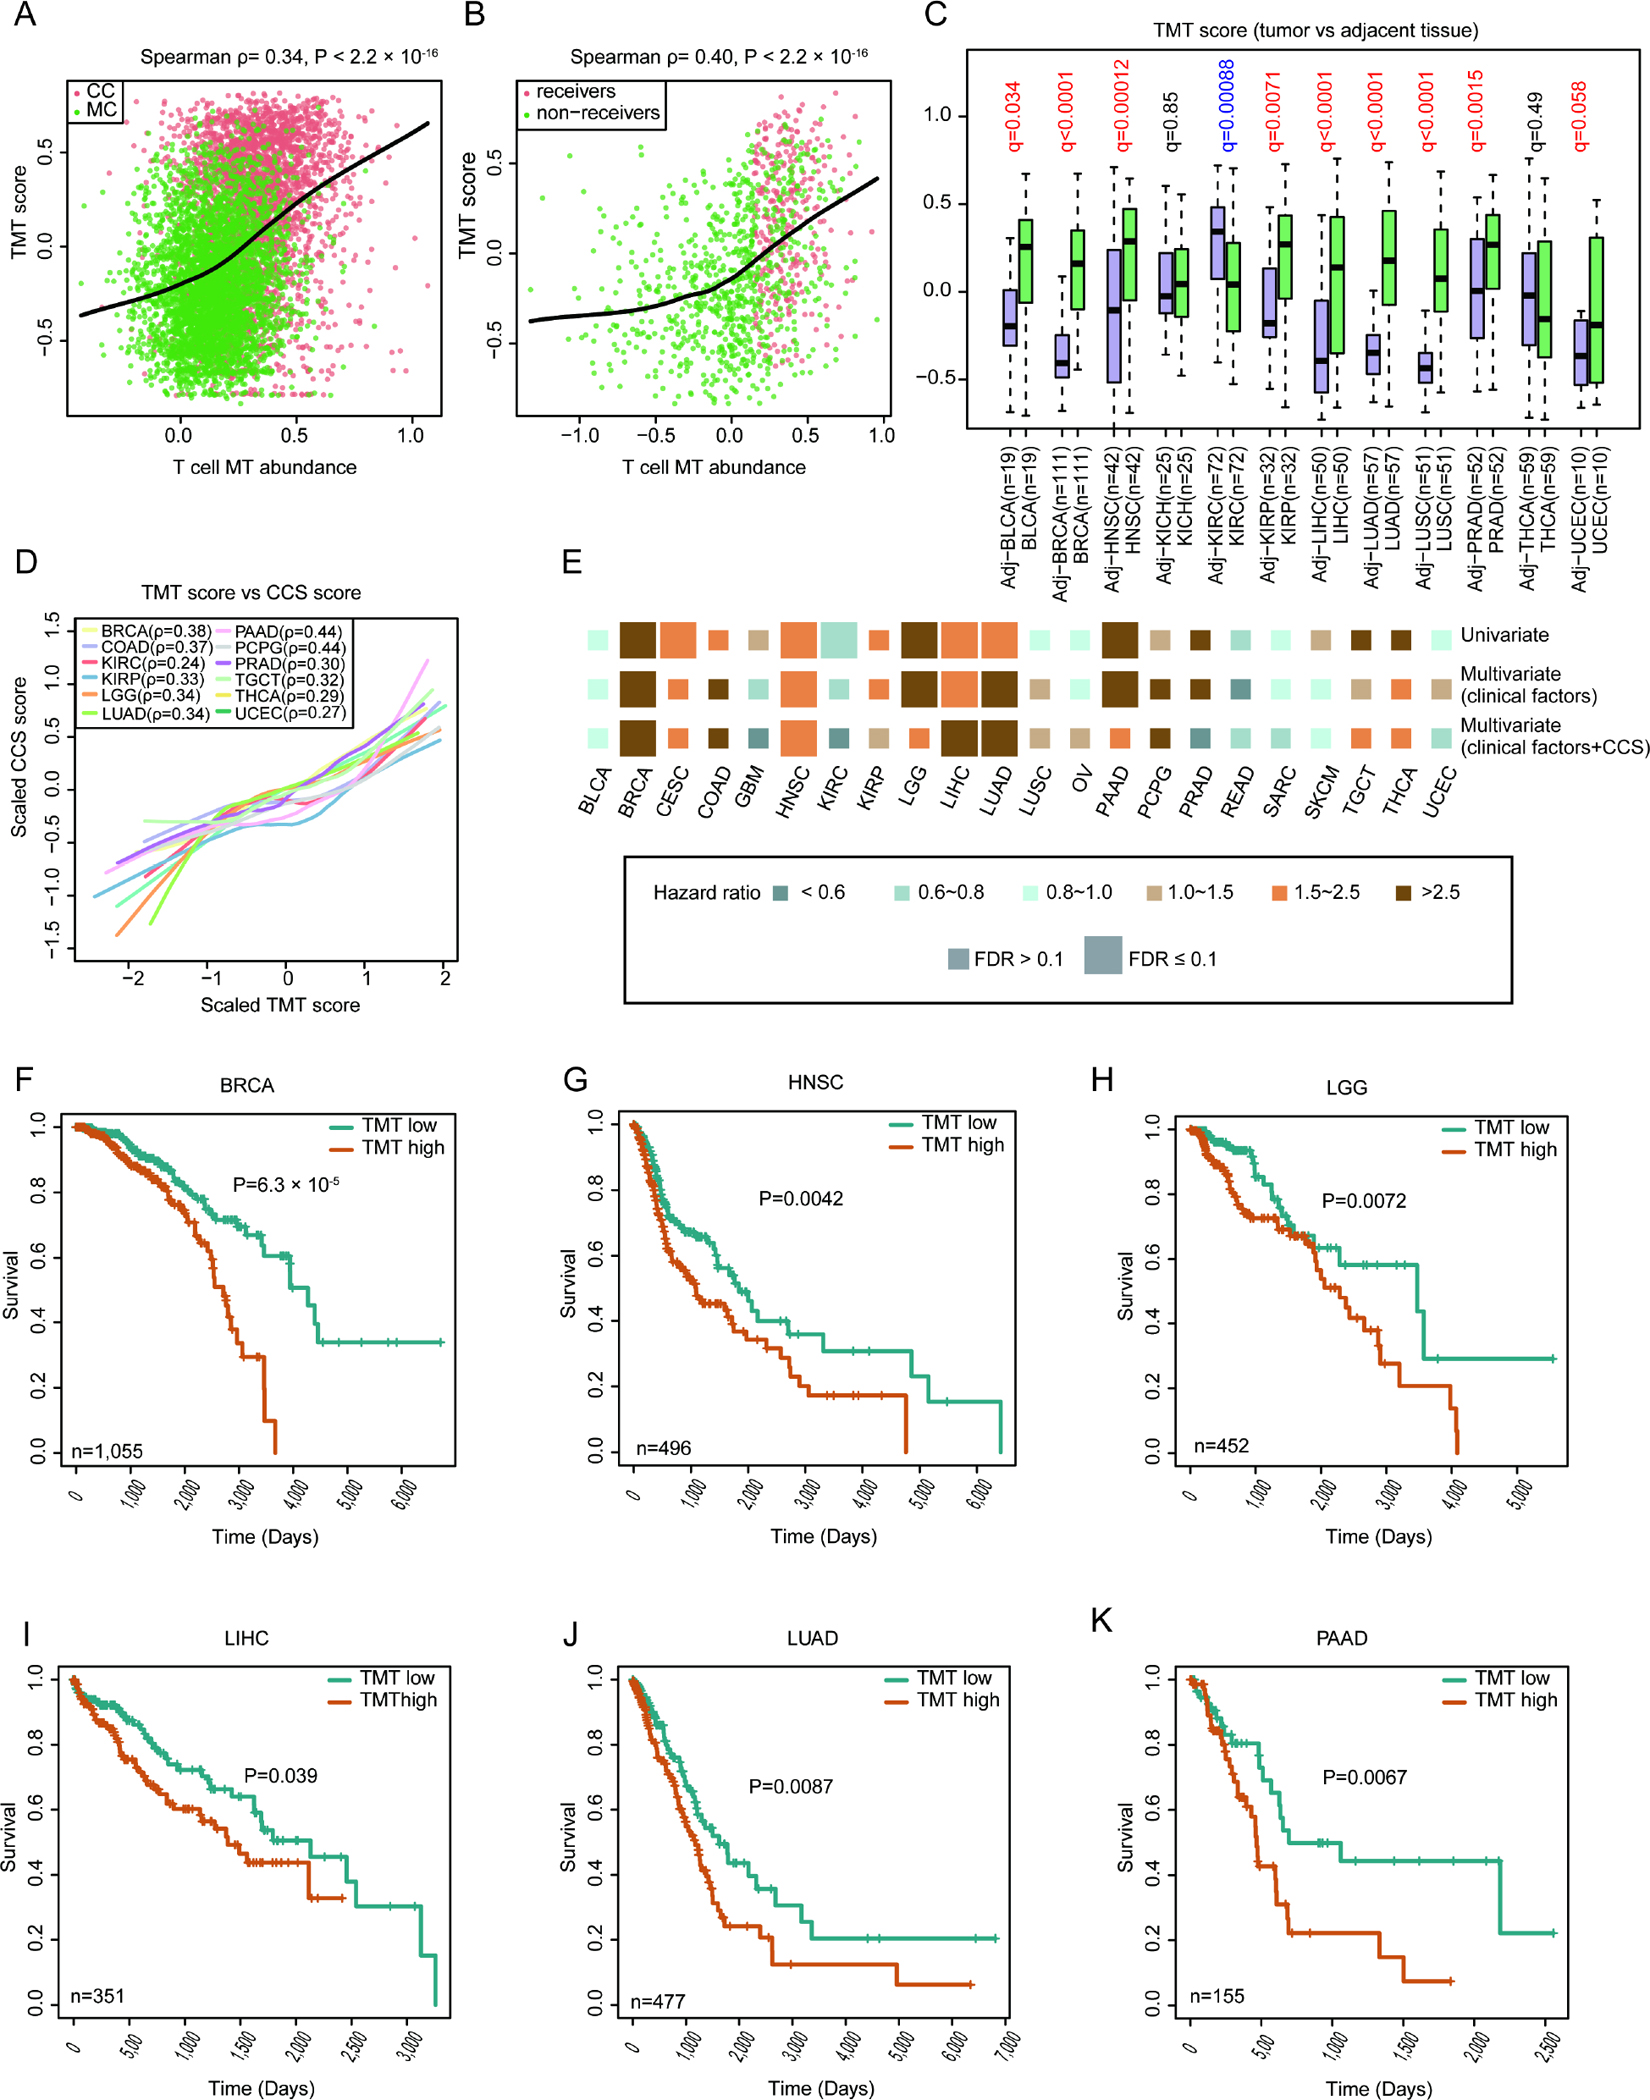
Mitochondria (MT) participate in most metabolic activities of mammalian cells. A near-unidirectional mitochondrial transfer from T cells to cancer cells was recently observed to "metabolically empower" cancer cells while "depleting immune cells," providing new insights into tumor-T cell interaction and immune evasion. Here, we leverage single-cell RNA-seq technology and introduce MERCI, a statistical deconvolution method for tracing and quantifying mitochondrial trafficking between cancer and T cells. Through rigorous benchmarking and validation, MERCI accurately predicts the recipient cells and their relative mitochondrial compositions. Application of MERCI to human cancer samples identifies a reproducible MT transfer phenotype, with its signature genes involved in cytoskeleton remodeling, energy production, and TNF-α signaling pathways. Moreover, MT transfer is associated with increased cell cycle activity and poor clinical outcome across different cancer types. In summary, MERCI enables systematic investigation of an understudied aspect of tumor-T cell interactions that may lead to the development of therapeutic opportunities.

Keywords: Mitochondrial Transfer; Statistical Deconvolution; T cell dysfunction; Tumor-Immune Interaction; mtDNA sequencing.; single cell genomics.


Conflict of interest statement

Declaration of interests The authors declare no competing interests.

Figures

Figure 1.
Figure 1.. MT transfer signal captured by scRNA-seq data.
(A) Cartoon illustrating the process of generating the ground-truth data by coculturing KP cancer cells and CD8+ T cells, followed by single cell RNA-seq library construction and next generation sequencing. (B) The contour plots showing the percentage of double positive cells (left: KP cancer cells, right: T cells) after 24 hours of coculturing (lower) and monoculturing (upper). Double positive cells are those carrying both endogenous and donor cell-derived mitochondria. (C) Bar plots showing the percentage of double positive cells for the KP cancer cells (upper) and the T cells (lower) at different coculture time points. Statistical significance was evaluated using two-sided Student t test. Error bars indicate the range (min to max) of the data. (D) The distribution of per site read coverage in mitochondrial genome for CC, MC and T cells. Read depth is normalized by the total reads mapped to the mtDNA region. (E) UMAP plot showing mitochondrial transcriptional profiles of cells. Cells are colored by different experimental groups. (F) Boxplots showing the counts of T cell enriched (upper) and T cell depleted (lower) mtSNVs in CC and MC cancer cells with the MT read-depth range 1000–2000. Lower and upper box hinges represent 25th to 75th percentiles, central line the median and the whisker extend to highest and smallest values no greater than 1.5× interquartile range; the violin component refers to the kernel probability density and encompasses all cells. Two-sided Wilcoxon rank sum test was applied to calculate the P values. See also Figures S1–S2.
Figure 2.
Figure 2.. Overview of MERCI and application to the ground-truth data.
(A) Schematic illustration of MERCI. Single cell RNA-seq data from reference donor and non-receiver cells were used to deconvolute MT fractions in the cancer cell population. By combining ranks from DNA and RNA information, MERCI estimates the statistical significance of the existence of true MT receivers, and evaluates each candidate cancer cell as a receiver or not. (B) Boxplots showing the estimated abundance (SVR coefficients) of T cell transferred (upper) and endogenous mitochondria (lower) in CC and MC cancer cells. Lower and upper box limits represent 25th to 75th percentiles, central line the median and the whiskers extend to highest and lowest values no greater than 1.5× interquartile range; the violin component refers to the kernel probability density and encompasses all cells. Statistical significance was evaluated using two-sided Wilcoxon rank sum test. (C-D) Receiver operating characteristic (ROC) (C) and precision-recall (PR) (D) curves using MERCI-derived rank scores as predictors of mitochondrial receivers, i.e. CC cells. Area under the ROC and PR curves (AUC) were labeled. See also Figure S3.
Figure 3.
Figure 3.. Benchmarking of MERCI for real-world application.
(A-B) Dot-line plots showing the number of positive calls captured by using AND gate to MERCI DNA and RNA rank scores across a range of cutoffs. Purple dots represent the results of in silico mixture sample and gray intervals indicate the ranges established by 10,000 randomly permutated ranks. Error bars indicate the range (min to max) of the data. (C) Barplots showing the Rcm values at different rank cutoffs. Red dotted line indicates Rcm=1. (D-F) Significance estimation of positive calls when different fractions of true receivers are included. Barplots showing the averaged Rcm values reported by MERCI for down-sampled datasets at rank cutoffs at top 10% (D), 20% (E) and 30% (F) respectively. Black dots indicate the Rcm values of down-sampled datasets. (G-I) The sensitivity, specificity and precision of MERCI when using different rank cutoffs to predict the MT receivers. See also Figure S3.
Figure 4.
Figure 4.. Independent validation using mtscATAC-seq technique.
(A) Diagram showing the process of generating mtscATAC-seq and matched scRNA-seq datasets. (B) Boxplots showing the distribution of read coverage per cell in the mtscATAC-seq dataset (upper) and the matched scRNA-seq dataset (lower). Box center line: median; box limits: upper and lower quantiles; box whiskers: 1.5×interquartile range (IQR). (C) The cell frequencies of three T cell-specific variants in T cells, CC and MC cancer cell populations. Label of the variant marks the 0-index coordinate, followed by the nucleotide change. (D) Receiver operating characteristic (ROC) and precision-recall (PR) curves using MERCI-derived rank scores as predictors of mitochondrial receivers. As it is not feasible to estimate the RNA rank scores from mtscATAC-seq dataset, the upper panel only shows the performance DNA rank scores. See also Figure S3 and Tables S1–S2.
Figure 5.
Figure 5.. Distinct MT receiver phenotype predicted by MERCI in human tumor samples.
(A) UMAP plot showing the cell clusters and distribution of single cells from BCC patient ‘su006’. (B) Significance estimation of the number of positive calls reported by MERCI for scRNA-seq data of BCC patient ‘su006’. (C) UMAP plots showing the projection of MERCI predicted receiver cells. (D) Volcano plot showing DEGs of the predicted receiver cells versus non-receivers, with fold change calculated using the mean values of the two groups. Statistical significance was evaluated using two-sided Wilcoxon rank sum test, with FDR corrected using Benjamini-Hochberg procedure. (E) UMAP plots illustrating the estimated fraction of transferred MT in cancer cells (left) and the distribution of predicted receivers (right) for three selected cancer patients. These patients were chosen based on the highest Pearson correlations between the fraction of transferred mitochondria (Fr.T-Mito) and the gene expression phenotype measured with UMAP (either umap1 or umap2). (F) Heatmap showing the Spearman correlation coefficients between the expression of 608 DEGs identified in BCC dataset and the Fr.T-Mito in cancer cells across 37 samples of different cancer types. LUAD: lung adenocarcinoma, LUSC: lung squamous cell carcinoma, NSCLC: non-small cell lung cancer, MCC: merkel cell carcinoma, CRC: colorectal cancer, MIUBC: muscle-invasive urothelial bladder cancer, PDAC: pancreatic ductal adenocarcinoma, TNBC: triple negative breast cancer. The selected representative genes of different pathways were marked with different colors. (G) Gene ontology network based on the commonly enriched GO terms of the 95 MT transfer-related genes. Each node represents a gene ontology. Node size corresponds to gene ratio of each GO term vs total analyzed genes in human BCC sample. See also Figures S4–S5 and Tables S3–S5.
Figure 6.
Figure 6.. Functional and clinical impact of TMT score across different cancer types.
(A-B) TMT scores of cancer cells showing high correlation with the estimated foreign mitochondrial abundance for both murine training (A) and human BCC (B) data. The Spearman correlation test was used to calculate the P values. (C) The TMT scores of primary tumor and adjacent (Adj) samples in 12 cancer types. BLCA: bladder urothelial carcinoma, BRCA: breast invasive carcinoma, HNSC: head and neck cancer, KICH: kidney chromophobe, KIRC: kidney renal clear cell carcinoma, KIRP: kidney renal papillary cell carcinoma, LIHC: liver hepatocellular carcinoma, PRAD: prostate adenocarcinoma, THCA: thyroid carcinoma, UCEC: uterine corpus endometrial carcinoma. Statistical significance was estimated using non-parametric paired Wilcoxon signed-rank test, with FDR adjusted using Benjamini-Hochberg procedure. Box center line: median; box limits: upper and lower quantiles; box whiskers: 1.5×IQR. (D) Lowess smooth curves showing positive correlations between TMT scores and CCS in selected cancer types. (E) Association of TMT score with patient overall survival based on both univariate and multivariate Cox proportional hazards models in different cancer types. CESC: cervical squamous cell carcinoma and endocervical adenocarcinoma, COAD: colon adenocarcinoma, GBM: glioblastoma multiforme, LGG: lower-grade glioma, OV: ovarian serous cystadenocarcinoma, PAAD: pancreatic adenocarcinoma, PCPG: pheochromocytoma and paraganglioma, READ: rectum adenocarcinoma, SARC: sarcoma, SKCM: skin cutaneous melanoma, TGCT: testicular germ cell tumors. We applied two multivariate Cox models: one with just well-known clinical confounders as covariates and the other with clinical confounders plus CCS as a covariate. Size denotes statistical significance at the cutoff of FDR=0.1; color denotes the hazard ratio. (F-K) Kaplan-Meier estimates of overall survival, according to TMT score calculated from RNA-seq data of BRCA (F), HNSC (G), LGG) (H), LIHC (I), LUAD (J) and PAAD (K). The patients were stratified into two groups (TMT high and low) based on median value of TMT scores. Statistical significance was evaluated using log-rank test. See also Figure S6 and Table S6.

References

    1. Andreyev AY, Kushnareva YE, and Starkov AA (2005). Mitochondrial metabolism of reactive oxygen species. Biochemistry (Mosc) 70, 200–214. 10.1007/s10541-005-0102-7. - DOI - PubMed
    1. Rizzuto R, De Stefani D, Raffaello A, and Mammucari C (2012). Mitochondria as sensors and regulators of calcium signalling. Nat Rev Mol Cell Biol 13, 566–578. 10.1038/nrm3412. - DOI - PubMed
    1. Wang C, and Youle RJ (2009). The role of mitochondria in apoptosis*. Annu Rev Genet 43, 95–118. 10.1146/annurev-genet-102108-134850. - DOI - PMC - PubMed
    1. Kang E, Wang X, Tippner-Hedges R, Ma H, Folmes CD, Gutierrez NM, Lee Y, Van Dyken C, Ahmed R, Li Y, et al. (2016). Age-Related Accumulation of Somatic Mitochondrial DNA Mutations in Adult-Derived Human iPSCs. Cell Stem Cell 18, 625–636. 10.1016/j.stem.2016.02.005. - DOI - PubMed
    1. Sigurgardottir S, Helgason A, Gulcher JR, Stefansson K, and Donnelly P (2000). The mutation rate in the human mtDNA control region. Am J Hum Genet 66, 1599–1609. 10.1086/302902. - DOI - PMC - PubMed

Publication types

Substances