. 2023 Oct 17;4(10):101226.
doi: 10.1016/j.xcrm.2023.101226. Epub 2023 Oct 9.

MesoGraph: Automatic profiling of mesothelioma subtypes from histological images

Affiliations

MesoGraph: Automatic profiling of mesothelioma subtypes from histological images

Mark Eastwood et al. Cell Rep Med. .

Abstract

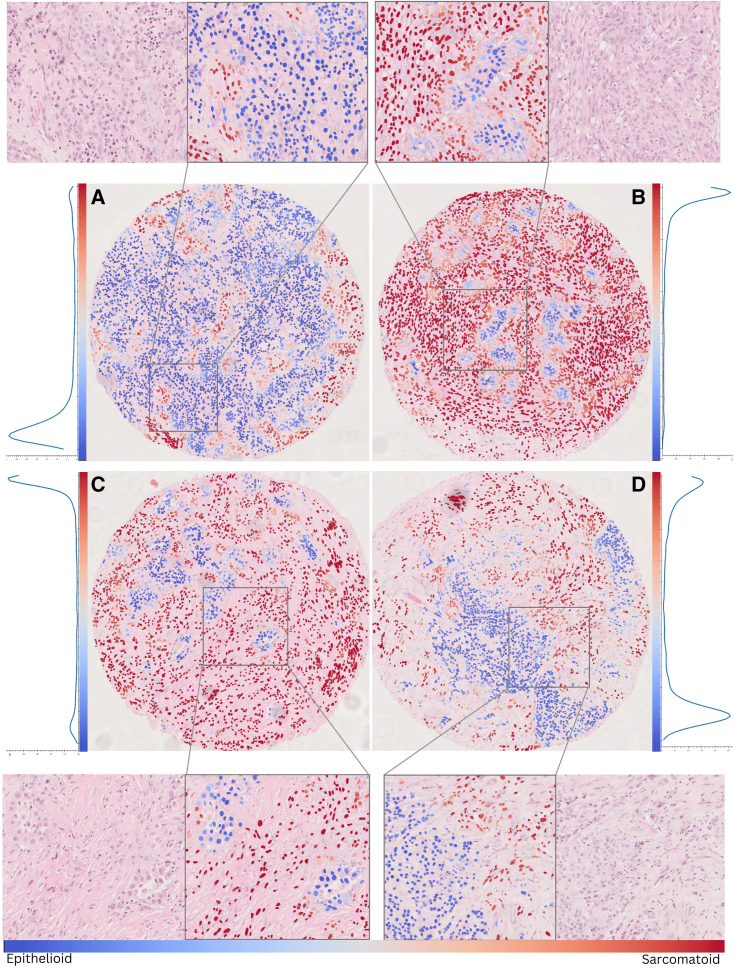
Mesothelioma is classified into three histological subtypes, epithelioid, sarcomatoid, and biphasic, according to the relative proportions of epithelioid and sarcomatoid tumor cells present. Current guidelines recommend that the sarcomatoid component of each mesothelioma is quantified, as a higher percentage of sarcomatoid pattern in biphasic mesothelioma shows poorer prognosis. In this work, we develop a dual-task graph neural network (GNN) architecture with ranking loss to learn a model capable of scoring regions of tissue down to cellular resolution. This allows quantitative profiling of a tumor sample according to the aggregate sarcomatoid association score. Tissue is represented by a cell graph with both cell-level morphological and regional features. We use an external multicentric test set from Mesobank, on which we demonstrate the predictive performance of our model. We additionally validate our model predictions through an analysis of the typical morphological features of cells according to their predicted score.

Keywords: cancer subtyping; digital pathology; graph neural networks; mesothelioma; multiple instance learning.


Conflict of interest statement

Declaration of interests The authors declare no competing interests.

Figures

None
Graphical abstract
Figure 1
Figure 1
Overview of the study, model, and experimental design (A) Data and experimental design. TMA slides were de-arrayed into individual images, and images of cores that were dropped or particularly badly damaged were excluded. The model is trained on the St. George’s cohort and validated both internally and on the external Mesobank cohort. (B and C) Steps to represent a TMA core as a graph, from cell detection, through extraction of morphological and local neighborhood features, to the construction of the cell graphs upon which our model will be trained. In (C) is the proposed MesoGraph GNN architecture. Deeper layers incorporate information from larger neighborhoods. By concatenating layer representations, we allow the model to use information at multiple scales.
Figure 2
Figure 2
Examples of model visualization on a selection of TMA cores Each core is shown together with a zoomed-in view showing the differences in morphology between regions and a plot showing the distribution of node scores in that core. (A and B) Epithelioid core. (A) We see a predominantly low-scoring core with only a few small regions displaying slightly more sarcomatoid features. Conversely, in (B), a sarcomatoid core, nodes are predominantly high scoring. (C and D) Biphasic cores. In each core, we see a bimodal distribution of scores, particularly pronounced in core (D). The zoomed-in regions show a distinct difference in morphology between high- and low-scoring regions, with rounder cells seen in lower-scoring regions and a more elongated morphology and less structured cell organization in higher-scoring regions.
Figure 3
Figure 3
Overview of model predictions by subtype Images of model predictions ordered within each subtype by the predicted predominance of the sarcomatoid component, illustrating the underlying continuous biological expression of tissue on the epithelioid to sarcomatoid spectrum.
Figure 4
Figure 4
Illustration of the top 10 features identified by GNNExplainer (A–D) considering all cores (A), and in (B)–(D), importances on cores grouped by subtype. Results shown as a standard box and whisker plot, with the box showing the 25th, 50th, and 75th percentile of a features importance scores over cores. Whiskers show min and max values, limited at box ± 1.5× inter-quartile range. The top feature is circularity, a known differentiating characteristic between mesothelial subtypes, providing validation for our model.
Figure 5
Figure 5
Illustrations of morphological differences between predicted subtypes Top: examples of cells scored most and least highly by the model, plotted as a 2D UMAP reduction of principal components calculated on both high- and low-scoring cells. For each cluster, the mean of the cells is displayed, together with individual example cells. Clusters A–E, on the left, are predicted to be sarcomatoid and demonstrate a more spindle-like morphology, grouped together in size and relative spindle cell characteristics in each cluster as shown by example cells on the right. Similarly, the non-sarcomatoid predicted cells also show clustering into 5 groups, F–J. Bottom: morphological heterogeneity of mesothelioma tumors independent of model prediction. (A) Distribution of average morphology across tumor types. All measurements are normalized to the data average and standard deviation. (B) Heterogeneity of cell morphology across different mesothelioma tumor types based on standard deviation (SD) of Z scored single-cell data. (C and D) Morphological heterogeneity based on ground-truth labels (C) and predicted labels (D).
Figure 6
Figure 6
Survival prediction using MesoScore (A) Kaplan-Meier curves for all data. For data right censored at 3 years (see Figure S1). (B) Cumulative events and total number at risk at each of the times shown on the x axis (C) Log hazard ratio of high MesoScore compared to demographic factors.

References

    1. Wagner J.C., Sleggs C.A., Marchand P. Diffuse pleural mesothelioma and asbestos exposure in the North Western Cape Province. Br. J. Ind. Med. 1960;17:260–271. - PMC - PubMed
    1. Hjerpe A D.K., Abd-Own S. Cytopathologic diagnosis of epithelioid and mixed-type malignant mesothelioma: Ten years of clinical experience in relation to international guidelines. Arch. Pathol. Lab Med. 2018;142:893–901. doi: 10.5858/arpa.2018-0020-RA. - DOI - PubMed
    1. Cancer Research UK Mesothelioma statistics. https://www.cancerresearchuk.org/health-professional/cancer-statistics/s...
    1. Ai J., Stevenson J.P. Current issues in malignant pleural mesothelioma evaluation and management. Oncol. 2014;19:975–984. doi: 10.1634/theoncologist.2014-0122. - DOI - PMC - PubMed
    1. Meyerhoff R.R., Yang C.-F.J., Speicher P.J., Gulack B.C., Hartwig M.G., D’amico T.A., Harpole D.H., Berry M.F. Impact of mesothelioma histologic subtype on outcomes in the surveillance, epidemiology, and end results database. J. Surg. Res. 2015;196:23–32. - PMC - PubMed

Publication types