

Using 18F-AV-133 VMAT2 PET Imaging to Monitor Progressive Nigrostriatal Degeneration in Parkinson Disease
- PMID: 37816639
- PMCID: PMC10727223
- DOI: 10.1212/WNL.0000000000207748
Using 18F-AV-133 VMAT2 PET Imaging to Monitor Progressive Nigrostriatal Degeneration in Parkinson Disease
Erratum in
-
Corrections to Received Date Information.Neurology. 2024 Jul 9;103(1):e209596. doi: 10.1212/WNL.0000000000209596. Epub 2024 Jun 3. Neurology. 2024. PMID: 38830175 Free PMC article. No abstract available.
Abstract
Background and objectives: There are limited validated biomarkers in Parkinson disease (PD) which substantially hinders the ability to monitor disease progression and consequently measure the efficacy of disease-modifying treatments. Imaging biomarkers, such as vesicular monoamine transporter type 2 (VMAT2) PET, enable enhanced diagnostic accuracy and detect early neurodegenerative changes associated with prodromal PD. This study sought to assess whether 18F-AV-133 VMAT2 PET is sensitive enough to monitor and quantify disease progression over a 2-year window.
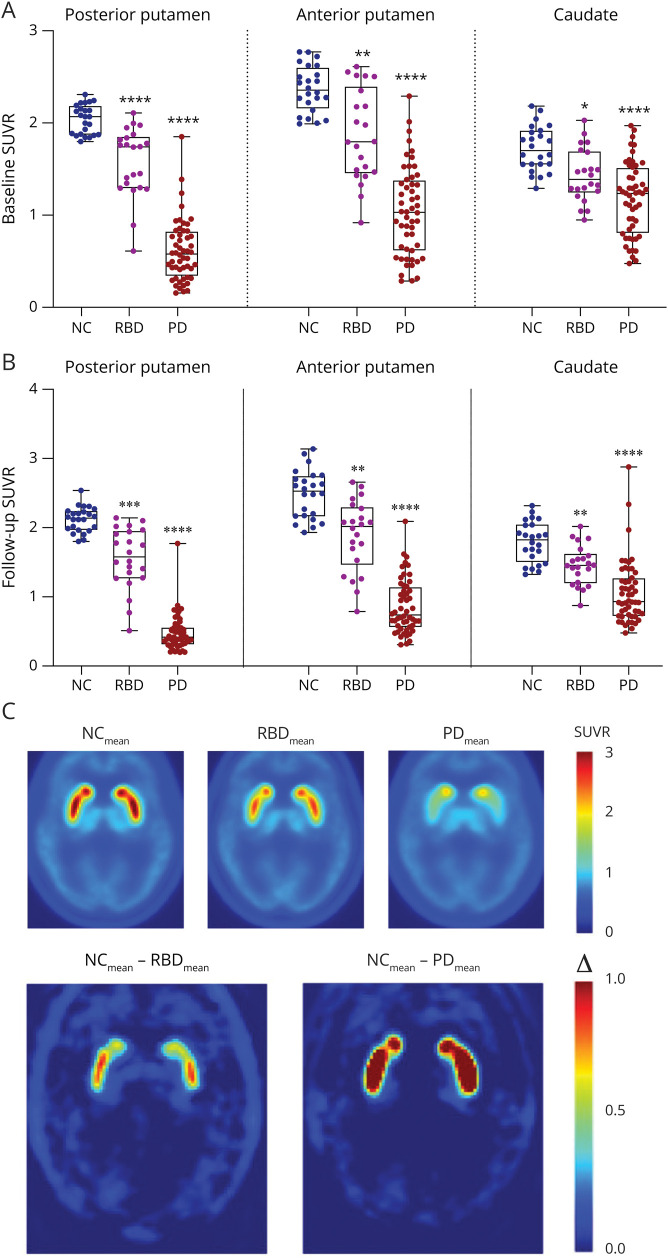
Methods: 18F-AV-133 PET scans were performed on participants with PD and REM sleep behavior disorder (RBD) and neurologic controls (NC). All participants were scanned twice ∼26 months apart. Regional tracer retention was calculated with a primary visual cortex reference region and expressed as the standard uptake volume ratio. Regions of interest included caudate, anterior, and posterior putamen. At the time of scanning, participants underwent clinical evaluation including UPDRSMOTOR test, Sniffin' Sticks, and Hospital Anxiety and Depression Score.
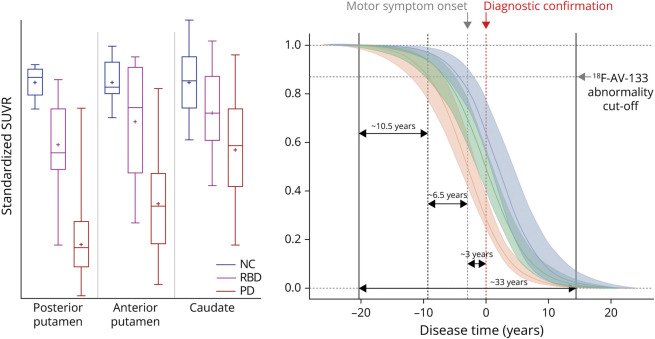
Results: Over the 26-month interval, a significant decline in PET signal was observed in all 3 regions in participants with PD (N = 26) compared with NC (N = 12), consistent with a decrease in VMAT2 level and ongoing neurodegeneration. Imaging trajectory calculations suggest that the neurodegeneration in PD occurs over ∼33 years [CI: 27.2-39.5], with ∼10.5 years [CI: 9.1-11.3] of degeneration in the posterior putamen before it becomes detectable on a VMAT2 PET scan, a further ∼6.5 years [CI: 1.6-12.7] until symptom onset, and a further ∼3 years [CI: 0.3-8.7] until clinical diagnosis.
Discussion: Over a 2-year period, 18F-AV-133 VMAT2 PET was able to detect progression of nigrostriatal degeneration in participants with PD, and it represents a sensitive tool to identify individuals at risk of progression to PD, which are currently lacking using clinical readouts. Trajectory models propose that there is nigrostriatal degeneration occurring for 20 years before clinical diagnosis. These data demonstrate that VMAT2 PET provides a sensitive measure to monitor neurodegenerative progression of PD which has implications for PD diagnostics and subsequently clinical trial patient stratification and monitoring.
Classification of evidence: This study provides Class IV evidence that VMAT2 PET can detect patients with Parkinson disease and quantify progression over a 2-year window.
© 2023 American Academy of Neurology.
Conflict of interest statement
The authors report no relevant disclosures. Go to
Figures

References
-
- Lee CS, Samii A, Sossi V, et al. In vivo positron emission tomographic evidence for compensatory changes in presynaptic dopaminergic nerve terminals in Parkinson's disease. Ann Neurol. 2000;47(4):493-503. - PubMed
-
- Postuma RB, Berg D, Stern M, et al. MDS clinical diagnostic criteria for Parkinson's disease. Mov Disord. 2015;30(12):1591-1601. - PubMed
MeSH terms
Substances
LinkOut - more resources
Full Text Sources
Medical
Research Materials