. 2023 Oct 10;14(1):6326.
doi: 10.1038/s41467-023-42027-6.

HIV-1 treatment timing shapes the human intestinal memory B-cell repertoire to commensal bacteria

Affiliations

HIV-1 treatment timing shapes the human intestinal memory B-cell repertoire to commensal bacteria

Cyril Planchais et al. Nat Commun. .

Abstract

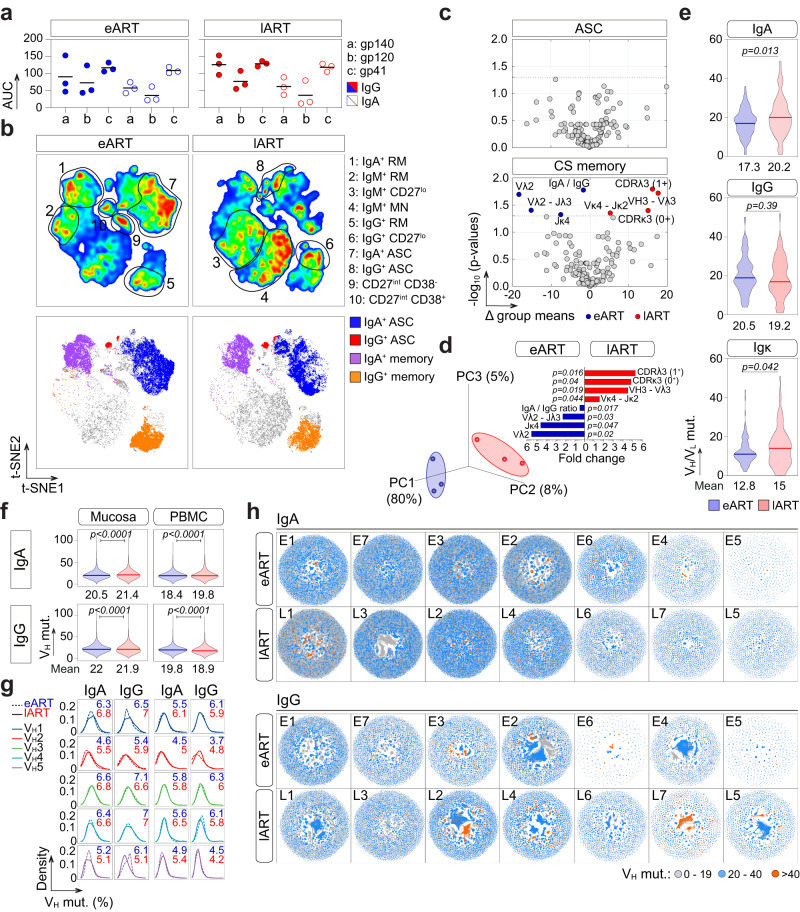
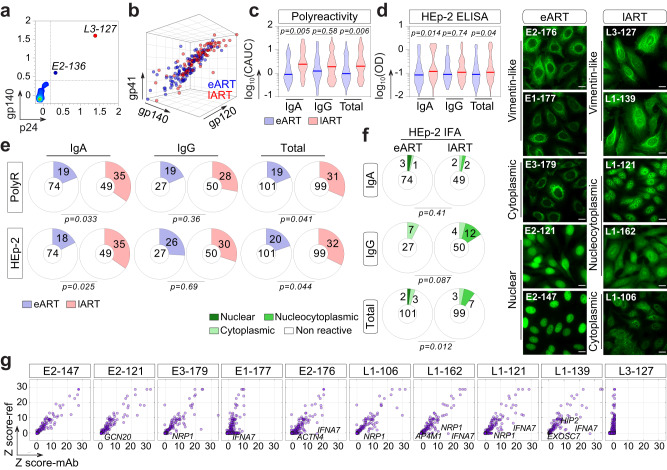
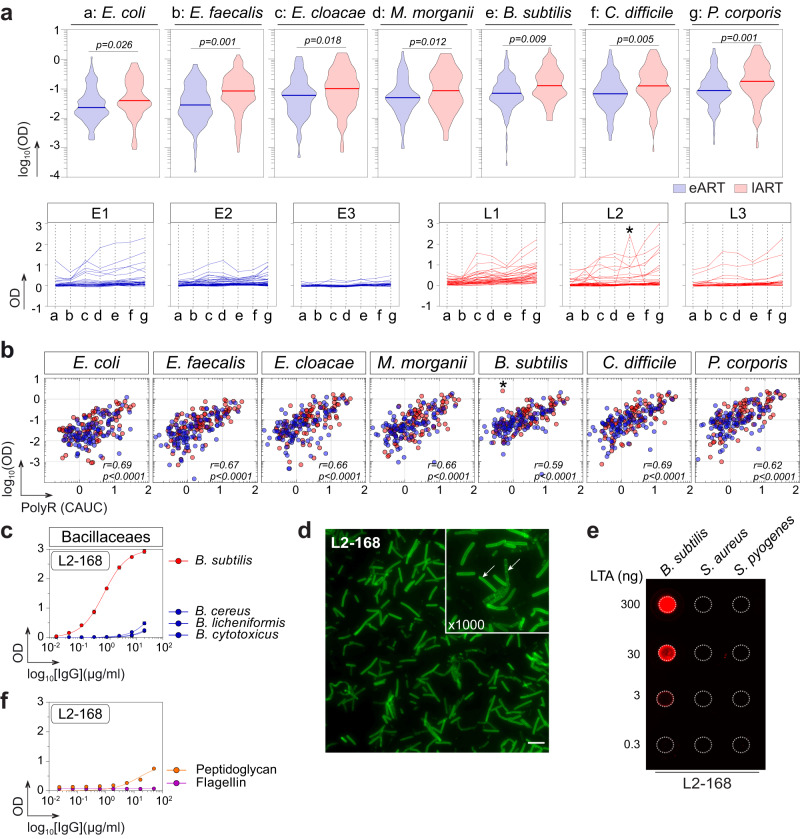
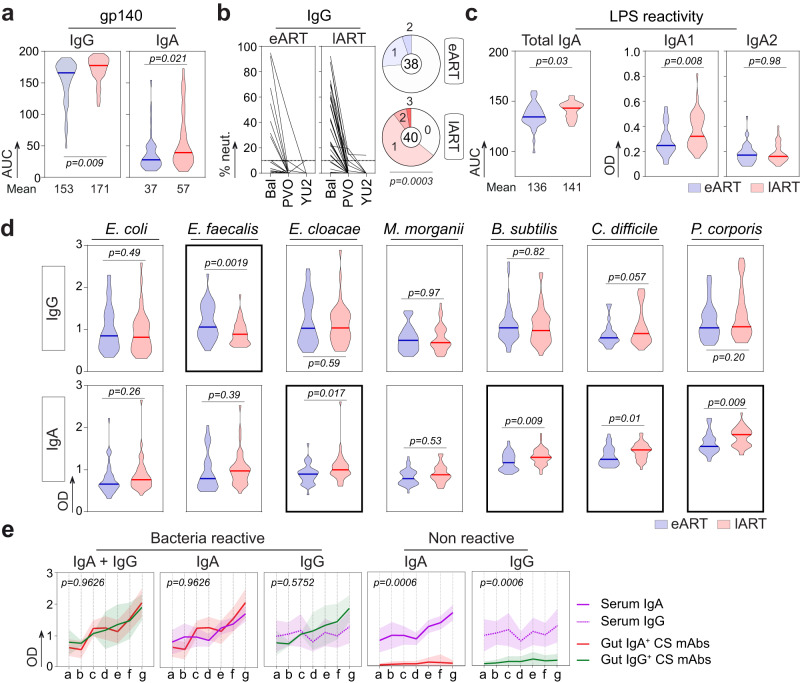
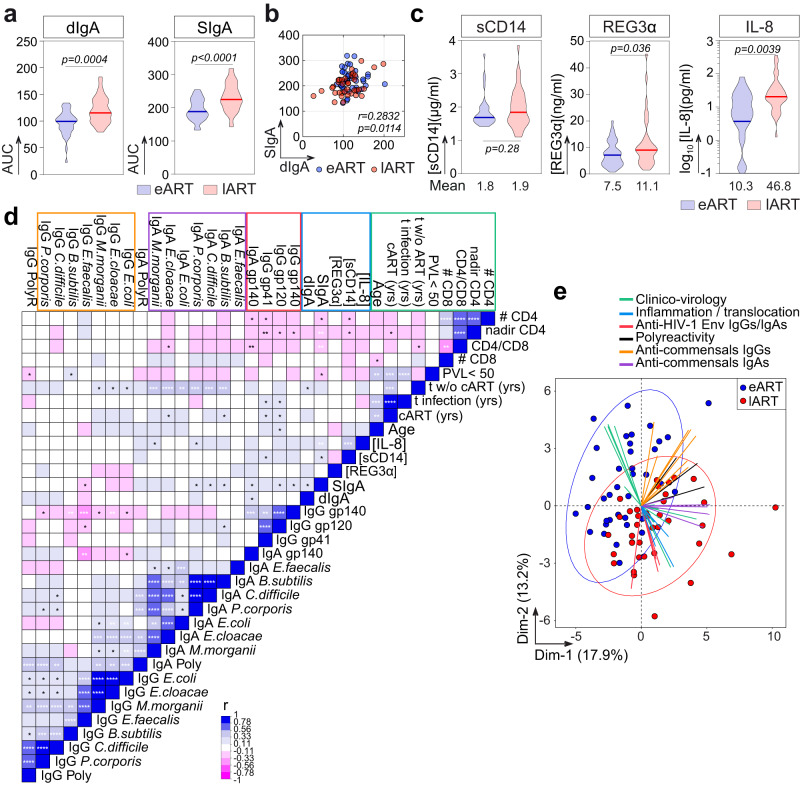
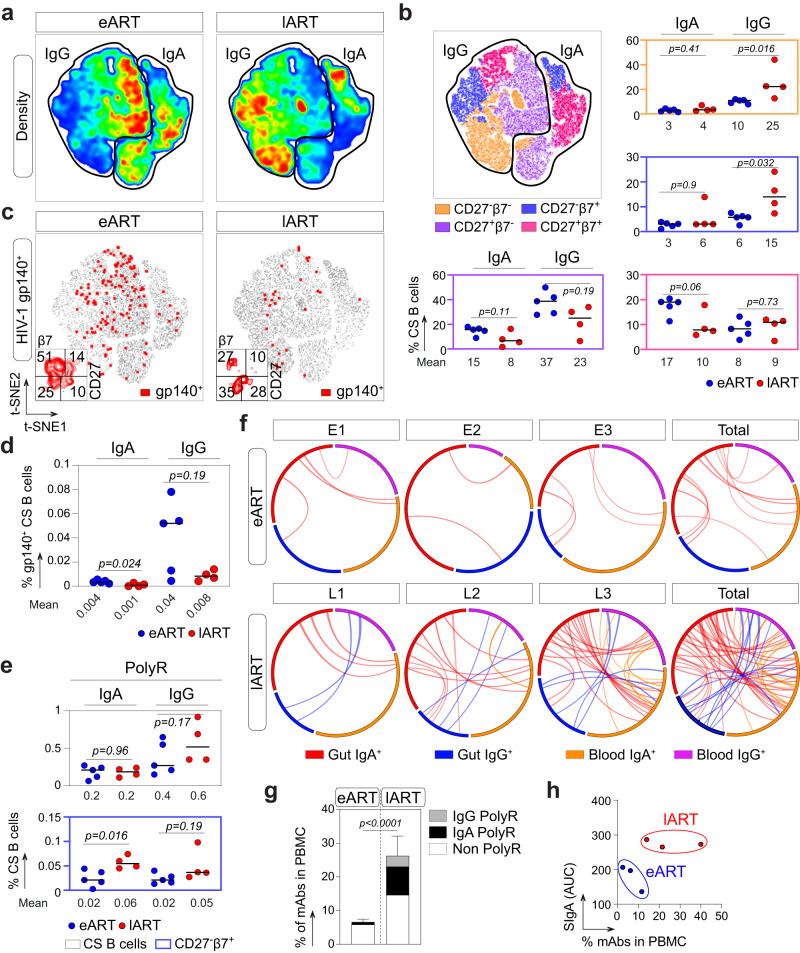
HIV-1 infection causes severe alterations of gut mucosa, microbiota and immune system, which can be curbed by early antiretroviral therapy. Here, we investigate how treatment timing affects intestinal memory B-cell and plasmablast repertoires of HIV-1-infected humans. We show that only class-switched memory B cells markedly differ between subjects treated during the acute and chronic phases of infection. Intestinal memory B-cell monoclonal antibodies show more prevalent polyreactive and commensal bacteria-reactive clones in late- compared to early-treated individuals. Mirroring this, serum IgA polyreactivity and commensal-reactivity are strongly increased in late-treated individuals and correlate with intestinal permeability and systemic inflammatory markers. Polyreactive blood IgA memory B cells, many of which egressed from the gut, are also substantially enriched in late-treated individuals. Our data establish gut and systemic B-cell polyreactivity to commensal bacteria as hallmarks of chronic HIV-1 infection and suggest that initiating treatment early may limit intestinal B-cell abnormalities compromising HIV-1 humoral response.


Conflict of interest statement

The authors declare no competing interests.

Figures

Fig. 1
Fig. 1. Immunoglobulin gene repertoire of intestinal B cells from eART and lART.
a Dot plots comparing the serum anti-HIV-1 Env IgG (colored) and IgA (clear) antibody levels in eART (blue) and lART (red) individuals (n = 3 per group). The y axis indicates the area under the curve (AUC) values of the ELISA binding curves shown in Supplementary Fig. 1a. Bars correspond to the means. Samples were tested in two independent experiments. b t-SNE-based analysis comparing the subset distribution of single mucosal CD19+ cells between eART and lART donors (n = 3; 2 × 105 cells per group) (top). Single-cell sorted B-cell sub-populations are shown in t-SNE plots (bottom). c Volcano plots comparing the immunoglobulin gene repertoires of intestinal antibody-secreting cells (ASC) and class-switched (CS) memory B cells (n = 206 parameters) between e-ART (blue) and l-ART (red). Dashed lines indicate the statistically significant cut-off (p < 0.05). d Plot showing the principal component analysis (PCA) of intestinal CS B cells in eART and lART (left). Contribution plot showing the fold changes of significantly diverging parameters between groups (right). Groups in (c) and (d) were compared using 2 × 2 Fisher’s Exact test. e Violin plots comparing the number of somatic mutations in the IgA/IgG VH (n = 143 for eART and n = 138 for lART) and Vκ genes (n = 96 for eART and n = 88 for lART) from single-sorted intestinal CS B cells between eART (n = 3) and lART donors (n = 3). f Violin plots comparing the number of somatic mutations in the IgA (n = 12,265,476 and 12,779,331 sequences for eART and lART, respectively) and IgG VH (n = 4,669,125 and 7,300,158 sequences for eART and lART, respectively) genes from mucosal and peripheral blood B cells analyzed by NGS between eART (n = 7) and lART (n = 7). The average number of mutations is indicated below each violin plot. Numbers of hypermutation in (e) and (f) were compared between groups using two-tailed unpaired Student’s t test with Welch’s correction. Bars in (e) and (f) represent the medians. g Divergence plots comparing the distribution of intestinal IgA+ and IgG+ B-cell sequences (y-axis) between eART (dashed line) and lART (straight line) according to their VH-gene family and hypermutation frequencies (x-axis). The average frequencies of mutations for eART (blue) and lART (red) are indicated in each plot. h Network visualization comparing the clonal expansion levels of intestinal of IgA+ and IgG+ B cells according to the somatic mutation loads between eART and lART HIV-1-infected individuals. Source data are provided as a Source Data file.
Fig. 2
Fig. 2. Poly- and self-reactivity of intestinal memory B-cell antibodies from eART and lART.
a Plot comparing the ELISA reactivity of mucosal CS memory B-cell antibodies against HIV-1 Env gp140-F vs. p24 (n = 200). Antibodies were tested in triplicate. b 3D dot plot comparing the polyreactive binding of mucosal CS memory B-cell antibodies from eART (blue) and lART (red) to HIV-1 proteins as measured by ELISA in Supplementary Fig. 3a. c Violin plots comparing the ELISA polyreactivity of mucosal CS memory B-cell antibodies from eART (blue) and lART (red). The y-axes indicate the log10 cumulative AUC (CAUC) values for polyreactivity as measured in Supplementary Fig. 3c. Antibodies were tested in two independent experiments. Groups were compared using two-tailed Student’s t test with Welch’s correction. d Same as in (c) but for HEp-2-reactivitity with ELISA OD405 nm values for the binding to HEp-2 cell antigens. Bars in (c) and (d) represent the medians. Antibodies were tested in triplicates. e Pie charts comparing the frequency of poly- and self-reactive of intestinal IgA+ and IgG+ CS B-cell antibodies between eART (blue) and lART (red) as measured in (c) and (d), respectively. The number of tested antibodies is indicated in the pie chart center, and the frequency of the reactive ones (colored) on the chart. Groups were compared using 2 × 2 Fisher’s Exact test. f Microscopic images showing representative antibody reactivities to HEp2-expressing self-antigens detected by indirect immunofluorescence assay (IFA) (representative from two independent experiments). Scale bars represent 15 µm. Pie charts summarizing the IFA data are shown. The number of tested antibodies is indicated in the pie chart center, and the frequency of the reactive ones (colored) on the chart. Groups were compared using 2 × 5 Fisher’s Exact test. g Microarray plots showing the reactivity profile of selected antibodies to human proteins. For each protein spot, Z-scores given by the reference (Ref: mGO53) and test antibody are depicted on the y- and x-axis, respectively. Immunoreactive proteins are indicated in each plot. Source data are provided as a Source Data file.
Fig. 3
Fig. 3. Antimicrobial binding of intestinal memory B-cell antibodies from eART and lART.
a Violin plots (top) comparing the antibody binding to commensal bacteria between eART (blue) and lART (red) donors. Averaged values of antibodies (n = 200) tested in duplicate in two independent experiments are shown. Groups were compared using two-tailed unpaired Student’s t test with Welch’s correction. Plots (bottom) comparing the reactivity pattern of individual antibodies to commensal bacteria between eART (blue) and lART (red). * indicates that L2-168 antibody specifically binds to B. subtilis. Bars correspond to the medians. Antibodies were tested in duplicate in two independent experiments. b Correlation plots of polyreactivity vs. binding of intestinal memory B-cell antibodies to commensal bacteria. The x-axis indicates the polyreactivity CAUC values presented in Fig. 2b. Bivariate correlations were estimated with the two-tailed Pearson correlation test. c Representative ELISA graphs showing the reactivity of L2-168 antibody against selected Bacillaceaes strains (B. cereus, B. licheniformis, B. cytotoxicus and B. subtilis). Means ± SEM of triplicate values are shown. d Microscopic image showing the IFA binding of L2-168 antibody to B. subtilis (Magnifications ×100 and ×1000) (representative of two independent experiments). The scale bar represents 15 µm. e Dot blot comparing the reactivity of L2-168 to purified LTA from Gram+ bacteria: B. subtilis, S. aureus and S. pyogenes. f Same as in (c) but for purified peptidoglycan and flagellin from B. subtilis. L2-168 antibody was tested in triplicate. Source data are provided as a Source Data file.
Fig. 4
Fig. 4. Serum IgG and IgA antibody profiling in eART and lART.
a Violin plots comparing the binding of purified serum IgA and IgG antibodies to gp140 between eART (blue, n = 38) and lART (red, n = 40). The mean AUC is indicated below each violin plot. Bars represent the medians. Groups were compared using two-tailed unpaired Student’s t test with Welch’s correction. Antibodies were tested in duplicate. b Graphs comparing the in vitro neutralization activity of purified serum IgGs against Bal.26 (Bal), YU2.DG (YU2) and PVO.4 (PVO) between eART (n = 38) and lART (n = 40). Means from triplicates from TZM-bl assay experiments are shown. Pie charts summarize the frequency of individuals with IgG-mediated neutralizing activities (>10%) against one (1), two (2) or three (3) viruses (colored). White color indicates that no neutralization was detected (0). Groups were compared using 2 × 5 Fisher’s Exact test. c Violin plots comparing the binding of serum IgA, IgA1 and IgA2 antibodies to LPS between eART (blue, n = 38) and lART (red, n = 40). Means of triplicate values are shown. d Same as in (c) but for purified serum IgG and IgA antibodies against selected commensal bacteria. Bars in (c) and (d) represent the medians. Groups were compared using two-tailed unpaired Student’s t test with Welch’s correction. Antibodies were tested in duplicate. e Graphs showing the reactivity profiles against commensal bacteria of purified serum antibodies (IgA, purple straight lines; IgG, purple dashed lines; n = 78 in total) and bacteria-reactive monoclonal antibodies (mucosal IgA, red line (n = 10) and mucosal IgG, green line (n = 5)). Data are presented as mean values ± SD. Cumulative distributions between groups were compared using the two-tailed Kolmogorov–Smirnov unpaired test. Source data are provided as a Source Data file.
Fig. 5
Fig. 5. Immuno-serological and clinico-virological parameters in eART and lART.
a Violin plots comparing the serum levels of dimeric (dIgA) (left) and secretory (SIgA) (right) IgA antibodies between eART (bleu) and lART (red). b Correlation plot comparing the levels of dIgA and SIgA determined by ELISA in eART (blue) and lART (red) (bottom). Bivariate correlation was estimated using the two-tailed Pearson correlation test. c Same as in (a) but for sCD14, REG3α, and IL8. The mean concentration from duplicate values is indicated below each violin plot. Bars in (a) and (c) represent the medians. Groups were compared using the two-tailed Student’s t test with Welch’s correction. d Correlation matrix of immunological and clinico-virological parameters (n = 34) from eART (n = 38) and lART individuals (n = 40). Cells are color-coded according to the value of two-sided Pearson rho correlation (r) coefficients. Asterisks correspond to unadjusted p values. ****p < 0.0001, ***p < 0.001, **p < 0.01, *p < 0.05. p values under the Benjamini–Hochberg-corrected significance threshold (p = 0.006) are highlighted in white. e PCA 2D-plot showing the clinico-virological and serological variables (color-coded) discriminating eART (blue, n = 38) and lART (red, n = 40). The two first dimensions account for 31.1% of the variability. Source data are provided as a Source Data file.
Fig. 6
Fig. 6. Env- and poly-reactivity of blood memory B cells from eART and lART.
a Density plots showing the t-SNE analysis of circulating blood IgA+ and IgG+ CD19+ cells from eART (n = 5) and lART (n = 4) (2 × 105 cells per group). b t-SNE plot showing the distribution of blood B-cell subsets (based on CD27 and β7 markers) in circulating blood IgA+ and IgG+ CD19+ cells from eART (n = 5) and lART (n = 4). Dot plots comparing the blood B-cell subset frequencies between eART (blue) and lART (red) are shown. The average frequency of positive cells is indicated below each dot plot. c t-SNE density plots comparing the distribution of HIV-1 gp140-specific cells (shown in red), with a phenotypic analysis of these cells based on CD27 and β7 surface expression at the bottom left-hand corner. d Dot plots comparing gp140+ B-cell frequencies between eART (n = 5) and lART (n = 4). The average frequency of reactive cells among total IgA+ and IgG+ B cells is indicated below each dot plot. e Same as in (b) but for polyreactive B cells (PolyR+). Bars in (b), (d) and (e) represent the means. Groups were compared using two-tailed Mann–Whitney test. f Circos plots comparing the antibody sequence relationships between single-cell-sorted mucosal B cells and NGS libraries between cellular compartments. Interconnecting lines indicate sequences sharing identical VH and JH gene segments and at least 90% CDRH3 amino acid sequence homology. Groups were compared using 2 × 2 Fisher’s Exact test. g Bar graph comparing the frequencies of polyreactive (gray and black for IgG and IgA, respectively) and non-polyreactive (white) intestinal memory B-cell antibody sequences found in the blood-derived NGS library between eART (n = 3) and lART (n = 3). Data are presented as mean values ± SD. Groups were compared using 2 × 2 Fisher’s Exact test. h Dot plot presenting the clustering of eART (blue) and lART (red) based on blood SIgA level and frequency of immunoglobulin sequences shared between the blood and the intestinal mucosa. Source data are provided as a Source Data file.

References

    1. Chen K, Magri G, Grasset EK, Cerutti A. Rethinking mucosal antibody responses: IgM, IgG and IgD join IgA. Nat. Rev. Immunol. 2020;20:427–441. doi: 10.1038/s41577-019-0261-1. - DOI - PMC - PubMed
    1. Macpherson AJ. A primitive T cell-independent mechanism of intestinal mucosal IgA responses to commensal bacteria. Science. 2000;288:2222–2226. doi: 10.1126/science.288.5474.2222. - DOI - PubMed
    1. Cerutti A, Chen K, Chorny A. Immunoglobulin responses at the mucosal interface. Annu. Rev. Immunol. 2011;29:273–293. doi: 10.1146/annurev-immunol-031210-101317. - DOI - PMC - PubMed
    1. Pabst O. New concepts in the generation and functions of IgA. Nat. Rev. Immunol. 2012;12:821–832. doi: 10.1038/nri3322. - DOI - PubMed
    1. Li, H. et al. Mucosal or systemic microbiota exposures shape the B cell repertoire. Nature584, 274–278 (2020). - PubMed

Publication types

Substances