. 2023 Oct 10;14(1):6330.
doi: 10.1038/s41467-023-41771-z.

Kupffer cells prevent pancreatic ductal adenocarcinoma metastasis to the liver in mice

Affiliations

Kupffer cells prevent pancreatic ductal adenocarcinoma metastasis to the liver in mice

Stacy K Thomas et al. Nat Commun. .

Abstract

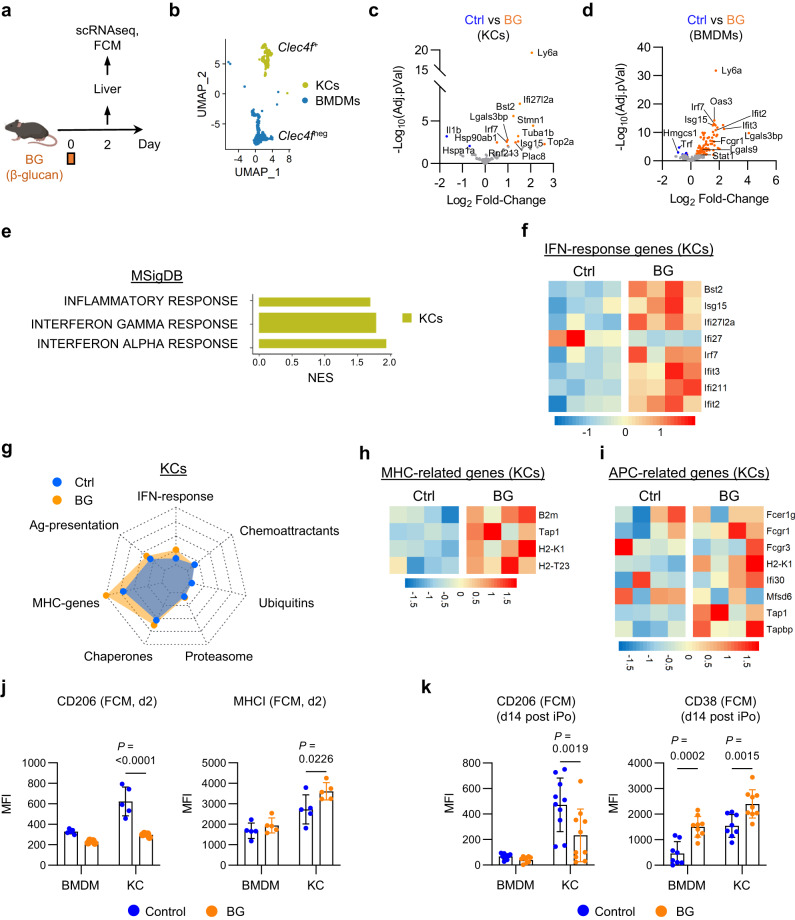
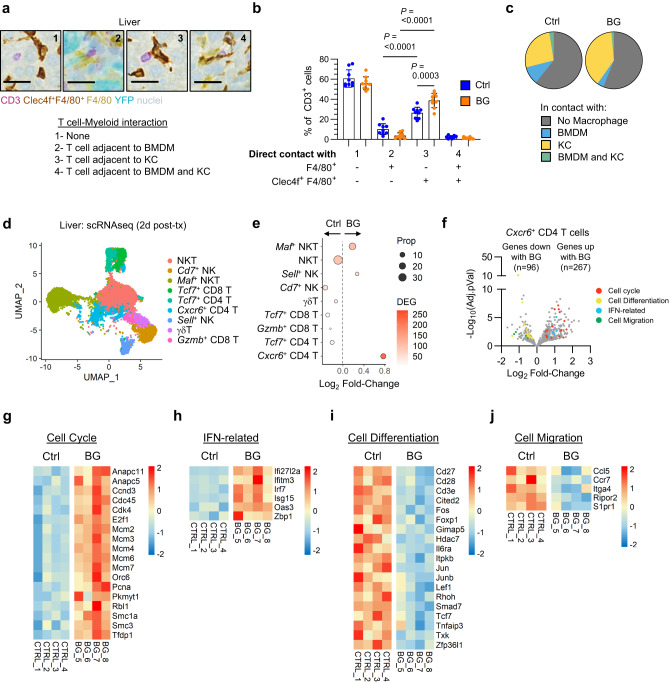
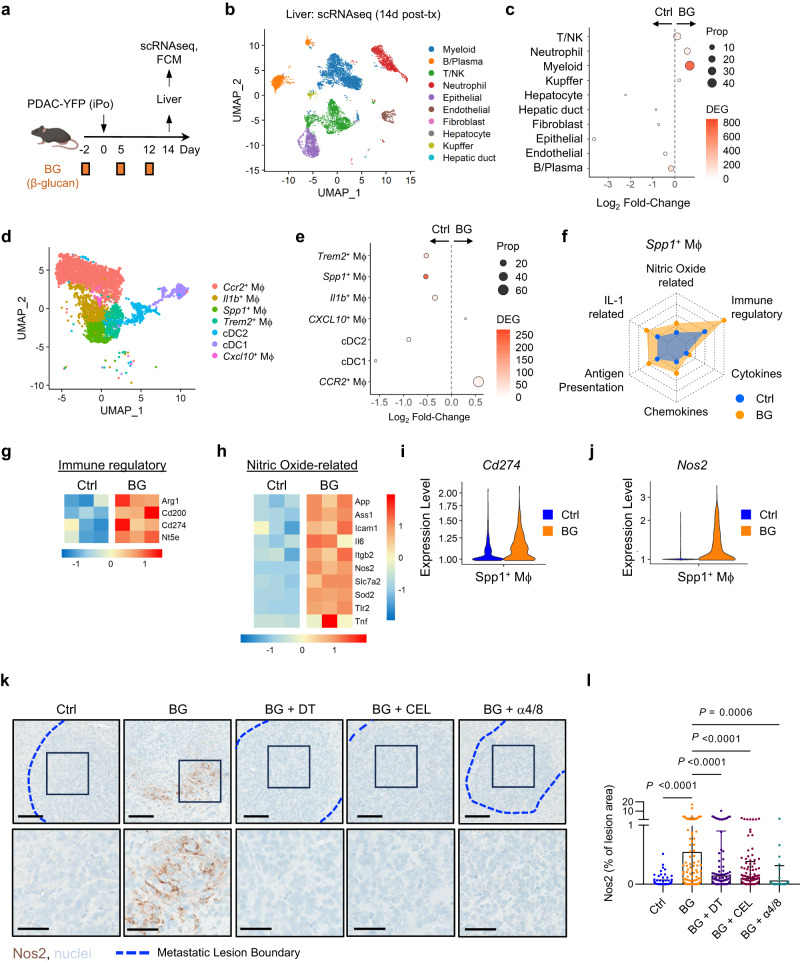
Although macrophages contribute to cancer cell dissemination, immune evasion, and metastatic outgrowth, they have also been reported to coordinate tumor-specific immune responses. We therefore hypothesized that macrophage polarization could be modulated therapeutically to prevent metastasis. Here, we show that macrophages respond to β-glucan (odetiglucan) treatment by inhibiting liver metastasis. β-glucan activated liver-resident macrophages (Kupffer cells), suppressed cancer cell proliferation, and invoked productive T cell-mediated responses against liver metastasis in pancreatic cancer mouse models. Although excluded from metastatic lesions, Kupffer cells were critical for the anti-metastatic activity of β-glucan, which also required T cells. Furthermore, β-glucan drove T cell activation and macrophage re-polarization in liver metastases in mice and humans and sensitized metastatic lesions to anti-PD1 therapy. These findings demonstrate the significance of macrophage function in metastasis and identify Kupffer cells as a potential therapeutic target against pancreatic cancer metastasis to the liver.


Conflict of interest statement

G.L.B. reports prior or active roles as a consultant/advisory board member for Boehinger Ingelheim, Adicet Bio, Aduro Biotech, AstraZeneca, BiolineRx, BioMarin Pharmaceuticals, Boehinger Ingelheim, Bristol-Myers Squibb, Cantargia, Cour Pharmaceuticals, Genmab, HiberCell, HotSpot Therapeutics, Incyte, Janssen, Legend Biotech, Merck, Monopteros, Molecular Partners, Nano Ghosts, Opsona, Pancreatic Cancer Action Network, Seagen, Shattuck Labs, and Verastem, and; reports receiving commercial research grants from Alligator Biosciences, Arcus, Bristol-Myers Squibb, Genmab, Gilead, Halozyme, HiberCell, Incyte, Janssen, Newlink, Novartis, and Verastem,. G.L.B. is an inventor of intellectual property (U.S. patent numbers 10,640,569 and 10,577,417) and recipient of royalties related to CAR T cells that is licensed by the University of Pennsylvania to Novartis and Tmunity Therapeutics. N.B., J.D., B.H. are employees of Hibercell, Inc. M.U. is a previous employee of Hibercell and current employee of OncXerna. N.B., J.D., B.H., M.U. are Hibercell stockholders. N.B., M.U. are an inventors of intellectual property that is licensed to Hibercell. M.U. holds OncXerna and Rigel stock. M.C. is an employee of Merck & Co., Inc and holds Merck stock. M.M.W. reports prior or active roles as a consultant for Nanology. The remaining authors declare no competing interests.

Figures

Fig. 1
Fig. 1. β-glucan treatment restricts liver metastasis.
a Schematic of macrophage plasticity. b Schematic of Intraportal (iPo) injection model. c Study design for (dj). Data are representative of 4 independent experiments. d Representative gross images of dissected livers. Scale bar, 1 cm. e Quantification of PDAC-YFP tumor cells detected in the liver by FCM in control (n = 10) and BG-treated (n = 9) mice. f Representative images of livers from control and BG-treated mice after iPo injection of PDAC-YFP cells. Tissues stained using hematoxylin and eosin (H&E) (top) and mIHC (bottom). Scale bar, 500μm. Insets show a metastatic lesion. Scale bar, 100μm. g PDAC-YFP (CK19+) tumor cells detected in the liver by IHC and shown as a percent of the liver area in control and BG-treated mice (n = 10 each). h CK19+Ki67+ PDAC-YFP tumor cells detected in liver by IHC and shown as cells per CK19+ area (mm2) in control and BG-treated mice (n = 10 each). i Representative images of liver stained by mIHC as indicated in (f). Metastatic lesions, blue dashed lines. Top row images, scale bar, 500μm. Bottom row images. Scale bar, 100μm. j PDAC-YFP (CK19+) tumor cells detected in liver metastatic lesions by IHC and shown as percent of metastatic lesion area as drawn in i. Control (n = 259) and BG-treated (n = 28) tumor lesions were analyzed from control and BG-treated livers (n = 10 each). k Study design for (l). Data are representative of 4 independent experiments. l Quantification of PDAC-YFP tumor cells detected in the liver on Day 2 by FCM in control (n = 9) and BG-treated (n = 9) mice. m Study design for n. Data are representative of 3 independent experiments. n Quantification of PDAC-YFP tumor cells detected in the liver by FCM in control (n = 7) and BG (n = 9) treated mice. o Study design for (p). Kaplan–Meier plot for control (n = 10) and BG (n = 9) treated mice. Data are representative of 2 independent experiments. Unpaired two-tailed Welch’s t-test (e, g, h, j, l, n) and Log-rank test (p). Mean ± SD is shown (e, f, g, h, j, l, n). FCM, flow cytometry; IHC, immunohistochemistry; iPo, intraportal.
Fig. 2
Fig. 2. Kupffer cells are necessary for the liver anti-metastatic effects of BG.
a Study design for (b). Healthy mice (n = 3) were injected with 5-(4,6-Dichlorotriazinyl) Aminofluorescein (DTAF) labeled β-glucan. Two hours later, mice were euthanized, and livers analyzed. b Frequency of each liver immune subsets bound to β-glucan-DTAF, as measured by FCM. c Frequency of KC and BMDMs bound to β-glucan-DTAF, as measured by FCM in n = 3 healthy mice. d Study design for (eh). e Representative images of livers from control, BG and BG + DT treated mice 14 days after iPo injection of PDAC-YFP cells. Tissues stained using hematoxylin and eosin (H&E) (top) and mIHC (bottom) to detect CK19 (teal), CD3 (purple), Ki67 (yellow), and nuclei (blue, hematoxylin). Scale bar, 500 μm. Insets show a metastatic lesion. Scale bar, 100μm. f Quantification of PDAC-YFP tumor cells detected in the liver on Day 14 by FCM (n = 8 mice/grp). g PDAC-YFP (CK19+) tumor cells detected in liver metastatic lesions on Day 14 by IHC and shown as percent of metastatic lesion area as drawn in (e). (n = 8 mice/group). h Proliferating PDAC-YFP (CK19+Ki67+) tumor cells detected in liver metastatic lesions on Day 14 by IHC and shown as percent of metastatic lesion area as drawn in (i). Control (n = 138), BG-treated (n = 172) and BG + DT treated (n = 175) individual tumor lesions were analyzed from n = 8 livers per group. Data are representative of 2 independent experiments. Unpaired two-tailed Welch’s t test (c) and one-way ANOVA with Sidak’s test (b, f, g, h). Mean ± SD is shown (b, c, f, g, h). BG-DTAF, β-glucan-5-(4,6-Dichlorotriazinyl) Aminofluorescein; DCs, dendritic cells; KC, Kupffer cells; BMDMs, bone marrow-derived macrophages; iPo, intraportal; DT, diphtheria toxin; BG, β-glucan.
Fig. 3
Fig. 3. β-glucan upregulates antigen presentation pathways in Kupffer cells.
a Study design for (bi). b UMAP of macrophage populations identified from scRNAseq of control (n = 4) and BG-treated (n = 4) mouse livers. KCs (green) and BMDMs (blue) are defined by Clec4f expression. c, d Volcano plots of differentially expressed genes by pseudobulk analysis among Kupffer cells (c) and BMDMs (d) in control versus BG-treated livers. Annotated upregulated (orange) and downregulated (blue) genes after BG are highlighted. Significance determined by log2FoldChange < −0.5 or > 0.5 and adjusted p-value < 0.05. e Bar graph of selected gene sets identified as enriched by GSEA in KCs after treatment with BG. f Heatmap of IFN-response genes upregulated in KCs after BG. Scale bars indicate log2[TPM] scaled by row across samples. g Radar plot showing selected gene sets expressed by KCs in control (blue) and BG (orange) treated livers. Axis represents the mean TPM of selected gene set associated genes with range 0 to 172 TPM. hi Heatmaps of MHC-related (h) and Antigen-presenting cell-related (i) genes upregulated in KCs after BG. Scale bars indicate log2[TPM] scaled by row across samples. j Quantification of CD206 (left) and MHC class I (H2-Kb/H2-Db, right) expression by BMDMs and KCs in the liver on Day 2 by FCM (n = 5 mice/group). k Quantification of CD206 (left) and CD38 (right) expression by BMDMs and KCs in the liver on Day 14 by FCM (n = 10 mice/group). Two-way ANOVA with correction for multiple comparison (j and k). Mean ± SD is shown (j and k). Flow cytometry data are representative of 2 independent experiments. BMDM, bone marrow derived macrophage; FCM, flow cytometry; iPo, intraportal; KC, Kupffer cell; scRNAseq, single cell RNA sequencing; Ctrl, control; IFN, interferon; MHC, major histocompatibility complex; APC, antigen presenting cell; NES, normalized enrichment score; MFI, mean fluorescence intensity.
Fig. 4
Fig. 4. β-glucan treatment drives Kupffer cell – T cell interactions.
a Representative images of livers from mice at 14 day after iPo injection of PDAC-YFP tumor cells. Tissues stained using mIHC to detect YFP+ tumor cells (teal), CD3 (purple), F4/80 (yellow), Clec4f (brown), and nuclei (blue, hematoxylin). Images show T cells in contact with (1) no macrophage, (2) a BMDM, (3) a KC and (4) both a BMDM and a KC. Scale bar, 25μm. b Quantification of cell-cell interactions between T cells (CD3+) and liver macrophage subsets (Clec4f+F4/80+, KCs; F4/80+, BMDMs) in mouse livers of control and BG-treated mice at 14 days after iPo injection of 200,000 PDAC-YFP tumor cells (n = 9 mice/grp). One-way ANOVA with Tukey’s test. Mean ± SD is shown. c Pie charts summarizing data shown in (b). d UMAP of T cell/NK populations identified by scRNAseq in control and BG-treated livers on day 2. e Dot plot of Log2 Fold-Change in T cell/NK population frequency in BG-treated livers compared to control livers. Size represents the proportion of total T cell/NK and color indicates the number of differentially expressed genes in BG versus control. f, Volcano plot of differentially expressed genes by pseudobulk analysis among Cxcr6 CD4+ T cells in control versus BG-treated livers. Annotations highlight genes associated with the cell cycle (red), cell differentiation (yellow), IFN (blue) and cell migration (green). Significance determined by log2FoldChange < −0.5 or > 0.5 and adjusted p value < 0.05. gj Heatmaps of cell cycle (g), IFN-related (h), cell differentiation (i) and cell migration (j) gene set associated genes, differentially expressed in Cxcr6 CD4+ T cells from control and BG-treated livers on day 2. Scale bars indicate log2[TPM] scaled by row across samples. BMDM, bone marrow-derived macrophage; KC, Kupffer cell; scRNAseq, single-cell RNA sequencing; Ctrl, control; IFN, interferon.
Fig. 5
Fig. 5. β-glucan treatment stimulates T cell mediated anti-tumor immunity.
Study design for (ae) is described in Fig. 1c. a Representative IHC images. Scale bars, 200μm (top) and 50μm (bottom). Metastatic lesions, blue dashed lines. b CD3+ and CD3+Ki67+ cells detected by IHC and shown as cells per metastatic lesion area (mm2). For CD3+ cells in control (n = 289) and BG-treated (n = 57) tumor lesions were analyzed. For CD3+Ki67+ cells, control (n = 262) and BG-treated (n = 53) tumor lesions were analyzed. Unpaired two-tailed Welch’s t test. c Representative IHC images. Contraction (olive green) and tumor (dark blue) zones are outlined. Scale bar, 200μm. Liver, light purple outline. d, e Quantification of CD3+ (d) and CD3+Ki67+ (e) cells detected by IHC and shown as cells per zone area (mm2) as drawn in (c). In (d) individual tumor zones (n = 57) and contraction zones (n = 47) and in (e) individual tumor zones (n = 57) and contraction zones (n = 46) were analyzed. Unpaired two-tailed Welch’s t test. f Study design for (gj). Data are representative of 3 experiments. g Quantification of PDAC-YFP tumor cells detected by FCM in control (n = 9), BG-treated (n = 8) and BG + anti-CD4/CD8 treated (n = 10) mice. One-way ANOVA with Sidak’s test. h Representative IHC images. Scale bars, 200μm (top) and 50μm (bottom). Metastatic lesions, blue dashed lines. i, j PDAC-YFP tumor cells detected by IHC and shown as percent of liver area (i) in control (n = 10), BG-treated (n = 8) and BG + anti-CD4/CD8 treated (n = 8) mice and percent of metastatic lesion area (j) area in control (n = 10), BG-treated (n = 10) and BG + anti-CD4/CD8 treated (n = 8) mice. k Study design for l, m. l, m, Quantification of individual control (n = 138), BG-treated (n = 172) and BG + DT-treated (n = 175) tumor zones (l) and individual contraction zones (m) in livers from n = 10 mice per group. Kruskall-Wallis with Dunn’s multiple comparisons (i, j, l, m). Mean ± SD is shown (b, d, e, g, I, j, l, m). BMDM, bone marrow-derived macrophage; iPo, intraportal; KC, Kupffer cell; DT, diphtheria toxin; Ctrl, control; BG, β-glucan; iso, isotype.
Fig. 6
Fig. 6. Kupffer cells and T cells coordinate BMDM activation.
a Study design for (bj). b UMAP of liver populations identified by scRNAseq in control (n = 3) and BG (n = 3)-treated livers. c Dot plot of Log2 Fold-Change in liver population frequencies in BG-treated livers compared to control livers. Size represents proportion of total cells and color indicates number of differentially expressed genes in BG versus control. d UMAP of BMDM/cDC populations identified by scRNAseq. e Dotplot of Log2 fold change in BMDM population frequencies in BG-treated livers compared to control livers. Size represents proportion of total cells and color indicates number of differentially expressed genes in BG versus control. f Radar plot showing selected gene sets expressed by Spp1+MΦs in control (blue) and BG (orange) treated livers. Axis represents the mean TPM of selected gene set-associated genes with range 0 to 172 TPM. g, h Heatmaps of immune regulatory (g) and nitric oxide-related (h) gene set associated genes, upregulated in Spp1+MΦs from control and BG-treated livers. Scale bars indicate log2[TPM] scaled by row across samples. i, j Violin plots of Cd274 (i) and Nos2 (j) expression by Spp1+MΦs in control and BG-treated livers. k Representative images of livers from control mice or mice treated with BG, BG + DT, BG + CEL, or BG + a4/8 stained using IHC to detect NOS2 (brown) and nuclei (blue, hematoxylin). The bottom panel highlights the lesion interior. Scale bars, 100μm (top) and 50 μm (bottom). Metastatic lesions, blue dashed lines. l Quantification of NOS2+ staining detected by IHC and shown as percentage of individual control (n = 248), BG-treated (n = 173), BG + DT (n = 350), BG + CEL (n = 260) and BG + α4/8 (n = 61) liver lesion area. Data represents the combination of three independent experiments with control (n = 5), BG-treated (n = 6), BG + DT (n = 8), BG + CEL (n = 5), and BG + α4/8 (n = 5) biological replicates. One-way ANOVA with Sidak’s multiple comparisons test. Mean ± SD is shown. iPo, intraportal; KC, Kupffer cell; BG, β-glucan; scRNAseq, single cell RNA sequencing; MΦ, macrophage; cDC, conventional dendritic cell; Ctrl, control; DT, diphtheria toxin; CEL, clodronate encapsulated liposomes; a4/8, anti-mouse anti-CD4/anti-CD4 monoclonal antibody.
Fig. 7
Fig. 7. BG treatment and anti-PD1 therapy combine to inhibit liver metastasis.
a Representative images of livers from tumor-free mice (Normal Liver, NL, left) and mice treated with control (middle) and BG (right) at 14 days after iPo injection of PDAC-YFP cells. Tissues are stained using IHC to detect PD1 (brown) and nuclei (blue, hematoxylin). Scale bar, 200 μm (top) and 50 μm (bottom). bd PD1+ cells detected by IHC in liver on Day 14 are shown as (b) cells per liver area, (c) cells per liver area in normal liver (n = 3) and after iPo injection of PDAC-YFP without treatment (n = 5) or after treatment with BG (n = 5), and (d) cells per metastatic lesion area (mm2). Kruskal-Wallis test with Dunn’s multiple comparisons testing (b, c) and unpaired two-tailed Welch’s t test (d). e Study design for (f). Data are representative of 2 independent experiments. f, Kaplan-Meier plot of mice following IS injection of PDAC-YFP cells in control (n = 15), BG-treated (n = 14), BG + anti-PD1 (n = 9) and anti-PD1 (n = 9) treated mice. Log-rank test. gl Biopsies of metastatic lesions from patients with TNBC (n = 4) and melanoma (Mel, n = 5) were collected prior to (Pre-RX, left) and after 6 weeks of treatment (On-RX, right) with β-glucan (Odetiglucan) + anti-PD1 (pembrolizumab). g Representative IF images of paired liver biopsies stained for cytokeratin (CK, white), CD68 (green), PD-L1 (red), and nuclei (blue). Scale bars, 20 μm. h Quantification of tumor area pre- and on-treatment for individual patients. Scale bars, 20μm. i Representative IF images of paired liver biopsies stained for cytokeratin (white), CD80 (green), CD206 (pink), and nuclei (blue). Scale bars, 20 μm. j Quantification of myeloid infiltration/activation index for individual patients. k Representative IF images of paired liver biopsies stained for cytokeratin (white), CD8 (green), CD4 (red), and nuclei (blue). l Quantification of T cell infiltration/activation index for individual patients. m Conceptual model. β-glucan treatment activates Kupffer cells, which in turn recruit T cells to metastatic lesions resulting in decreased tumor cell proliferation and sensitization of metastatic lesions to anti-PD1 immunotherapy. Mean ± SD is shown (b, c, d). IHC, immunohistochemistry; IS, intrasplenic; IF, immunofluorescence; TNBC, triple-negative breast cancer.

References

    1. Dillekås H, Rogers MS, Straume O. Are 90% of deaths from cancer caused by metastases? Cancer Med. 2019;8:5574–5576. doi: 10.1002/cam4.2474. - DOI - PMC - PubMed
    1. Thomas SK, Lee J, Beatty GL. Paracrine and cell autonomous signalling in pancreatic cancer progression and metastasis. EBioMedicine. 2020;53:102662. doi: 10.1016/j.ebiom.2020.102662. - DOI - PMC - PubMed
    1. Siegel RL, et al. Cancer statistics, 2022. CA: A Cancer J. Clinicians. 2022;72:7–33. - PubMed
    1. Hidalgo M. Pancreatic cancer. N. Engl. J. Med. 2010;362:1605–1617. doi: 10.1056/NEJMra0901557. - DOI - PubMed
    1. Deeb A, Haque S-U, Olowokure O. Pulmonary metastases in pancreatic cancer, is there a survival influence? J. Gastrointest. Oncol. 2015;6:E48. - PMC - PubMed

Publication types