. 2023 Oct 10;14(1):6159.
doi: 10.1038/s41467-023-41746-0.

The medial septum controls hippocampal supra-theta oscillations

Affiliations

The medial septum controls hippocampal supra-theta oscillations

Bálint Király et al. Nat Commun. .

Erratum in

  • Author Correction: The medial septum controls hippocampal supra-theta oscillations.
    Király B, Domonkos A, Jelitai M, Lopes-Dos-Santos V, Martínez-Bellver S, Kocsis B, Schlingloff D, Joshi A, Salib M, Fiáth R, Barthó P, Ulbert I, Freund TF, Viney TJ, Dupret D, Varga V, Hangya B. Király B, et al. Nat Commun. 2023 Nov 21;14(1):7584. doi: 10.1038/s41467-023-43190-6. Nat Commun. 2023. PMID: 37989730 Free PMC article. No abstract available.

Abstract

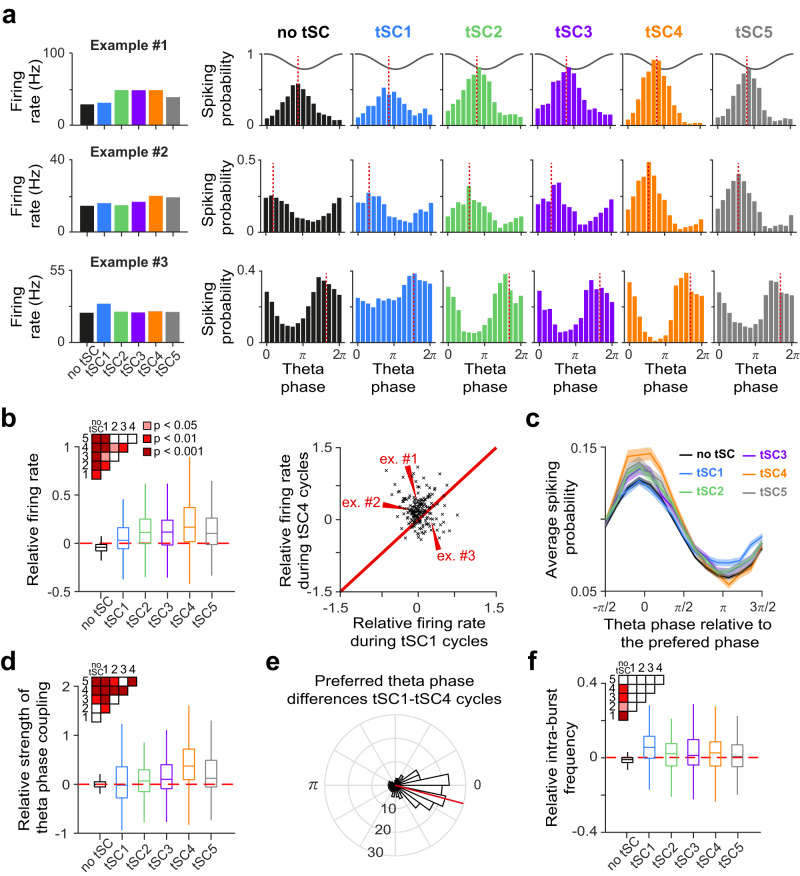
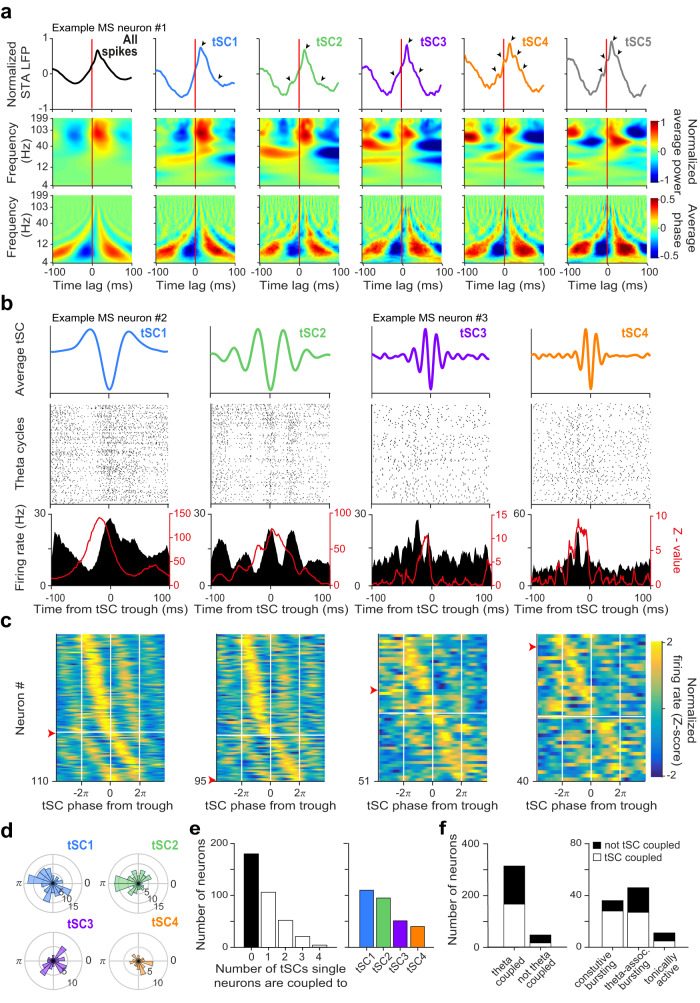
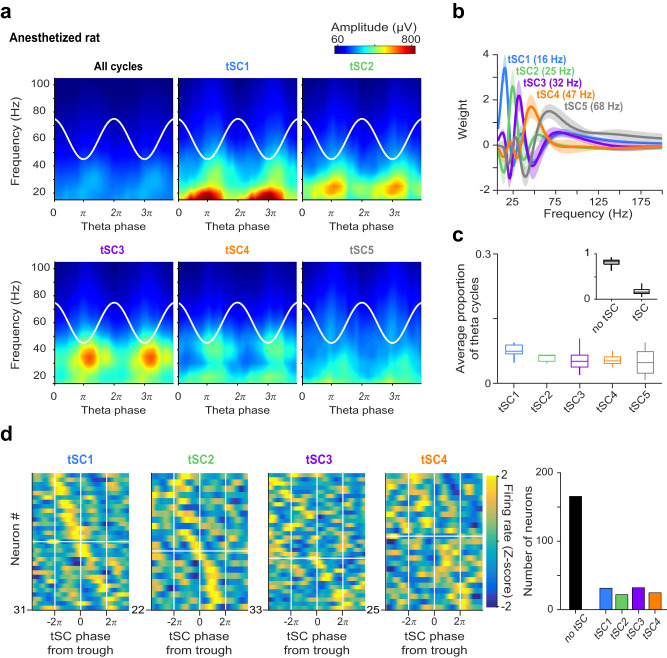
Hippocampal theta oscillations orchestrate faster beta-to-gamma oscillations facilitating the segmentation of neural representations during navigation and episodic memory. Supra-theta rhythms of hippocampal CA1 are coordinated by local interactions as well as inputs from the entorhinal cortex (EC) and CA3 inputs. However, theta-nested gamma-band activity in the medial septum (MS) suggests that the MS may control supra-theta CA1 oscillations. To address this, we performed multi-electrode recordings of MS and CA1 activity in rodents and found that MS neuron firing showed strong phase-coupling to theta-nested supra-theta episodes and predicted changes in CA1 beta-to-gamma oscillations on a cycle-by-cycle basis. Unique coupling patterns of anatomically defined MS cell types suggested that indirect MS-to-CA1 pathways via the EC and CA3 mediate distinct CA1 gamma-band oscillations. Optogenetic activation of MS parvalbumin-expressing neurons elicited theta-nested beta-to-gamma oscillations in CA1. Thus, the MS orchestrates hippocampal network activity at multiple temporal scales to mediate memory encoding and retrieval.


Conflict of interest statement

The authors declare no competing interests.

Figures

Fig. 1
Fig. 1. Supra-theta spectral components in the MS and the hippocampal CA1 radiatum layer of freely moving mice.
a Top, schematic of dual silicon probe recordings from the hippocampal CA1 region and the MS. Bottom, example of synchronously recorded CA1 LFPs and MS extracellular spike rasters. b Inter-spike interval histogram of an example MS neuron (top) and average of all recorded MS neurons (bottom, n = 365 neurons from 6 awake mice). c Power spectrum of an example MS neuron (top) and average of all recorded MS neurons (bottom, n = 365). d Top, normalized average wavelet spectrogram of an example MS spike train (convolved by a Gaussian window, see Methods) triggered on first spikes of bursts. Bottom, average coherence between MS spiking and CA1 LFP triggered on first spikes of bursts of an example MS neuron. Spectrograms were normalized by the mean power for each frequency, thus visualizing the spectral changes around the triggering event. e Example theta cycles dominated by different tSCs. Black, raw LFP signal; red, theta band signal; brown, supra-theta signal extracted by EEMD. Blue, green, purple and orange lines show the dominant tSCs in each example cycle. f Mean amplitude of supra-theta spectral components as a function of theta phase was computed from the raw LFP of an example session, for all cycles (top left) and for cycles strongly expressing a given tSC. Two theta cycles are shown, indicated by white cosine curves. g Average power spectrum of tSCs across all sessions. Peak frequencies are shown in the brackets. Error shades show the standard error of the mean. h Frequency of theta cycles expressing different tSCs. i Average proportion of theta cycles expressing each tSC during long theta periods (left), short theta epochs (middle) and around theta segment boundaries (right). Insets show the proportion of theta cycle expressing any of the tSCs. j Speed of mice during theta cycles expressing different tSCs. Box-whisker plots show median, interquartile range and non-outlier range in panels hj. Differences were tested with two-sided repeated measures ANOVA and Tukey’s post hoc test and significant differences are indicated by the color-coded matrices in (h and j). Source data are provided as a Source Data file.
Fig. 2
Fig. 2. MS single neuron firing is correlated with hippocampal tSCs.
a Three example neurons’ average firing rate (left) and theta phase histogram (right) during theta cycles expressing different tSCs. Cosine curves indicate the theta phase; red dashed lines show the preferred phase. b Left, firing rate distribution of MS neurons (n = 198) as a function of tSC presence, relative to the average firing rate over all cycles (red dashed line). Boxes and whiskers show median, interquartile range and non-outlier range. Differences were statistically tested with two-sided repeated measures ANOVA, followed by Tukey’s test for post hoc comparison. Significant differences are indicated by the color-coded matrix in the inset. Right, relative firing rate of MS neurons during tSC1-expressing theta cycles vs. tSC4-expressing cycles. Example neurons from panel a are marked by red arrowheads. c Average theta phase histogram (relative to the preferred phase) of theta-phase-coupled MS neurons’ (n = 181) firing during theta cycles with different tSCs. Error shades show the standard error of the mean. d Phase coupling strength distribution of theta-coupled MS neurons (n = 181) measured by the mean resultant length over cycles expressing a particular tSC, relative to the average coupling strength over all cycles (red dashed line). Boxes and whiskers show median, interquartile range and non-outlier range. Differences were statistically tested with two-sided repeated measures ANOVA, followed by Tukey’s test for post hoc comparison. Significant differences are indicated by the color-coded matrix in the inset. e Phase histogram of differences between the preferred phase of theta-phase-coupled MS neurons in tSC1 and tSC4 cycles. The red line indicates the mean difference. f Intra-burst frequency distribution of theta-coupled MS neurons (n = 181) as a function of tSC expression, relative to the average intra-burst frequency over all cycles (red dashed line). Boxes and whiskers show median, interquartile range and non-outlier range. Differences were statistically tested with two-sided repeated measures ANOVA, followed by Tukey’s test for post hoc comparison. Significant differences are indicated by the color-coded matrix in the inset. Source data are provided as a Source Data file.
Fig. 3
Fig. 3. MS neurons show phase coupling to hippocampal tSCs.
a Top, spike triggered averages (STA) of the raw CA1 LFPs of an example MS neuron. Theta cycles were sorted by tSC expression (from left to right, all cycles included, theta cycles expressing tSC1 to tSC5). Arrowheads indicate tSC peaks. Middle, spike triggered spectral power images (STS power) of the CA1 LFP for the same example neuron. Bottom, corresponding spike triggered spectral phase images (STS phase) of the same MS neuron. b Firing pattern of two tSC-coupled example MS neurons (example neuron #2 to tSC1 and tSC2, example neuron #3 to tSC3 and tSC4). Top, average tSC signals. Middle, raster plots of spike times aligned to the most negative trough of the tSC signal within each theta cycle. Bottom, peri-event time histograms (PETHs) corresponding to each spike raster (black; y-axis on the left) and Rayleigh’s Z-value as a function of temporal offset between hippocampal tSCs and MS spike trains (red; y-axis on the right). c Z-scored phase histograms of all tSC-coupled MS neurons, sorted into four groups based on the tSC they are coupled to (blue, low firing rate; yellow, high firing rate). Zero phase corresponds to tSC troughs (white vertical lines). Cells within each group are sorted by their preferred phase in two blocks: top, cells with maximum firing rate before the most negative tSC trough; bottom, cells with maximal firing after the most negative tSC trough. Red arrowheads mark the example neurons from panel (b). d Histograms of preferred tSC phases for all tSC-coupled MS neurons, sorted into four groups based on the tSC they are coupled to. e Left, histogram of the number of tSCs single MS neurons are coupled to. Right, number of neurons phase-coupled to each tSC. f Stacked bar chart showing the proportion of tSC-coupled neurons (empty bars) as a function of their theta-coupling (left) and rhythmic firing properties (right). Source data are provided as a Source Data file.
Fig. 4
Fig. 4. Firing of most MS neurons predicts tSCs signals.
a Normalized Rayleigh’s Z-value as a function of temporal lag between hippocampal tSCs and MS spike trains. All MS neurons coupled to the given tSC are shown. Z-values at negative lags quantify how well MS signals predict future tSC values. b Histograms showing the distribution of time lags across MS neurons that realize the maximal phase locking as quantified by the Z-values, separately for each tSC. c Average normalized Z-value of tSC-coupled MS neurons as a function of time lag. Error shade represents SEM. Source data are provided as a Source Data file.
Fig. 5
Fig. 5. Anatomically identified MS cells show differential coupling to CA1 tSCs.
a Main projection targets of Teevra, Orchid and low rhythmic (LRN) MS neurons (MS, medial septum; DG, dentate gyrus; PrS, presubiculum; EC, entorhinal cortex), , . b Top, schematic of the juxtacellular labeling and recording experiment with concurrent recordings from CA1 pyramidal layer in awake mice. Bottom, example of simultaneously recorded CA1 LFPs and MS spikes. c Left, tSC-coupling, immunoreactivity and projection targets of identified MS neurons. Cells were sorted based on the fastest tSC they were coupled to. Right, number of Teevra, Orchid and LRN neurons phase-coupled to each tSC. PV, parvalbumin; CB, calbindin; mGluR1a, metabotropic glutamate receptor 1a; NK1R, neurokinin 1 receptor; SUB, dorsal subiculum; PrSd, dorsal presubiculum; RSg, granular retrosplenial cortex. AJ50j is a putative EC-projecting neuron, as its main axon faded just rostral to caudo-dorsal EC. d Top, Z-scored phase histograms of all identified tSC-coupled MS neurons, sorted into four groups based on the tSC they are coupled to (blue, low firing rate; yellow, high firing rate). Zero phase corresponds to tSC troughs (white vertical lines). Cells within each group were sorted by their preferred phase in two blocks: top, cells with maximum firing rate before the most negative tSC trough; bottom, cells with maximal firing after the most negative tSC trough. Bottom, polar plot showing the phase preference (angle) and coupling strength (radius) of different MS neuron types for each tSC. e Distribution of time lags across different MS neuron types that realize the maximal phase locking as quantified by Rayleigh’s Z-values, separately for each tSC. Source data are provided as a Source Data file.
Fig. 6
Fig. 6. Optogenetic stimulation of PV-expressing MS neurons evokes tSC-like activity patterns in the CA1.
a Left, schematic of the acute experiment with optogenetic stimulation of PV-expressing MS neurons in awake mice. Right, raw LFPs recorded from the CA1 radiatum layer (black) during photostimulation of MS PV-expressing neurons. Blue ticks mark 2 ms laser pulses. Stimulation was performed in theta-modulated bursts of laser pulses (tmS) mimicking the different frequencies of physiological tSCs (22 Hz, 35 Hz, 54 Hz, 80 Hz). b Mean amplitude of supra-theta spectral components as a function of theta phase during the different tmS protocols. Two theta cycles are shown, indicated by the white cosine curves. c Spike rasters and peri-stimulus time histograms of a putative CA1 interneuron aligned to the onset of each tmS sorted by stimulation frequency (blue lines, photostimulation). Note the brief initial suppression of spiking upon photostimulation before the firing rate increase (see also Supplementary Fig. 16). d Laminar profile of currents related to spontaneous tSCs. Left, schematic of a pyramidal cell showing CA1 layers (str. py., stratum pyramidale; str. rad., stratum radiatum; str. lac. mol., stratum lacunosum moleculare). Stoyo, Karamihalev. (2020). CA1 pyramidal neuron. Zenodo. 10.5281/zenodo.4312494. Right, mean amplitude of supra-theta CSD signals as a function of theta phase from an example session of a freely moving mouse (see also Supplementary Fig. 17 for the same analysis on cycles strongly expressing a particular tSC). Note that the upper limit of the y-axis is extended in the stratum pyramidale panel to visualize fast gamma-bands. White cosine curves, two theta cycles are shown. e Mean amplitude of supra-theta CSD signals as a function of theta phase during different tmS protocols, showing the laminar profile of currents related to photostimulation-evoked tSCs. White cosine curves indicate the theta phase defined from the radiatum layer LFP. f Schematic of the experiment using SwiChR injected into the CA1 and an optic fiber implanted into the MS. g Proportion of theta cycles expressing tSCs during inhibition and control periods. Data points belonging to the same recording session (n = 23) are connected with gray lines. Box-whisker plots show median, interquartile range and non-outlier range. **p = 0.0015, two-sided Wilcoxon signed-rank test. Source data are provided as a Source Data file.
Fig. 7
Fig. 7. MS neurons show phase coupling to hippocampal tSCs in anesthetized rats.
a Mean amplitude of supra-theta spectral components as a function of theta phase was computed from the raw LFP of an example session of an anesthetized rat, for all cycles (top left) and for cycles strongly expressing a given tSC. Two theta cycles are shown, indicated by the white cosine curves. b Average tSCs spectra in anesthetized rats (n = 6). Error shades show the standard error of the mean. Median peak frequencies for all recordings are shown in the brackets. c Proportion of theta cycles expressing each tSC (n = 13 sessions). Boxes and whiskers show median, interquartile range and non-outlier range. Insets show the proportion of theta cycle expressing any of the tSCs. d Left, Z-scored phase histograms of all tSC-coupled MS neurons, sorted into four groups based on the tSC they are coupled to (blue, low firing rate; yellow, high firing rate). Zero phase corresponds to tSC troughs (white vertical lines). Cells within each group are sorted by their preferred phase in two blocks: top, cells with maximum firing rate before the most negative tSC trough; bottom, cells with maximal firing after the most negative tSC trough. Right, number of neurons phase-coupled to a given tSC. Source data are provided as a Source Data file.
Fig. 8
Fig. 8. Hypothetical schematic of direct and indirect septo-hippocampal pathways mediating tSCs in the CA1.
In this schematic, we depict the direct and indirect pathways between the MS and the CA1 implicated in controlling distinct CA1 supra-theta oscillations. Color codes for MS projections, including anatomically identified MS neurons, are shown on the left. Cortico-hippocampal and intrahippocampal pathways are color-coded by their dominant tSCs: tSC1, blue; tSC2, green; tSC3, purple; tSC3, green; tSC4, orange; tSC5, gray. i We suggest that direct GABAergic MS-CA1 projections (dark red curve) contribute to tSCs1-4. ii Orchid cells (teal) are likely important determinants of tSC3-4 in CA1 via their projections to PrS and EC. iii Teevra neurons (magenta) contribute to tSC1-2 through the CA3. iv LRNs (mustard) also form part of the tSC1-2 network via their projections to CA3 and DG. v Further indirect MS-EC-CA3/DG-CA1 pathways probably also contribute to the control of tSC1-2 components in the CA1. vi Local processing in the CA1 strongly contributes to fast gamma (tSC5) oscillations. vii Hippocampo-septal feedback by somatostatin-expressing GABAergic neurons (brown) could control tSC generation by negative feedback. MS, medial septum; EC, entorhinal cortex; PrS, dorsal presubiculum; DG, dentate gyrus; LRN, Low-rhythmic neurons; str. py., stratum pyramidale; str. rad., stratum radiatum; str. lac. mol., stratum lacunosum moleculare.

References

    1. Vanderwolf C. Hippocampal electrical activity and voluntary movement in the rat. Electroencephalogr. Clin. Neurophysiol. 1969;26:407–418. - PubMed
    1. Csicsvari, J., Hirase, H., Czurkó, A., Mamiya, A. & Buzsáki, G. Oscillatory coupling of hippocampal pyramidal cells and interneurons in the behaving rat. J. Neurosci.19, 274–287 (1999). - PMC - PubMed
    1. O’Keefe J, Recce ML. Phase relationship between hippocampal place units and the EEG theta rhythm. Hippocampus. 1993;3:317–330. - PubMed
    1. Colgin LL. Mechanisms and functions of theta rhythms. Annu. Rev. Neurosci. 2013;36:295–312. - PubMed
    1. O’Keefe J. Hippocampus, theta, and spatial memory. Curr. Opin. Neurobiol. 1993;3:917–924. - PubMed

Publication types

MeSH terms