. 2023 Oct 10;14(10):664.
doi: 10.1038/s41419-023-06202-3.

Inhibition of mitochondrial fission activates glycogen synthesis to support cell survival in colon cancer

Affiliations

Inhibition of mitochondrial fission activates glycogen synthesis to support cell survival in colon cancer

Sumati Hasani et al. Cell Death Dis. .

Abstract

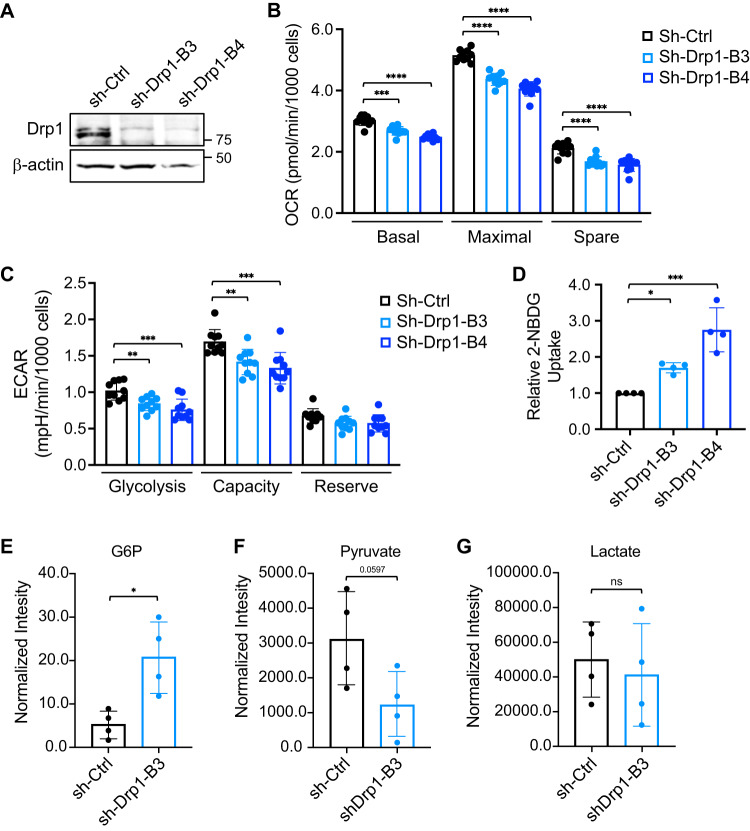
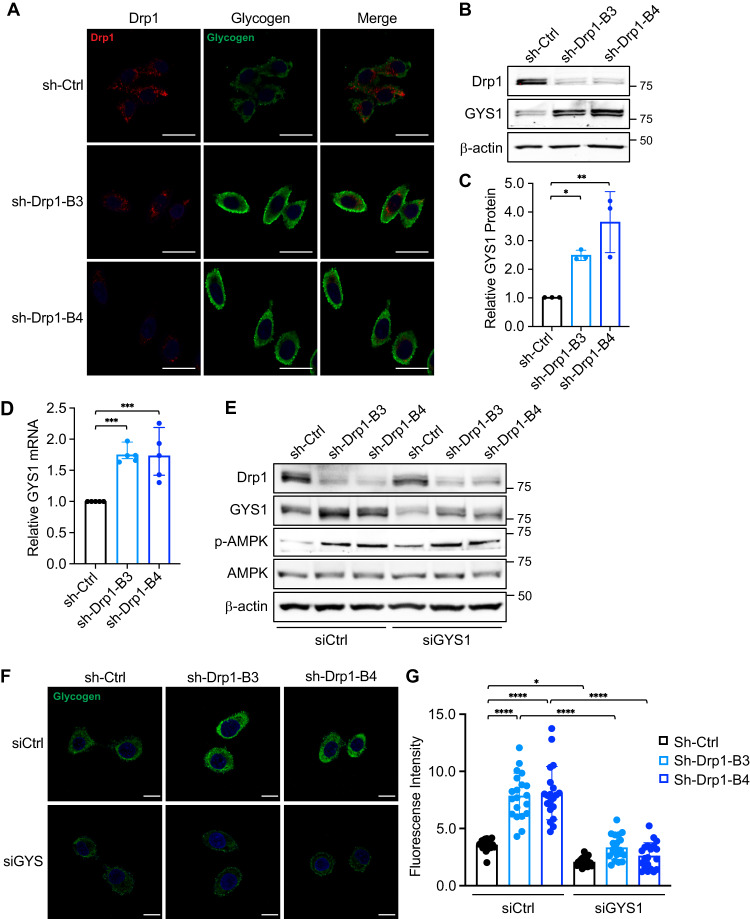
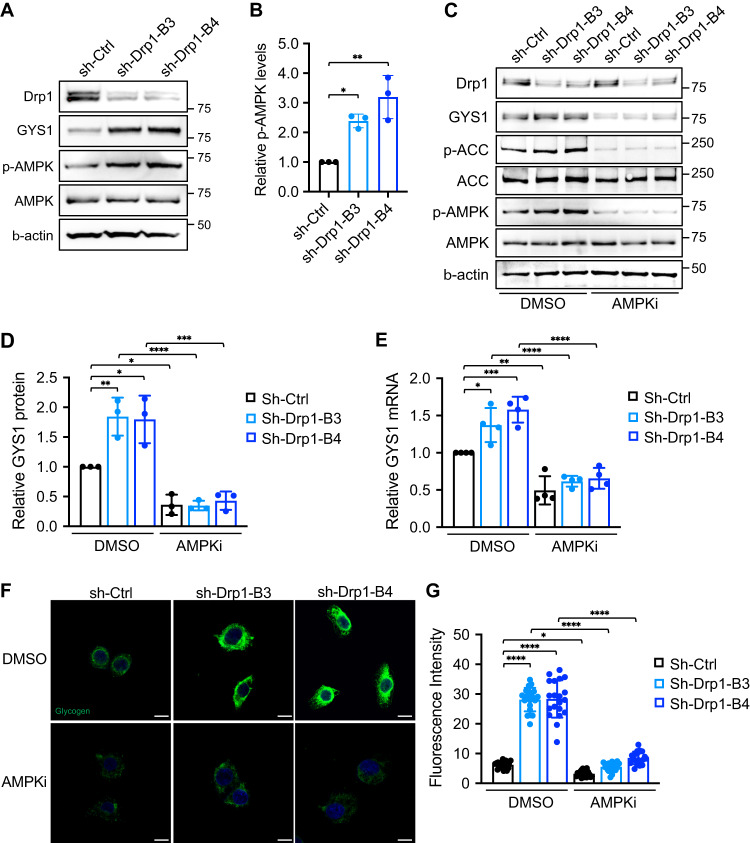
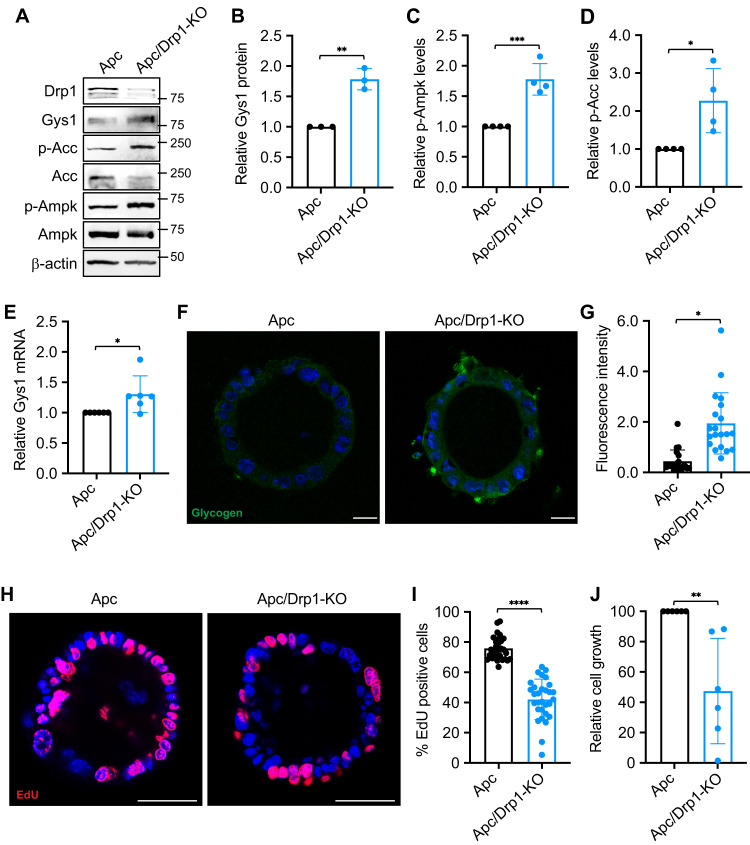
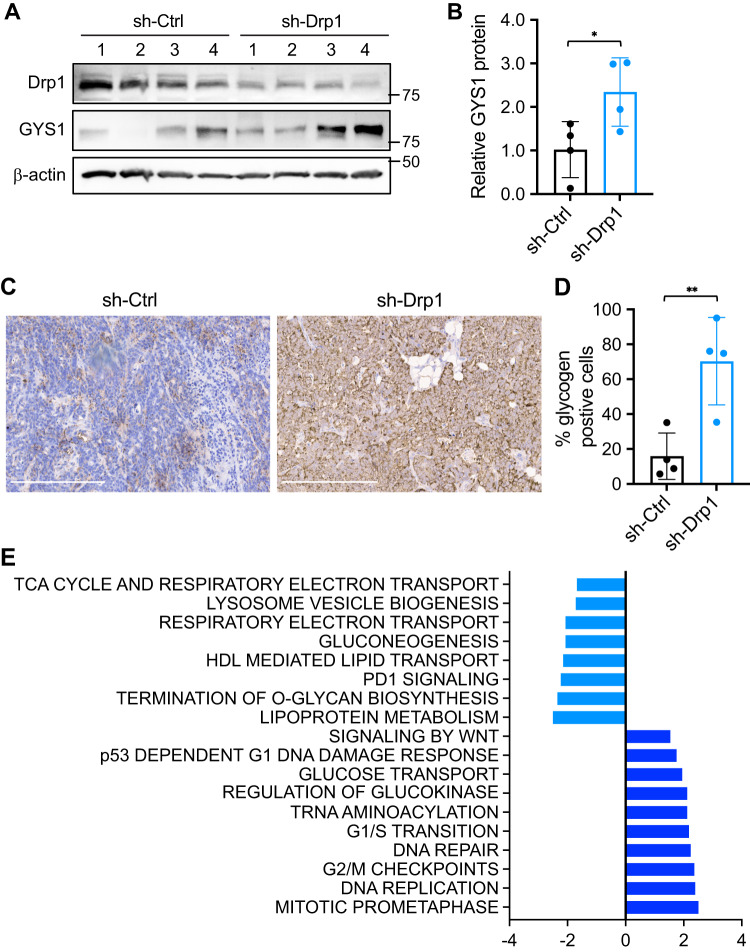
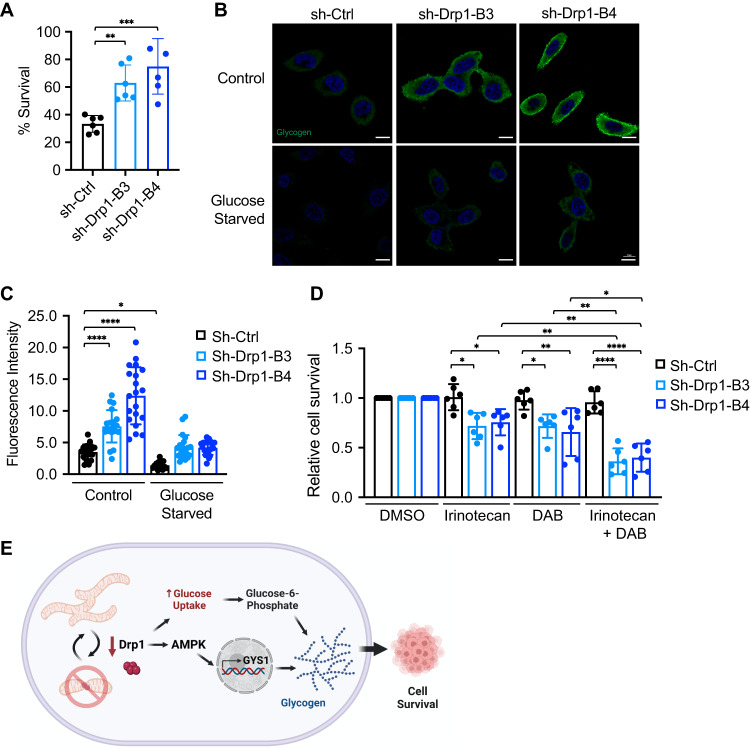
Metabolic reprogramming has been recognized as one of the major mechanisms that fuel tumor initiation and progression. Our previous studies demonstrate that activation of Drp1 promotes fatty acid oxidation and downstream Wnt signaling. Here we investigate the role of Drp1 in regulating glycogen metabolism in colon cancer. Knockdown of Drp1 decreases mitochondrial respiration without increasing glycolysis. Analysis of cellular metabolites reveals that the levels of glucose-6-phosphate, a precursor for glycogenesis, are significantly elevated whereas pyruvate and other TCA cycle metabolites remain unchanged in Drp1 knockdown cells. Additionally, silencing Drp1 activates AMPK to stimulate the expression glycogen synthase 1 (GYS1) mRNA and promote glycogen storage. Using 3D organoids from Apcf/f/Villin-CreERT2 models, we show that glycogen levels are elevated in tumor organoids upon genetic deletion of Drp1. Similarly, increased GYS1 expression and glycogen accumulation are detected in xenograft tumors derived from Drp1 knockdown colon cancer cells. Functionally, increased glycogen storage provides survival advantage to Drp1 knockdown cells. Co-targeting glycogen phosphorylase-mediated glycogenolysis sensitizes Drp1 knockdown cells to chemotherapy drug treatment. Taken together, our results suggest that Drp1-loss activates glucose uptake and glycogenesis as compensative metabolic pathways to promote cell survival. Combined inhibition of glycogen metabolism may enhance the efficacy of chemotherapeutic agents for colon cancer treatment.


Conflict of interest statement

The authors declare no competing interests.

Figures

Fig. 1
Fig. 1. Knockdown of Drp1 alters glucose metabolism.
A Cell lysates of control (sh-Ctrl) and two Drp1 knockdown (sh-Drp1-B3 and sh-Drp1-B4) PT130 cells were analyzed for the expression of Drp1 and β-actin using western blot. B Control and Drp1 knockdown PT130 cells were subjected to Mito Stress tests using Seahorse XF96 Extracellular Flux Analyzer as described in Materials and methods. The OCR measurements associated with basal, maximal, and spare capacity of mitochondrial respiration were calculated by normalizing to total cell numbers. Data represent the mean ± SD (n = 10, ***p < 0.001 and ****p < 0.0001). C Control and Drp1 knockdown PT130 cells were subjected to Glycolysis Stress tests using Seahorse XF96 Extracellular Flux Analyzer. The ECAR measurements associated with glycolysis, glycolytic capacity, and glycolytic reserve were calculated by normalizing to total cell numbers. Data represent the mean ± SD (n = 10, **p < 0.01 and ***p < 0.001). D Control and Drp1 knockdown PT130 cells were incubated with 2-NBDG and Hoechst in low glucose media for 1 h. Relative glucose uptake was calculated by normalizing fluorescence signals detected from 2-NBDG to Hoechst. Data were presented as mean ± SD (n = 4, *p < 0.05 and ***p < 0.001). EG Control and Drp1 knockdown PT130 cells were cultured in low glucose media for 18 h. Polar metabolites were extracted and analyzed using GC-MS. The levels of metabolites, including G6P (E), pyruvate (F), and lactate (G), in the glycolytic pathway are shown. Data were presented as mean ± SD (n = 4, *p < 0.05).
Fig. 2
Fig. 2. Knockdown of Drp1 promotes glycogen accumulation.
A Representative confocal images of control (sh-Ctrl) and Drp1 knockdown (sh-Drp1-B3 and sh-Drp1-B4) PT130 cells that were stained with antibodies against Drp1 (red) and glycogen (green). Scale Bar, 20 μm. B Cell lysates from sh-Ctrl and sh-Drp1 PT130 cells were analyzed for the expression of Drp1, GYS1 and β-actin using western blot. C Representative western blots as shown in (B) were quantified to determine the relative GYS1 levels by normalizing GYS1 to β-actin. Data were presented as mean ± SD (n = 3, *p < 0.05 and **p < 0.01). D sh-Ctrl and sh-Drp1 PT130 cells cultured in low glucose media were analyzed for the expression of GYS1 mRNA using RT-qPCR. Data were presented as mean ± SD (n = 3, ***p < 0.001). E Sh-Ctrl and sh-Drp1 PT130 cells were transfected with non-targeting (siCtrl) or GYS1-specific siRNA to silence GYS1 expression. Cell lysates were analyzed for the expression of Drp1, GYS1, p-AMPK, AMPK, and β-actin using western blot. F Sh-Ctrl and sh-Drp1 PT130 cells were transfected as described in (E). Representative confocal images were obtained from cells stained with the anti-glycogen antibody. Scale Bar, 10 μm. G The relative fluorescence intensity of glycogen staining was quantified using ImageJ fluorescence analyzer. Data were presented as mean ± SD (n = 20, *p < 0.05 and ****p < 0.0001).
Fig. 3
Fig. 3. Increased GYS1 expression in Drp1 knockdown cells is transcriptionally regulated by AMPK.
A Cell lysates of sh-Ctrl, sh-Drp1 PT130 cells were analyzed for the expression of Drp1, GYS1, phospho-AMPK (p-AMPK), total AMPK and β-actin using western blot. B Representative western blot as shown in (A) were quantified to determine the relative p-AMPK levels by normalizing p-AMPK to total AMPK. Data were presented as mean ± SD (n = 3, *p < 0.05 and **p < 0.01). C Sh-Ctrl and sh-Drp1 PT130 cells were treated with DMSO or AMPK inhibitor compound C (AMPKi, 10 μM) for 24 h in low glucose media. Cell lysates were analyzed for the expression of Drp1, GYS1, p-AMPK, phospho-ACC (p-ACC), total ACC, total AMPK, and β-actin using western blot. D Representative western blots as shown in (C) were quantified to determine the relative GYS1 levels by normalizing GYS1 to β-actin. Data were presented as mean ± SD (n = 3, *p < 0.05, **p < 0.01, ***p < 0.001 and ****p < 0.0001). E The relative expression of GYS1 mRNA was determined using RT-qPCR in sh-Ctrl and sh-Drp1 PT130 cells treated with DMSO or AMPKi. Data were presented as mean ± SD (n = 3, *p < 0.05, **p < 0.01, ***p < 0.001 and ****p < 0.0001). F Sh-Ctrl and sh-Drp1 PT130 cells were treated with DMSO or AMPKi in low glucose media for 24 h. Representative confocal images were obtained from cells stained with the anti-glycogen antibody. Scale Bar, 10 μm. G The relative fluorescence intensity of glycogen staining was quantified using ImageJ fluorescence analyzer. Data were presented as mean ± SD (n = 20, *p < 0.05 and ****p < 0.0001).
Fig. 4
Fig. 4. Depletion of Drp1 in APC-derived tumor organoids increases glycogen storage.
A Apcf/f/Vil-CreERT2 (Apc) and Apcf/f/Drp1f/f/Vil-CreERT2 (Apc/Drp1-KO) organoids were cultured in 3D Matrigel for 4 days. Cell lysates from organoids were analyzed for the levels of Drp1, Gys1, p-Acc, total Acc, p-Ampk, total Ampk and β-actin using western blot. BD Representative western blots as shown in (A) were quantified to determine the expression Gys1, p-Ampk and p-Acc. The relative expression levels of Gys1 were obtained by normalizing Gys1 to β-actin (B), whereas the phosphorylation levels of Ampk and Acc were determined by normalizing p-Ampk and p-Acc to that of total AMPK and Acc, respectively (C, D). Data were presented as mean ± SD (n = 4, *p < 0.05, **p < 0.01 and ***p < 0.001). E The relative expression of Gys1 mRNA was determined using RT-qPCR in Apc and Apc/Drp1-KO organoids. Data were presented as mean ± SD (n = 6, *p < 0.05). F Representative confocal images were obtained from Apc and Apc/Drp1-KO organoids stained with the anti-glycogen antibody. Scale Bar, 20 μm. G The relative fluorescence intensity of the glycogen staining was quantified using ImageJ fluorescence analyzer. Data were presented as mean ± SD (n = 20, *p < 0.05). H Apc and Apc/Drp1-KO organoids cultured in 3D Matrigel for 3 days were labeled with EdU to mark proliferating cells. EdU positive cells were visualized using Click-it EdU Alexa 594. I The percentage of EdU positive cells were quantified in Apc and Apc/Drp1-KO organoids. Data were presented as mean ± SD (n = 30, ****p < 0.0001). J The relative cell growth of Apc and Apc/Drp1-KO organoids were quantified using the CellTiter-Glo 3D Luminescent Cell Viability Assay Kit. The luminescence signals were normalized to the number of organoids formed. Data were presented as mean ± SD (n = 6, **p < 0.01).
Fig. 5
Fig. 5. Depletion of Drp1 increases glycogen storage in vivo.
A Sh-Ctrl and sh-Drp1 PT130 cells were injected subcutaneously into NSG mice. Tumor tissues from both groups were analyzed for the expression of Drp1, GYS1 and β-actin using western blot. B The relative GYS1 levels in sh-Ctrl and sh-Drp1 tumors detected by western blot as shown in (A) were quantified by normalizing GYS1 to β-actin. Data were presented as mean ± SD (n = 4, *p < 0.05). C Representative images were obtained from sh-Ctrl and sh-Drp1 tumor sections stained with the anti-glycogen antibody. Scale bar, 200 μm. D The percentage of glycogen positive cells were quantified in tumors from four mice of each group using the HALO software. Data were presented as mean ± SD (n = 4, **p < 0.01). E TCGA COAD RNA-seq dataset was first used to identify genes that have positive or negative correlations with Drp1 (gene name: DNM1L) expression. The GSEA was then performed to determine if DNM1L expression is associated with gene sets in the REACTOME collection. The name of the gene sets and the corresponding normalized enrichment score (NES) and false discovery rate (FDR) are listed in the graph (the cutoff for significance is set for FDR < 0.05).
Fig. 6
Fig. 6. Increased glycogen storage functions as a survival mechanism in Drp1 knockdown cells.
A Sh-Ctrl and sh-Drp1 PT130 cells were cultured in regular growth media or glucose-free medium for 48 h. The percentage of cell survival were obtained by normalizing the number of cells survived in glucose-free media to that of regular growth media. Data were presented as mean ± SD (n = 6, **p < 0.01 and ***p < 0.001). B Sh-Ctrl and sh-Drp1 PT130 cells were cultured in low glucose or glucose-free media for 24 h. Representative confocal images were obtained from cells stained with the anti-glycogen antibody. Scale Bar, 10 μm. C The relative fluorescence intensity of glycogen staining was quantified using ImageJ fluorescence analyzer. Data were presented as mean ± SD (n = 20, *p < 0.05, **p < 0.01 and ****p < 0.0001). D Sh-Ctrl and sh-Drp1 PT130 cells were treated with irinotecan, DAB or combinations of both agents for 48 h. Cells treated with DMSO were used as control. The relative of cell survival were obtained by normalizing to cells treated with DMSO. Data were presented as mean ± SD (n = 6, *p < 0.05, **p < 0.01, ***p < 0.001 and ****p < 0.0001). E Results from our study demonstrate that disruption of mitochondrial dynamics as a consequence of silencing Drp1 increases glucose uptake and AMPK-dependent transcriptional activation of GYS1. Subsequently, GYS1-mediated glycogen accumulation serves as a compensatory survival mechanism to protect colon cancer cells from glucose starvation and chemotherapy treatment. Thus, co-targeting glycogenolysis may provide a novel strategy to sensitize Drp1 knockdown cells to chemotherapy.

References

    1. Martinez-Reyes I, Chandel NS. Cancer metabolism: looking forward. Nat Rev Cancer. 2021;21:669–80. doi: 10.1038/s41568-021-00378-6. - DOI - PubMed
    1. Chan DC. Mitochondrial dynamics and its involvement in disease. Annu Rev Pathol. 2020;15:235–59. doi: 10.1146/annurev-pathmechdis-012419-032711. - DOI - PubMed
    1. Chen H, Chan DC. Mitochondrial dynamics in regulating the unique phenotypes of cancer and stem cells. Cell Metab. 2017;26:39–48. doi: 10.1016/j.cmet.2017.05.016. - DOI - PMC - PubMed
    1. Li J, Huang Q, Long X, Guo X, Sun X, Jin X, et al. Mitochondrial elongation-mediated glucose metabolism reprogramming is essential for tumour cell survival during energy stress. Oncogene. 2017;36:4901–12. doi: 10.1038/onc.2017.98. - DOI - PubMed
    1. Kalia R, Wang RY, Yusuf A, Thomas PV, Agard DA, Shaw JM, et al. Structural basis of mitochondrial receptor binding and constriction by DRP1. Nature. 2018;558:401–5. doi: 10.1038/s41586-018-0211-2. - DOI - PMC - PubMed

Publication types